Sample Category Title
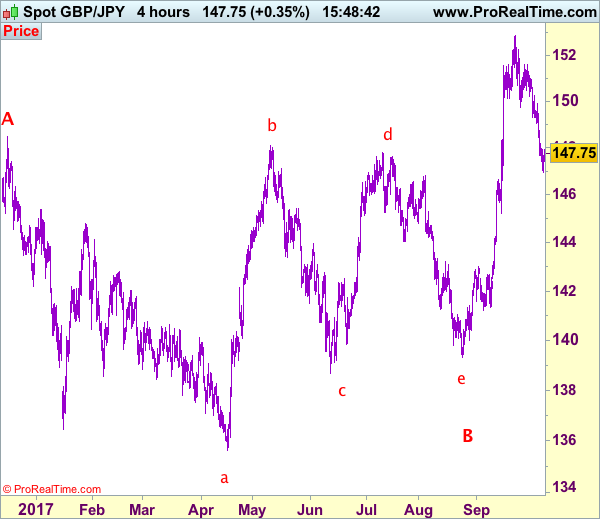
Trade Idea: GBP/JPY – Target met and stand aside
GBP/JPY - 147.75
Original strategy:
Sold at 151.00, met target at 149.00
Position: - Short at 151.00
Target: - 149.00
Stop: -
New strategy :
Stand aside
Position: -
Target: -
Stop:-
Sterling dropped in line with our bearish expectation and our short position entered at 151.00 met downside target at 149.00 with 200 points profit, this anticipated decline adds credence to our view that top has been formed at 152.85, however, as price has recovered from 146.95, minor consolidation above this level would be seen and corrective bounce to 148.10-20 cannot be ruled out, having said that, reckon upside would be limited to 148.60-70 and 148.95-00 should hold, bring another decline later.
In view of this, would not chase this fall here and would be prudent to sell sterling again on subsequent recovery as 149.00 should limit upside. Below said support at 146.95 would signal the decline from 152.85 top is still in progress, then further fall to 146.60-65 and possibly 146.00 would follow but previous support at 145.25 would remain intact due to loss of downward momentum.
Our preferred count is that larger degree wave V with circle is unfolding from 251.12 with wave (I) 219.34, (II): 241.38 and wave (III) is subdivided into 1: 192.60, 2: 215.89 (23 Jul 2008) and wave 3 ended at 118.87 earlier in 2009. The correction from there to 162.60 is wave 4 which itself is a double three and is labeled as first a-b-c ended at 151.53, followed by wave x at 139.03, 2nd a ended at 162.60, 2nd b at 146.75 and 2nd c leg of wave 4 ended at 163.00. Therefore, the decline from 163.00 to 116.85 is now treated as wave 5 which also marked the end of larger degree wave (III), hence wave (IV) major correction has commenced for retracement of the wave (III) from 241.38 and upside target at 183.95-00 (50% Fibonacci retracement of the wave (II) from 241.38) had been met, a drop below 160.00 would suggest wave (IV) has ended at 195.85, bring decline in wave (V) for initial weakness to 130 (already met) and 120.
Daily Technical Analysis: EURUSD, GBPUSD, USDJPY, USDCHF
EURUSD
The EURUSD continued to trade lower last week, hit a fresh five-week low at 1.1669 as a part of the bearish correction phase since fell from 1.2090. The bias is neutral in nearest term but as long as stay below 1.1850 price is still in a bearish correction zone testing 1.1600 region. Immediate resistance is seen around 1.1765 (H1 EMA 200). A clear break above that area could trigger further bullish pressure testing 1.1850 region. On the downside, a clear break and daily close below 1.1600 would expose 1.1450 area.
GBPUSD
The GBPUSD continued to trade lower last week hit a fresh three-week low at 1.3027. The bias is bearish in nearest term as a part of the bearish phase since formed a bearish pin bar after a false break above 1.3615 as you can see on my daily chart below, targeting the trend line support and the daily EMA 200 located around 1.2950 which is a good place to buy with a tight stop loss. Immediate resistance is seen around 1.3150. A clear break above that area could lead price to neutral zone in nearest term testing 1.3220 region. On the downside, a clear break below 1.2950 would change my major technical outlook to a neutral condition.
USDJPY
The USDJPY attempted to push higher last week slipped above 113.20 key resistance but closed lower at 112.65, formed a bearish pin bar as you can see on my daily chart below. The bias is bearish in nearest term testing 111.65 support area. A clear break and daily close below that area could trigger further bearish pressure testing 111.00 – 110.70 region. On the upside, a clear break and daily close above 113.20 key resistance would expose 114.50 area. Overall I remain neutral.
USDCHF
The USDCHF had a bullish momentum last week topped at 0.9836 but closed a little bit lower at 0.9777, printed a bearish pin bar formation as you can see on my daily chart below. Price is in a critical point. The bias is neutral in nearest term probably with a little bearish bias testing 0.9750/00 support area. On the upside, a clear break and daily close above 0.9807/36 would activate my bullish mode with nearest target seen around 0.9950/65 region.
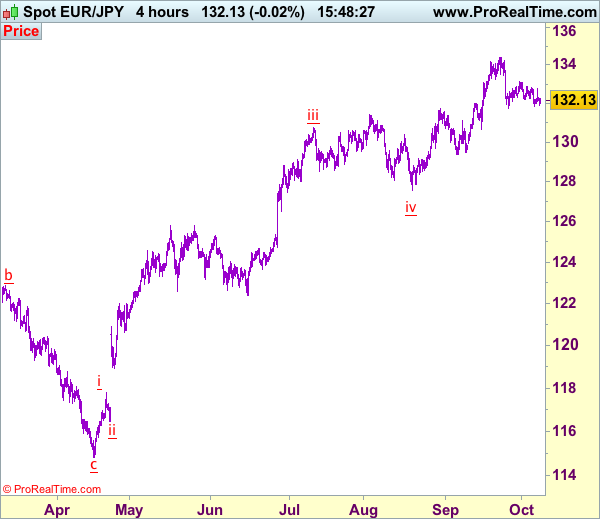
Trade Idea: EUR/JPY – Sell at 132.40
EUR/JPY - 132.16
Original strategy:
Sell at 133.25, Target: 131.75, Stop: 133.85
Position: -
Target: -
Stop: -
New strategy :
Sell at 132.40, Target: 130.70, Stop: 133.00
Position: -
Target: -
Stop:-
The single currency continued finding support just above previous support at 131.75 and recovered, suggesting further consolidation would take place and recovery to 132.40-50 cannot be ruled out, however, reckon resistance at 132.77 would limit upside and bring another decline later, below said support at 131.75 would add credence to our view that top has been formed at 134.41 and the fall from there would bring retracement of recent rise to 131.00-05, break there would extend this decline towards support at 130.62 which is likely to hold from here.
In view of this, we are looking to sell euro on recovery as 132.40-50 should limit upside. Above resistance at 132.77 would risk test of indicated resistance at 133.12 but break there is needed to retain near term bullishness and extend the rebound from 131.75 to previous support at 133.43, however, upside should be limited to 134.00 and price should falter well below said resistance at 134.41, bring further consolidation.
Our latest preferred count is that wave (ii) is ABC-X-ABC which ended at 123.33 and wave (iii) is unfolding with wave iii ended at 100.77, followed by wave iv at 111.57 and wave v as well as the wave (iii) has ended at 97.04, followed by wave (iv) at 111.43 and wave (v) has ended at 94.12 which is also the end of the larger degree v, this also implied the major wave (C) has also ended there, hence major correction has commenced from there with (A) leg unfolding in its lower degree wave c which has possibly ended at 145.69. Under this count, A-B-C wave (B) has commenced with A leg ended at 136.23, wave B at 143.79 and wave C has possibly ended at 149.79.
Our larger degree count is that the decline from 139.26 is wave (C) and is sub-divided into a diagonal triangle i-ii-iii-iv-v with wave i - 105.44, wave ii- 123.33, wave iii - 97.03, wave iv - 111.43, followed by the final wave v as well as the end of wave (C) at 94.12, this also mark the bottom of larger degree wave B. Under this count, major rise in wave C has commenced as an impulsive wave with minor wave III ended at 145.69, wave V is still in progress for further gain to 150.00. Having said that, this so-called wave V could well be the first leg of larger degree 5-waver wave C and this wave C should bring at least a retest of wave A top at 169.97 (July 2008).
Politics, Earnings & Economic Data To Dominate Markets This Week
The Turkish Lira was the worst performing currency early Monday, after the U.S. and Turkey announced the suspension of visa services for citizens looking to visit each country. Traders responded aggressively to the news, sending the Lira more than 6% lower against the U.S. currency - its steepest decline since 15July 2016, when Turkey witnessed the bloodiest coup attempt in its political history. However, the Lira managed to recover more than half of its losses, as investors viewed the recent tensions as controllable. With Turkey increasing political ties with Russia and Iran, and Washington continuing to support Kurdish groups, the political risk premium is likely to keep pressuring the Lira. However, it would require far more escalation to see the currency trading near January lows of 3.94.
Precious metals continued to benefit from a Russian report on Friday,stating that North Korea is preparing to test a long-range missile, believed to have the capacity to reach the West Coast of America. Gold added $24 from Friday’s lows of $1,260. Gold has been in a downtrend since 9 September, as expectations of tighter monetary policies in the U.S. and elsewhere became the most dominant factor impacting the price of the precious metal. Investors now are trying to evaluate whether geopolitical risks or monetary policy will have the greater impact, and this all depends on whether the U.S. – North Korean tensions, will intensify or de-escalate from current levels.
Sterling will also be politically driven as negotiations between the U.K. and E.U. officials resume today. We have reached the fifth round of negotiations with no clear plans on how the U.K. will depart from the E.U. If talks end this week without any agreements, we will likely see the pound dropping below 1.30.
U.S. equity investors will shift their attention from fiscal policy plans to the earning season. The estimated growth rate for the S&P 500 is 2.8% according to FactSet, with seven sectors expected to report earnings growth for Q3. Given that earnings growth estimates have fallen by 2.2% from 5 September, there’s a lot of room to see positive surprises. This week, banks will be the major driver for WallStreet, with JP Morgan, Bank of America, Citi Group and Wells Fargo, due to report their results.
On the data front, U.S. September’s CPI on Friday will be the most watched economic figure after U.S. wages grew 2.9% from last year, their biggest gain since December 2016. Whether higher wages will translate into higher or lower inflation, will remain a mystery. The core inflation figure should be of greater importance, given that the surge in gas prices is likely to disrupt the headline reading. Traders will also closely scrutinize the FOMC minutes on Wednesday, but given that expectations of a rate hike in December stand at 80%, the impact on U.S. Treasury yields and the dollar is likely to be insignificant.
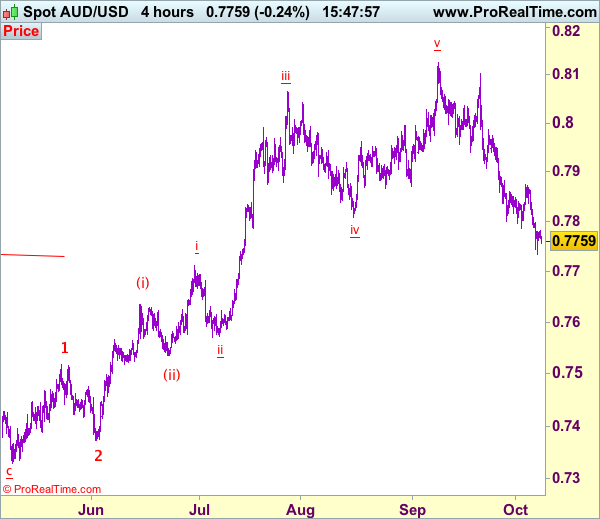
Trade Idea: AUD/USD – Sell at 0.7850
AUD/USD – 0.7759
Original strategy:
Sell at 0.7940, Target: 0.7740, Stop: 0.8000
Position: -
Target: -
Stop:-
New strategy :
Sell at 0.7850, Target: 0.7700, Stop: 0.7910
Position: -
Target: -
Stop:-
Aussie only recovered to 0.7875 before dropping again, adding credence to our view that the fall from 0.8125 top is still in progress, hence mild downside bias remains for this decline to extend weakness to 0.7700-10, however, loss of near term downward momentum should prevent sharp fall below 0.7660-65 and reckon 0.7600-10 would hold from here, bring rebound later.
In view of this, we are looking to sell aussie again on recovery as said resistance at 0.7875 should limit upside and bring another decline. Above previous support at 0.7908 (now resistance) would defer and risk a stronger rebound to 0.7950 but resistance at 0.7986 should remain intact and bring another decline later.
On the 4-hour chart, recent upmove from 0.7329 is unfolding as an impulsive rise with wave 3 as well as smaller degree wave (iii) extending, only minor wave v of (iii) has ended at 0.8125, hence bullishness remains for this move to extend headway to 0.8200, then towards 0.8300, however, reckon upside would be limited to 0.8400 and the final wave 5 should falter below 0.8500, bring correction later.
EURUSD Remains Under Pressure Below 50-Day Moving Average
EURUSD remains under pressure as it extends its decline following a retracement from the September 8 peak of 1.2091, a level not seen since December 2014. Risk is clearly titled to the downside.
After the uptrend from the 1.08-area that started in April lost steam, the market made lower highs and lower lows as it drifted lower. The short-term bias turned increasingly bearish after prices dropped below the 50-day moving average.
EURUSD fell near support at 1.1661 on Friday before rebounding. A daily close below this level will increase the odds for a sustained move down to 1.1471. This level is around the 50% Fibonacci retracement of the rise from 1.0820 to 1.2091. A deeper decline would target 1.1290 and then from here focus turns to 1.0800.
Should momentum turn to the upside, the market would need to clear resistance at the 50-day MA and at 1.1900 in order to target the 1.2091 peak. Breaking above this resistance would open the way to the 1.23-handle.
EURUSD remains vulnerable to more weakness and the short-term bias is expected to remain bearish. Only a move back above 1.1900 would indicate the bearish phase has ended. Both RSI and MACD are in bearish territory, suggesting more downside is possible. But the flat RSI is pointing to some consolidation at current levels. A resumption of the short-term downtrend would change the bigger picture and shift the market structure from neutral to bearish
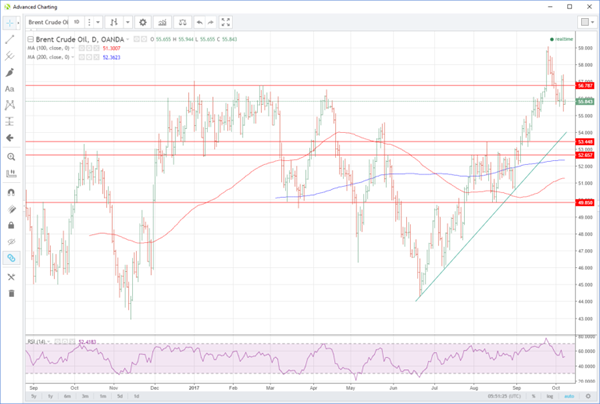
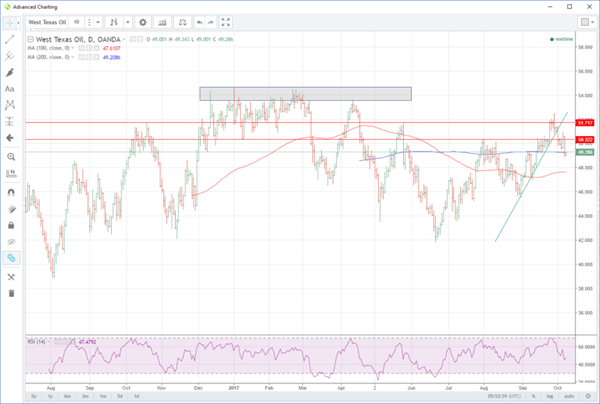
Saudi Arabia And Russia Puncture Oil’s Recovery
Saudi Arabia and Russian backpedalling popped oil's balloon on Friday as Hurricane Nate props up prices in Asia.
The rot set in as both Russia and Saudi Arabia seem to backtrack on their comments that a one-year extension of the production cut was a done deal, with comments softening this stance to an “all options are on the table” tone. This was more the straw that broke the camel's back as it was the excuse that short-term speculators needed to head en-masse for the door and aggressively cut longs into the weekend. One suspects, in fact, this move would have occurred on Thursday had the Saudis and Russia not been so upbeat.
Oil has found some relief this morning, with both contracts slightly higher at 55.90 and 49.30 respectively, as Hurricane Nate shut down 90.0 % of the U.S. offshore crude production over the weekend. Additionally, much of the refining capacity is temporarily shut across the Gulf seaboard as well as a precaution. The dead cat bounce though suggests that the support may only be transitory.
Brent spot has support at 54.90 initially with a break suggesting a test of the trend line support at 54.00 is on the cards. Resistance is now at 57.40, a formidable looking double top.
WTI spot is toying with its 200-day moving average at 49.20 with support close behind at 48.85. A break signals a test of 48.00 and then 47.60, the 100-day moving average. Resistance rests at 50.60 and then 51.00.
Silver's price action is particularly constructive given the general strength of the U.S. dollar and its lower beta to geopolitical noise then gold. Time will tell as to whether this reflected its more oversold condition, or whether it is a general signal that the worst may be over for the precious metal correction.
Euro’s Recovery Remains Capped Vs US Dollar
Key Highlights
The Euro declined this past week and traded below the 1.1700 support against the US Dollar.
There is a contracting triangle forming with resistance at 1.1750 on the 4-hours chart of EUR/USD.
This past week in the US, the Nonfarm payrolls figure released by the US Department of Labor for Sep 2017 posted a decline of 33K, compared with the forecast of +90K.
The US unemployment rate in Sep 2017 declined from the last 4.4% to 4.2%.
EURUSD Technical Analysis
The Euro was under a lot of pressure this past week and declined below 1.1700 against the US Dollar. After disappointing NFP results, the EUR/USD pair found support at 1.1670.
The pair is currently recovering and is trading above the 1.1700 handle. However, there is a contracting triangle forming with resistance at 1.1750 on the 4-hours chart.
The 23.6% Fib retracement level of the last decline from the 1.2004 high to 1.1669 low is also near the triangle resistance. Therefore, it won't be easy for buyers to break the 1.1750 resistance zone.
Should there be a close above 1.1750, the pair will most likely test the 50% Fib retracement level of the last decline from the 1.2004 high to 1.1669 low at 1.1840.
US Nonfarm Payrolls
This past week in the US, the Nonfarm payrolls figure for Sep 2017 was released by the US Department of Labor. The forecast was slated for a reading of 90K compared with the last 156K.
The actual result was on the lower side, as there was a decline of 33K in the NFP. However, the last reading was revised up from 156K to 169K. On the positive side, the US unemployment rate in Sep 2017 declined from the last 4.4% to 4.2%.
The report stated:
Total nonfarm payroll employment was little changed in September (-33,000), after adding an average of 172,000 jobs per month over the prior 12 months. In September, a steep employment decline in food services and drinking places and below-trend growth in some other industries likely reflected the impact of Hurricanes Irma and Harvey. Employment rose in health care and in transportation and warehousing.
The overall result was on the negative sign, which lifted the EUR/USD pair from the 1.1669 low. There are chances of more gains in the near term, but the pair faces many hurdles like 1.1750 and 1.1840.
EUR/USD Candlesticks and Ichimoku Analysis
Weekly
• Last Candlesticks pattern: Shooting star
• Time of formation: 31 Jul 2017
• Trend bias: Near term up
Daily
• Last Candlesticks pattern: Shooting star
• Time of formation: 2 Aug 2017
• Trend bias: Up
EUR/USD – 1.1735
Although the single currency recovered after Friday’s brief fall to 1.1669 and consolidation above this level would be seen and test of the Tenkan-Sen (now at 1.1766) cannot be ruled out, however, a daily close above resistance at 1.1788 is needed to signal low is formed at 1.1669, bring test of 1.1833 resistance, a sustained breach above there would provide confirmation, then a stronger rebound to the Kijun-Sen (now at 1.1881) would follow but reckon upside would be limited to 1.1935-40 and price should falter below resistance at 1.2005, bring another retreat later.
On the downside, below said support at 1.1662-69 would signal the corrective decline from 1.2093 top is still in progress for retracement of recent upmove, hence weakness to the lower Kumo (now at 1.1599) would follow but a sustained breach below there is needed to retain bearishness, bring further fall to 1.1550, then towards 1.1500, having said that, previous support at 1.1479 should limit downside and 1.1466 (50% Fibonacci retracement of 1.0839-1.2093) should hold on first testing.
Recommendation: Buy at 1.1620 for 1.1820 with stop below 1.1520.
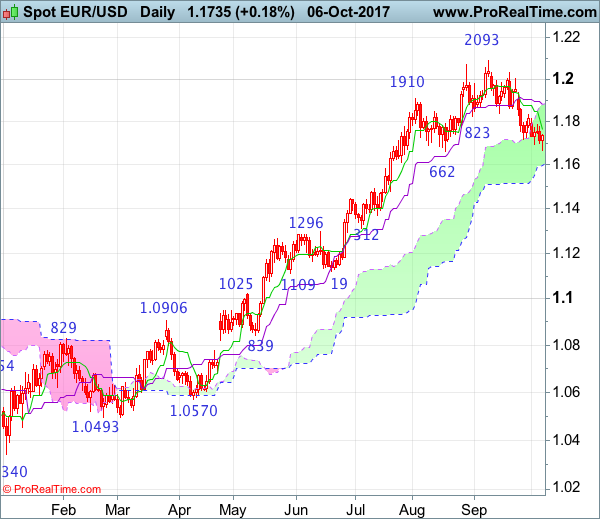
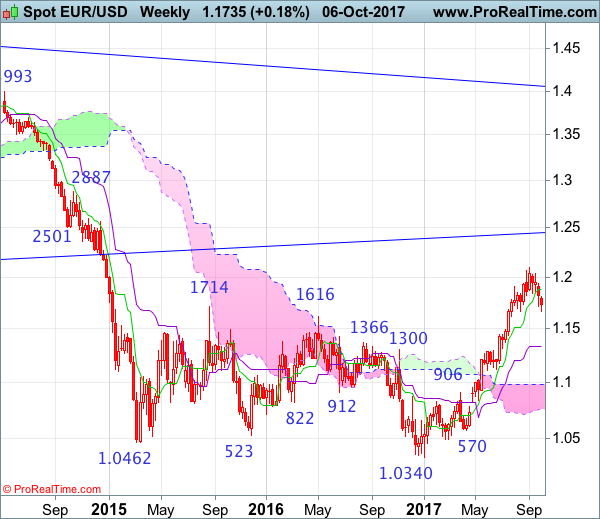
On the weekly chart, as euro has recovered after falling to 1.1669 late last week, suggesting consolidation would be seen and recovery to 1.1800 cannot be ruled out, however, reckon upside would be limited to the Tenkan-Sen (now at 1.1878) and resistance at 1.1937 should hold, bring another retreat later, below said support at 1.1669 would signal the retreat from 1.2093 top is still in progress for retracement of recent rise to 1.1610-15 (38.2% Fibonacci retracement of 1.0839-1.2093) where renewed buying interest should emerge and 1.1550 should hold, bring another upmove later. Below 1.1510-20 would defer and risk correction to 1.1460-70 (50% Fibonacci retracement), however, downside should be limited to 1.1400 and the Kijun-Sen (now at 1.1332) should hold.
On the upside, a weekly close above the Tenkan-Sen (now at 1.1878) would risk test of 1.1937 but still reckon resistance area at 1.2005-35 would remain intact, bring another retreat later. Above said resistance area would signal the pullback from 1.2093 has ended, bring retest of 1.2093, break there would extend recent rise from 1.0340 low to 1.2160-70 (50% Fibonacci retracement of 1.3993-1.0340) but loss of upward momentum should limit upside to 1.2220-30 and reckon 1.2300-10 would hold from here, price should falter well below 1.2390-00, bring another retreat later.
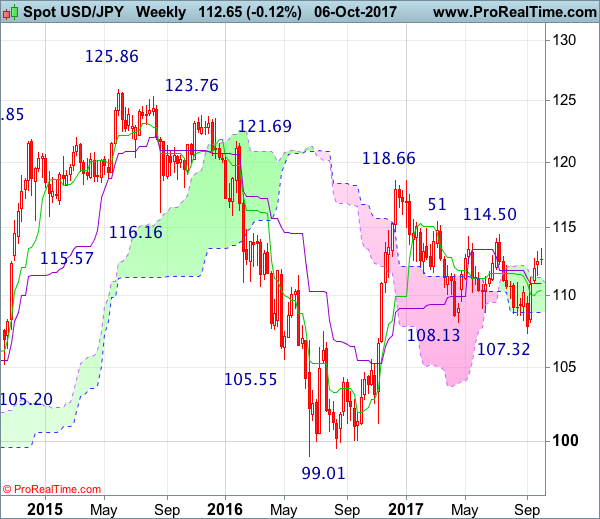
USD/JPY Candlesticks and Ichimoku Analysis
Weekly
• Last Candlesticks pattern: Dark cloud cover
• Time of formation: 10 Jul 2017
• Trend bias: Down
Daily
• Last Candlesticks pattern: Evening doji
• Time of formation: 7 Aug 2017
• Trend bias: Down
USD/JPY – 112.65
Although the greenback edged higher to 113.44 late last week, the subsequent retreat on Friday suggests consolidation below this level would be seen and test of support at 112.32 cannot be ruled out, however, break of 112.21 is needed to signal a temporary top has been formed, bring retracement of recent rise to another previous support at 111.47 and later towards 111.10-15, having said that, reckon downside would be limited and the Kijun-Sen (now at 110.38) should hold and bring rebound later.
On the upside, expect recovery to be limited to 113.10-15 and bring another retreat, above said resistance at 113.44 (last week’s high) would signal the rise from 107.32 low is still in progress for retracement of recent entire decline from 118.66, then gain to 114.00 and possibly towards 114.30-35 (61.8% Fibonacci retracement of 118.66-107.32) would follow, however, loss of upward momentum should prevent sharp move beyond resistance at 114.50 and price should falter well below 115.00.
Recommendation : Sell at 113.10 for 111.10 with stop above 114.10
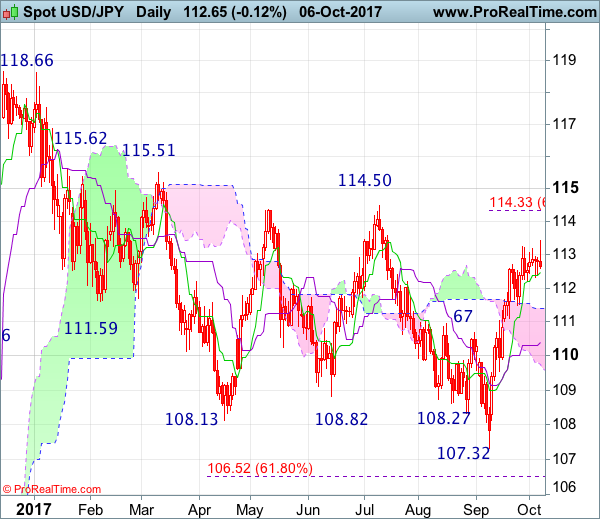
On the weekly chart, the greenback moved higher again to 113.44 last week, however, the retreat on Friday formed a doji star with a relatively long upper shadow, suggesting consolidation below this level would be seen and if this week ends with a long black candlestick, this would signal a potential reversal pattern is formed, then weakness to support at 111.47 cannot be ruled out, however, only a weekly close below the Kijun-Sen (now at 110.91) would add credence to this view, bring retracement of recent rise from 107.32 to the Tenkan-Sen (now at 110.38) and then 109.90-95 which is likely to hold from here.
On the upside, whilst recovery to 113.10-15 cannot be ruled out, last week’s high at 113.44 should hold, bring another retreat later. Above said resistance at 113.44 would extend the aforesaid rise from 107.32 to 114.00, then 114.30-35 (61.8% Fibonacci retracement) but resistance at 114.50 should limit upside and psychological level at 115.00 should hold from here, bring retreat later.