Sample Category Title
Nonfarm Payrolls Friday
The global financial markets converge on US nonfarm payrolls on Friday. The monthly report is expected to show a dismal pace of hiring for the world’s largest economy after a pair of devastating hurricanes ripped through the southern states of Texas and Florida.
European markets open with a report on German factory orders, which is due at 06:00 GMT. Orders are projected to climb 0.7% in August after falling 0.7% the month before. Compared to August 2017, factory orders likely rose 4.7%, forecasts show.
France will release its latest trade figures at 06:45 GMT. The Eurozone’s second-largest economy is expected to report a trade deficit of €5.4 billion, down from €6 billion the month before. Separately, MINEFA will also release the French budget balance for August.
Data on Spanish industrial production and Italian retail sales will be released over the next hour or so, leading us to the start of North American trade.
The US Department of Labor will release its nonfarm payrolls report at 12:30 GMT. The release is expected to show the addition of 90,000 nonfarm jobs in September, down from an August growth rate of 156,000. The jobless rate likely held steady at 4.4%.
Analysts say average hourly earnings probably rose 0.3% on month and 2.5% annually.
At the same time, the Canadian government will also release its latest jobs figures. Canada’s economy is projected to add 14,500 jobs in September, following a gain of 22,200 the month before.
Later in the session, Federal Reserve Governors William Dudley, Robert Kaplan and James Bullard will deliver speeches that will be closely monitored by the financial markets. The Fed will hold its second-to-last policy meeting of 2017 on 31 October, with the official rate statement scheduled for the following afternoon. No change in policy is expected until at least December.
EUR/USD
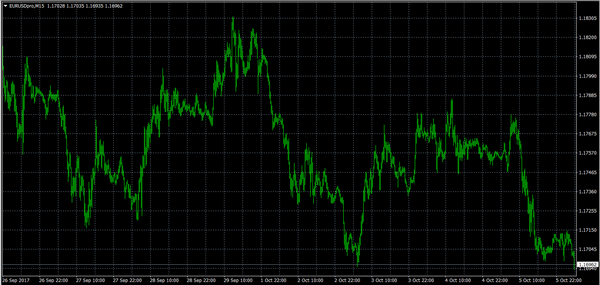
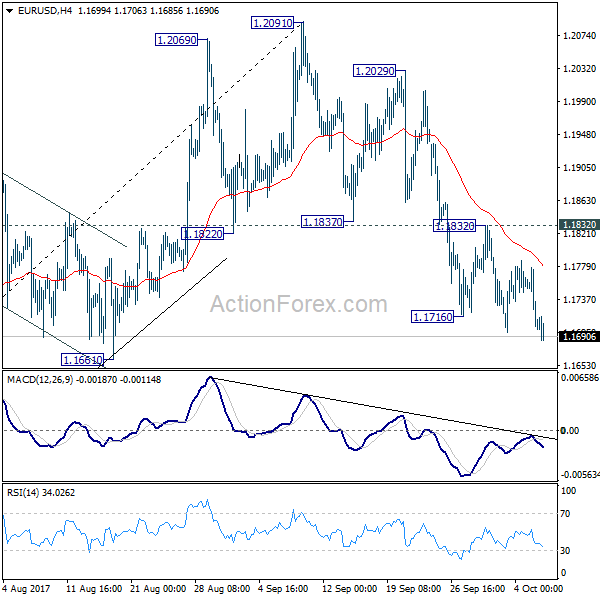
The euro reversed course on Thursday and is now trading below 1.17 US. The EUR/USD has been on a sharp downtrend for the past two weeks, as the dollar rebounded against a basket of world peers. Weakness below 1.1725 puts the pair on track for a re-test of the 1.1675 region. On the opposite side of the ledger, the immediate resistance zone is likely found around 1.1800.
USD/CAD
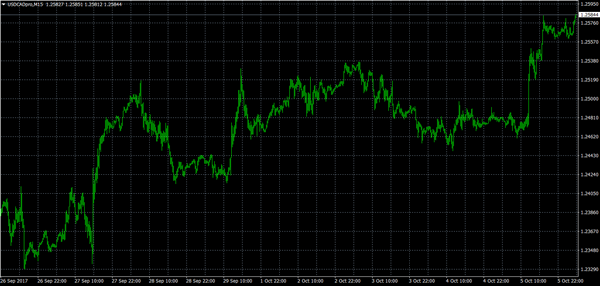
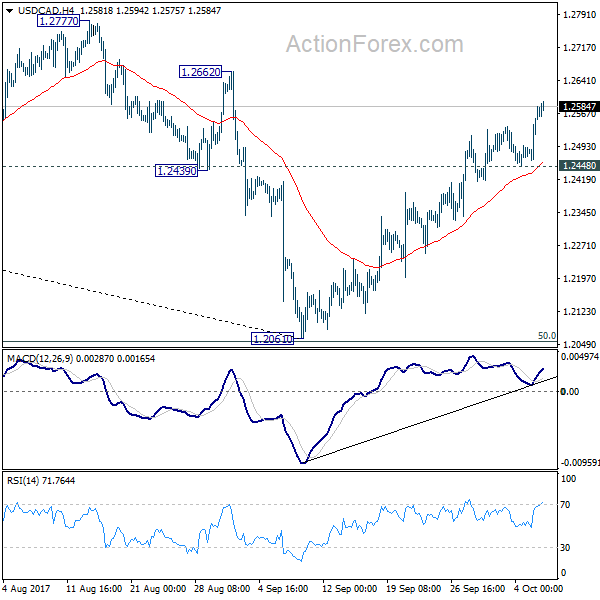
After a disastrous month of August, the USD/CAD has been on a gradual uptrend back toward the 1.2600 region. The pair is converging on that handle, having gained nearly 500 pips since 8 September. The Canadian dollar could see further upside in the months ahead as the Bank of Canada signals for higher interest rates. For now, the pair is looking to steamroll 1.2600 en route for two-month highs near 1.2700.
GBP/USD
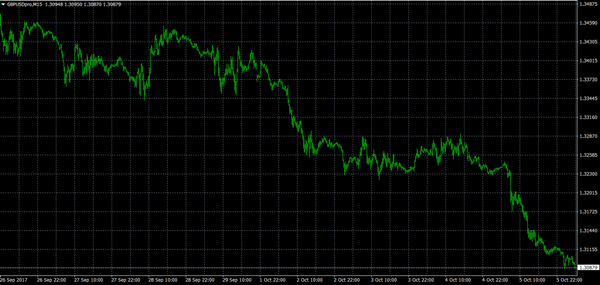
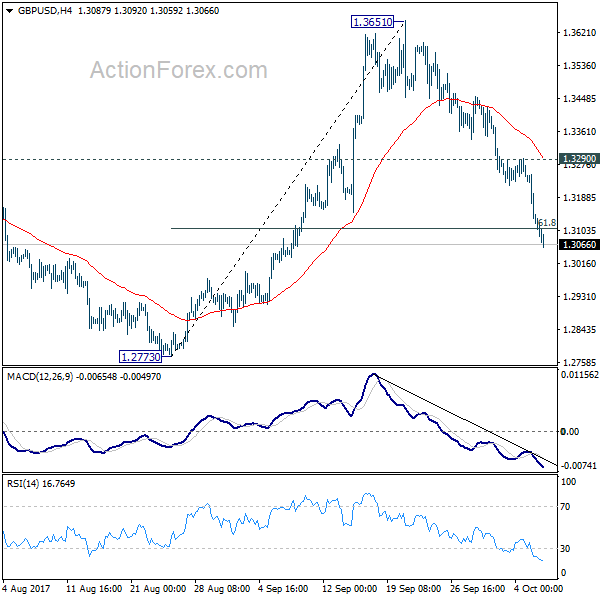
Cable broke below 1.31 on Friday to trade at one-month lows. The currency pair is down 0.3% at 1.3085. Although there are some signs that the selloff is overdone, a stronger dollar could push the GBP/USD back toward the critical 1.3000 threshold in the near term.
EUR/USD Daily Outlook
Daily Pivots: (S1) 1.1678; (P) 1.1729 (R1) 1.1759; More...
No change in EUR/USD's outlook. As long as 1.1832 resistance holds, fall from 1.2091 is expected to extend lower. Such decline is correcting whole rise from 1.0569. Deeper fall should be seen to 38.2% retracement of 1.0569 to 1.2091 at 1.1510, where we're expecting support to bring rebound. On the upside, break of 1.1832 minor resistance will suggest that the corrective fall is completed and turn bias back to the upside.
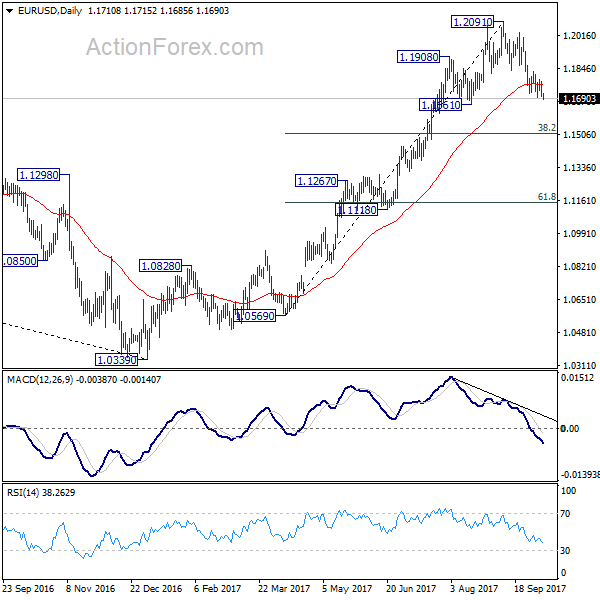
In the bigger picture, rise from medium term bottom at 1.0339 is not finished yet. It's expected to continue after pull back from 1.2091 completes. And, next target will be 38.2% retracement of 1.6039 (2008 high) to 1.0339 (2017 low) at 1.2516. However, it should be noted that there is no confirmation of trend reversal yet. That is, such rebound from 1.0399 could be a correction. And the long term fall from 1.6039 (2008 high) could resume. Hence, we'd be cautious on strong resistance from 1.2516 to limit upside.
GBP/USD Daily Outlook
Daily Pivots: (S1) 1.3066; (P) 1.3158; (R1) 1.3208; More....
GBP/USD's decline from 1.3651 is still in progress and dives to as low as 1.3059 so far. 61.8% retracement of 1.2773 to 1.3651 at 1.3108 is taken out but no sign of bottoming is seen. Intraday bias stays on the downside for 1.2773 support next. On the upside, break of 1.3290 resistance is needed to confirm short term bottoming. Otherwise, outlook will remain mildly bearish in case of recovery.
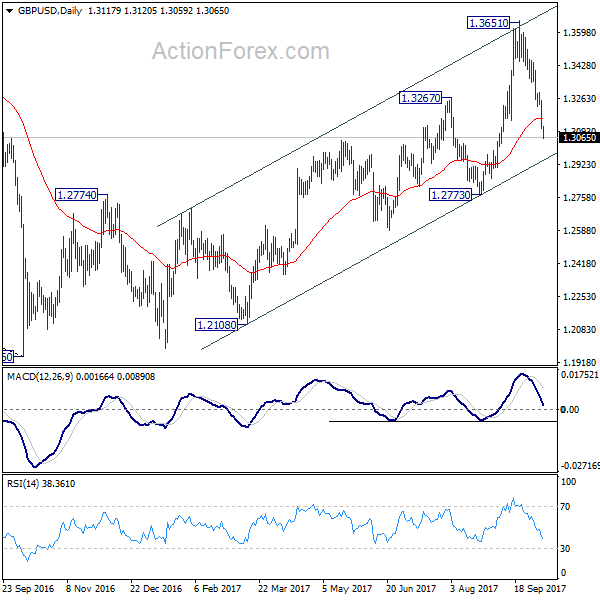
In the bigger picture, current development argues that the long term trend in GBP/USD has reversed. That is, a key bottom was formed back in 1.1946 on bullish convergence condition in monthly MACD. Current rise from 1.1946 will target 38.2% retracement of 2.1161 (2007 high) to 1.1946 (2016 low) at 1.5466 next. In any case, medium term outlook will now stay bullish as long as 1.2773 support holds.
USD/CHF Daily Outlook
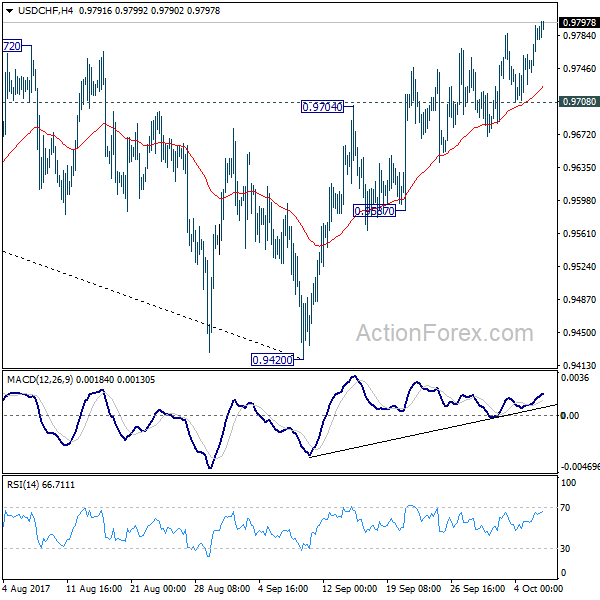
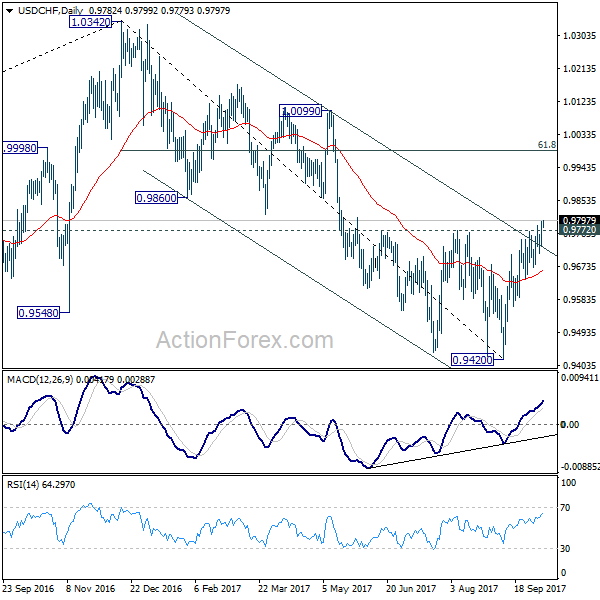
Daily Pivots: (S1) 0.9750; (P) 0.9773; (R1) 0.9805; More....
The break of 0.9772 resistance, and sustained trading above medium term channel resistance, argues that fall from 1.0342 is already completed. And the trend is reversing. intraday bias is now on the upside for 61.8% retracement of 1.0342 to 0.9420 at 0.9990. On the downside, break of 0.9708 support will dampen this bullish view and turn focus back to 0.9587 support instead.
In the bigger picture, current development suggests that USD/CHF has defended 0.9443 (2016 low) key support level again. Rise from 0.9420 could develop into a medium term move and target a test on 1.0342 high. This represents the upper end of a long term range that started back in 2015. On the downside, break of 0.9587 support is now needed to indicate completion of the rise from 0.9420. Otherwise, further rally will remain in favor in medium term.
USD/JPY Daily Outlook
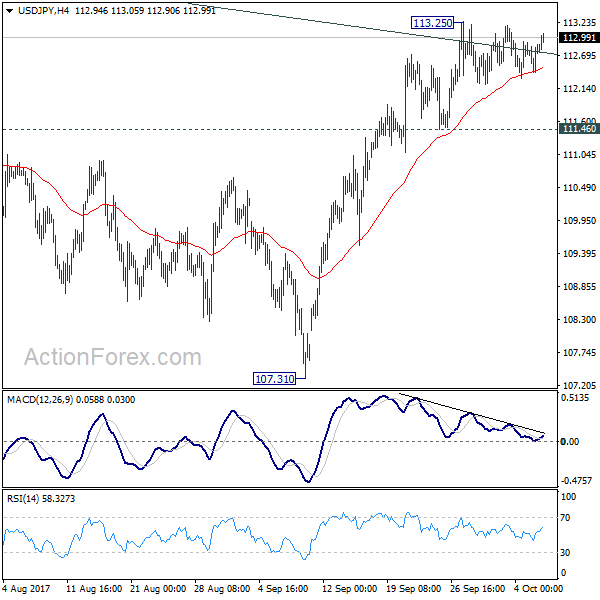
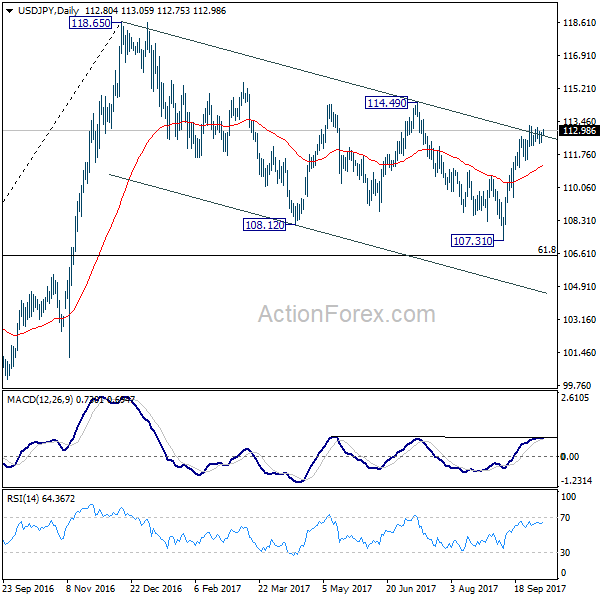
Daily Pivots: (S1) 112.51; (P) 112.71; (R1) 113.02; More....
Intraday bias in USD/JPY remains neutral as it's staying in tight range below 113.25. On the upside, sustained break of medium term channel resistance will argue that correction from 118.65 is already completed with three waves down to 107.31. Break of 114.49 will confirm this bullish case and target a test on 118.65 next. On the downside, considering bearish divergence condition in 4 hour MACD, break of 111.46 will suggest rejection from the channel resistance and turn bias back to the downside.
In the bigger picture, rise from 98.97 (2016 low) is seen as the second leg of the corrective pattern from 125.85 (2015 high). It's unclear whether this this second leg has completed at 118.65 or not. But medium term outlook will be mildly bearish as long as 114.49 resistance holds. And, there is prospect of breaking 98.97 ahead. Meanwhile, break of 114.49 will bring retest of 125.85 high. But even in that case, we don't expect a break there on first attempt.
US Dollar Eyeing Upside Break Ahead Of NFP Vs Japanese Yen
Key Highlights
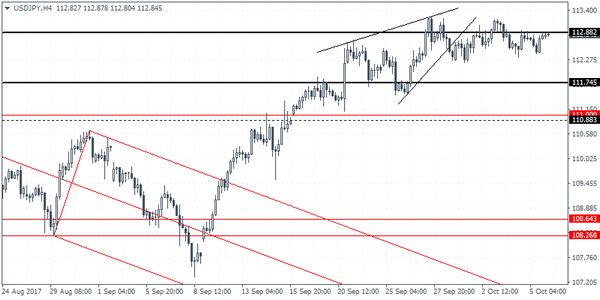
- The US Dollar is trading above the 112.50 support against the Japanese Yen, and poised for more gains.
- There is a crucial contracting triangle forming with resistance near 113.20 on the 4-hours chart of USD/JPY.
- Japan's Leading Economic Index in August 2017 (Prelim) came in at 106.8, up from the last 105.2.
- Today in the US, the Nonfarm payrolls figure will be released for Sep 2017, which is forecasted to register 90K, down from 156K.
USDJPY Technical Analysis
The US Dollar remains in a nice uptrend above 112.00 against the Japanese Yen. The USD/JPY pair seems to be preparing for an upside break above 113.20 to test 114.00 in the near term.
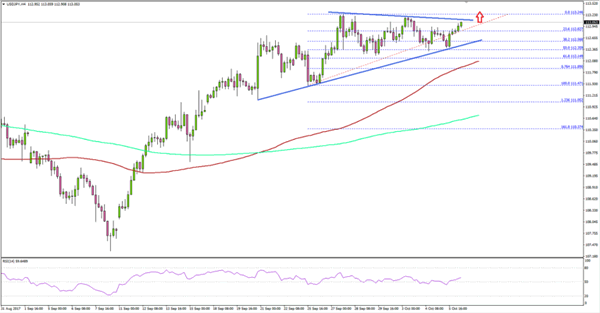
Looking at 4-hours chart, the pair is well above the 100 simple moving average (Red) and 112.20. It is a positive sign and points more gains in the near term above 113.00.
At the outset, there is a crucial contracting triangle forming with resistance near 113.20 on the same chart. If buyers remain in control, there is a chance of an upside break above the channel resistance at 113.20.
The next major hurdle is near 114.00. On the downside, the channel support at 112.50-60 is a major buy zone and most likely to protect declines in USD/JPY.
Japan's Leading Economic Index
Today in Japan, the Leading Economic Index preliminary reading for August 2017 was released by the Cabinet Office. The forecast was slated for an increase from the last reading of 105.2 to 107.2.
The actual result was on the lower side, as there was a rise to 106.8. On the other hand, the Coincident Index preliminary reading was forecasted to rise from 115.7 to 117.5 in August 2017. The actual was better, the index rose to 117.6.
The results were neutral and might not help the Japanese Yen, which means the USD/JPY remains poised for a move above 113.20.
Economic Releases to Watch Today
US nonfarm payrolls Sep 2017 – Forecast 90K, versus 156K previous.
US Unemployment Rate Sep 2017 – Forecast 4.4%, versus 4.4% previous.
US Average Hourly Earnings (MoM) Sep 2017 – Forecast 0.3%, versus 0.1% previous.
Canada's employment Change payrolls Sep 2017 – Forecast 14.5K, versus 22.2K previous.
Canada's Unemployment Rate Sep 2017 – Forecast 6.3%, versus 6.2% previous.
Canada's Ivey PMI Sep 2017 – Forecast 56.0, versus 56.3 previous.
USD/CAD Daily Outlook
Daily Pivots: (S1) 1.2489; (P) 1.2537; (R1) 1.2612; More....
Intraday bias in USD/CAD remains on the upside. Current rise from 1.2061 should target 1.2777 resistance next. Decisive break there will target key medium term fibonacci level at target 38.2% retracement of 1.4689 to 1.2061 at 1.3065. On the downside, below 1.2448 minor support will turn intraday bias neutral again.
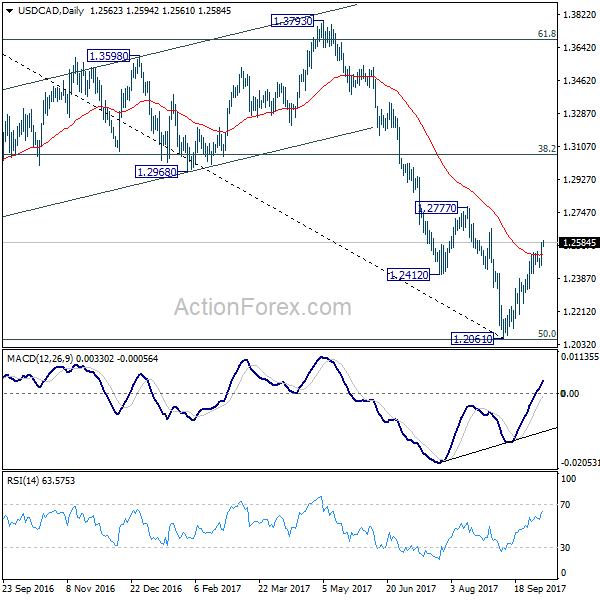
In the bigger picture, current development argues that USD/CAD has defended 50% retracement of 0.9406 (2011 low) to 1.4869 (2016 high) at 1.2048. And with 1.2048 intact, we'd favor the case that fall from 1.4689 is a correction. Break of 1.2777 will further affirm this bullish case. That is, larger up trend from 0.9406 is not completed. However, on the other hand, firm break of 1.2048 will indicate that fall from 1.4689 is at least a medium term down trend and should target 61.8% retracement at 1.1424 and below.
Beyond Influence – The Independence Of Central Banks
As the gatekeepers of a country's fiscal policies, central banks play an essential role in stabilising their local economy. The list of central bank responsibilities runs long, but in a nutshell, their primary duties include balancing monetary supply and demand;managing credit levels;supervising the growth of financial institutions and controlling interest rates. Proper management of these functions fosters economic growth and creates stability in the country.
Fulfilling these obligations is the type of balancing act that requires extra care, and a firm grasp on the rudiments that make up a healthy economy. Sometimes, however, a cautious fiscal mandate clashes with the reigning government's agenda; if the monetary policy is set by branches of the government, the economy's stability could be at risk.
Thanks to checks and balances in democracies, devious leaders rarely get away with attempts to undermine sensible economic policies as a way to appeal to voters, or promote a personal agenda. In certain third world countries however, a country's fiscal policy is often sacrificed by leaders who have a myopic way of thinking.
Jameel Ahmad, VP Corporate Development and Market Research at FXTM, says: “there are many examples of economies damaged by meddling leaders and their political aspirations, which go against the economic status quo. An incumbent may put pressure on their central bank to reduce interest rates during election time, because this may increase disposable income, boost economic growth and decrease unemployment – scenarios that would help the incumbent get re-elected.
However, these are short-lived gains because the haphazard act of loosening a country's monetary policy can cause the economy to grow faster and increase inflation, even to a point where it spirals out of control. Despite the negativity associated with politicians trying to exert undue influence on monetary policy, it is a common occurrence”.
Raghuram Rajan, the governor of the Reserve Bank of India, was recently squeezed out of his job by politicians belonging to the ruling Bharatiya Janata Party (BJP) party. In July 2017, the African National Congress, South Africa's ruling party, proposed that the South African Reserve Bank (SARB) be nationalised. As soon as the news hit, the Rand predictably fell, by around 1.5%, to R13.45 against the USD. While Finance Minister Malusi Gigaba keeps saying all the right things aimed at protecting the independence of the Reserve Bank, a sinister undertone may be implied. Nationalisation will, by its very nature, give the government more influence over policies.
Politicians like the money supply to increase before elections, because a reduction in interest rates stimulates economic activity; consumers increase borrowing and consumption. Businesses borrow more to invest in production, and employment figures start to look more attractive. However, this kind of economic stimulus precipitates inflation. Eventually, the economy goes into reverse, and there is a reduction in the money supply, while interest rates increase.
The mandate of a central bank is materially linked to a country's economic progress but they do not always rise to the challenge. Perhaps the most spectacular example is Venezuela's central bank, which can only be described as a catastrophe. The weakening economy of Venezuela under the regime of President Nicolas Maduro, is forecast by the International Monetary Fund (IMF) to reach a consumer-price inflation rate of a massive 1,640% by the end of 2017. This has been, in part, precipitated by the disastrous management of the central bank by Nelson Merentes, who was recently asked to step down as governor. The impact on the economy includes shortages of food staples such as milk, flour, and it has also resulted in medicinal shortages, electricity cuts, rising unemployment and a noticeable increase in crime.
In recent years, there has been an increasing trend to give monetary policy decisions to independent central banks. Countries that do this tend to fare better, according to research. In addition to making more measured economic decisions, a country with an independent monetary policy garners more credibility, which in turn earns more confidence from the international community. In and of itself, this helps maintain the favour of citizens, investors and ratings agencies.
“Central bank independence is a widely accepted practice today. Perhaps the bigger issue is whether they should wait for inflation to take hold before they act, or act when they see the first signs. Interest rates are good indicators of the health of an economy. Ideally, they should be allowed to rise and fall naturally as the economy expands or contracts, and they should not be influenced by political agendas” says Ahmad. As independent as they are, central banks will always be accountable to their masters, walking the fine line of holding onto independence while trying not to invoke the wrath of the institution that can pull the rug – the government.
The Great Cryptocurrency Wave Of The Financial Markets
The undeniable rise of digital currencies is blinking on every radar in the financial markets. With the proliferation of FinTech start-ups over the past several years (especially in the wake of the 2008 global financial crisis), finance is in the midst of an infrastructural revolution; the use of artificial intelligence and open-source applications is rapidly gaining more momentum as viable ways to transact, move funds, manage bank accounts and interact with trusted third parties. No innovation, however, has been as disruptive as cryptocurrencies – a computerised form of money that is beholden to no central bank and typically uses an online ‘ledger’ as an accounting database through which users can send each other virtual money.
In 2017, cryptocurrencies have experienced an astounding rise in value, while major currencies and traditional safe haven assets hobble to the beat of the geopolitical drum. Due to their unregulated and decentralized nature however, many countries have started to be extra cautious with cryptocurrencies. Chinese regulators have issued a comprehensive ban on platforms that allow people to buy or sell virtual currency in China. They also cracked down on Bitcoin trading and Bitcoin exchanges, which prompted BTCChina, one of the largest Bitcoin exchanges in the country, to cease all crypto operations by 30 September.
While big banks and governments come to grips with how to handle cryptocurrencies, they have become too prominent in discussions, and in the actual markets themselves, to be ignored. As a result, many forex brokers have jumped on the bandwagon and introduced cryptocurrencies into their list of trading instruments. Jameel Ahmad, the VP of Corporate Development and Market Research at FXTM, states that “FXTM has been keeping a very close eye on cryptocurrencies, and the increased consumer demand for these assets on a global level. Our commitment has always been to provide our traders with tailored solutions that fit their investment needs and the demand for cryptocurrency trading has been too vociferous to ignore. Although we offered the option to fund accounts with Bitcoin some time ago, we have recently introduced the option to trade cryptocurrencies on CFDs.”
The rising tide
Bitcoin, the prototype crypto that was birthed in late 2008, is the most commonly known digital coin in the world. Back in 2012, one Bitcoin wasn’t even worth $20. Today, that same Bitcoin is valued at a massive $4,000. This year alone, the currency experienced a 350% price increase from January to August, while Ethereum (a cryptocurrency associated to its eponymous open source platform) shot up by 3600% between January and June. Other cryptocurrencies have followed suite, including Litecoin which rose by 1600% between January and July.
Added to the fact that there is a growing trend to move away from centralized monetary systems, and a lack of trust in intermediaries often seen as impediments to efficient banking, the sudden surge of interest in digital currencies is tied to the recent upheavals that have shaken the traditional markets. Last year’s political shocks in the United Kingdom and the United States and the continuing tensions and political shakeups in the UK, North Korea, the US and the Middle East have all made traders wary. Naturally, this has significantly increased demand and fuelled interest in both consumers and institutions.
Are cryptocurrencies the new safe haven?
This is one of the biggest questions currently circling the watercoolers in brokerages and financial firms across the world. Traditionally, cryptocurrencies have a reputation for volatility, which would make the wary trader stay far away. Once news of BTC China’s closure broke, Bitcoin’s value dropped by a $1000 over the course of a few days. Although it quickly recovered, these types of big swings are exactly what makes traders cautious. The huge price swings that Ethereum, Dogecoin and Ripple experienced in this year alone has also made investors jittery. Some other traders, on the other hand, have dubbed Bitcoin as ‘digital gold’.
In March, Bitcoin’s value surpassed gold – the longest-standing safe haven asset for investors – in value, when the Bitcoin Price Index (BPI) marked the value of a single bitcoin at $1,238.11 and Bloomberg reported $1,237.73 per ounce for gold. Since then, gold has been oscillating in the $1200s range, while Bitcoin’s value has continued to rise. The ongoing tension between the US and North Korea is a good example of how the two assets reacted during the early days of the feud: Bitcoin broke through the $3,000 barrier before breaking another record and reaching over $4,000 – in a matter of days. Gold responded similarly, from $1258.80/oz. in early August and a steady rise to $31 as the threatening rhetoric between the two nations escalated.
It’s not surprising that some investors are perceiving digital coins as an alternative investment, but given the circumspect relationship between traditional financial institutions and cryptocurrencies, it is definitely too early to call them safe havens. Those traders who do would benefit from also implementing rigorous risk management practises in their trading.
As things stand, other brokers will most likely join FXTM in offering cryptocurrencies as an investment solution, but they will need to properly educate their traders and make sure they understand all the risks entailed when trading cryptocurrencies.
USDJPY Intraday Analysis
USDJPY (112.84): The USDJPY has remained steady near the 112.88 - 113.00 level for the past few sessions. This marks the long term test of the falling trend line as well which is currently acting as a dynamic resistance. A breakout off this level can only come by on an improved sentiment in the U.S. dollar. This coincides with today's payrolls report. However, a disappointing payrolls data despite the short term influence of the hurricanes could see the USDJPY remain range bound with the downside bias seeing a test of 111.74 support