
Sample Category Title
GBP/USD Daily Outlook
Daily Pivots: (S1) 1.3218; (P) 1.3254; (R1) 1.3285; More....
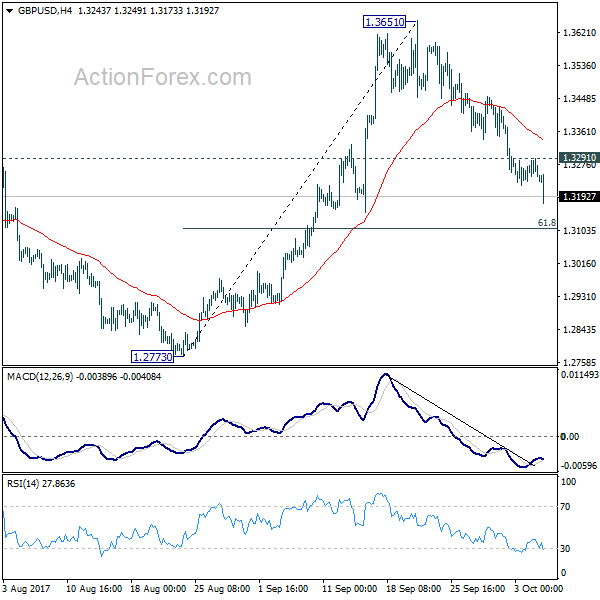
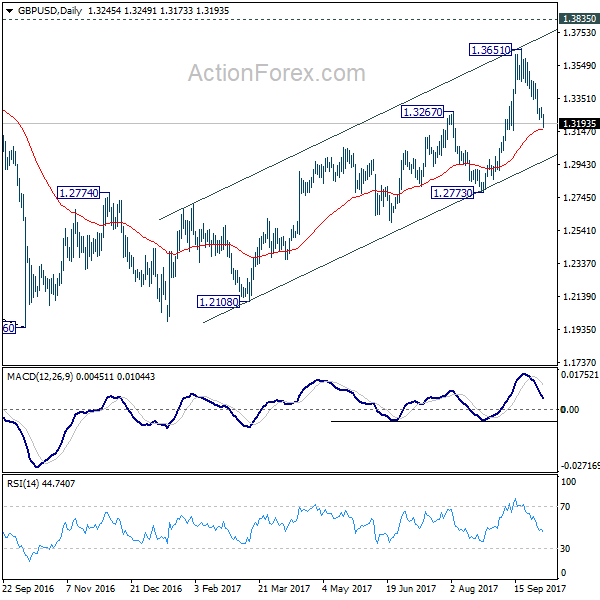
Intraday bias in GBP/USD remains on the downside for the moment. Fall from 1.3651 should extend to 61.8% retracement of 1.2773 to 1.3651 at 1.3108. Firm break there will target a test on 1.2773 key support level. On the upside, above 1.3291 minor resistance will turn bias back to the upside for 4 hour 55 EMA (now at 1.3343) first.
In the bigger picture, current development argues that the long term trend in GBP/USD has reversed. That is, a key bottom was formed back in 1.1946 on bullish convergence condition in monthly MACD. Current rise from 1.1946 will target 38.2% retracement of 2.1161 (2007 high) to 1.1946 (2016 low) at 1.5466 next. In any case, medium term outlook will now stay bullish as long as 1.2773 support holds.
ISM Non-Manufacturing PMI Rises In October
The non-manufacturing PMI released by the Institute of Supply Management (ISM) yesterday showed an increase as the index rose to 59.8 in September. It was the highest level since September and beat estimates. The ADP private payrolls data was also released yesterday which showed that private hiring added 135k jobs in September which was slightly above the estimates of 131k. Previous month's payrolls were revised down to 228k.
The US dollar was seen trading flat as investors were focused on the upcoming nomination of the Federal Reserve Chair. The US President Trump is expected to announce his nominee in a few weeks time.
Looking ahead, the economic calendar today will see the release of the ECB's meeting minutes which could be a major catalyst for the euro currency. Fed member speeches today include Jerome Powell and Harker. Powell is widely tipped to be one of the contenders for the next chair of the Federal Reserve.
ECB Meeting Minutes In Focus, Dollar Steady
Investors have marched into the final trading quarter of 2017 with a risk-on attitude, as global stocks hit fresh record highs on Wednesday.
Most Asian Indexes were supported by the renewed appetite for risk, while Wall Street stole the spotlight - both the S&P 500 Index and Dow Jones Industrial Average, sprinted to record levels. However in Europe, sentiment was bruised by the political uncertainty surrounding Catalonia, which exposed European shares to downside risks during Wednesday's trading session.
Focusing on today, Asian stocks were mostly mixed during early trade, with markets in China, South Korea and Hong Kong closed for public holidays. With market players adopting a cautious stance and strolling to the sidelines ahead of the US Jobs Report on Friday, US equity bulls may take a short break and cool off.
Dollar supported by upbeat U.S data
The Dollar clawed back some of its losses against a basket of major currencies on Wednesday, after stronger than expected US data supported expectations of a Fed rate hike before year end.
According to ADP, corporate payrolls increased by 135k in September, compared to the 228k in the previous month. While this relatively low reading would spark concerns in normal circumstances, it must be kept in mind that the impact of Hurricanes Irma and Harvey has heavily distorted the figures. With ADP exceeding the 131k market estimates, the Dollar was offered some support.
Sentiment towards the US economy received another boost on Wednesday, after the Non-Manufacturing Purchasing Manager Index came in at 59.8 in September, the highest reading since August 2005. With growth in the US service sector hitting a 12-year high last month, the outlook for the US economy continues to look encouraging for the second half of 2017.
Taking a look at the Dollar Index, the index seems to be in limbo ahead of the US Jobs Report on Friday. Prices still remain bullish on the daily charts, with 93.30 and 93.70 both acting as levels of interest. A strong NFP report that exceeds market estimates, is likely to instill bullish investors with enough inspiration to target 93.70 and 94.00, respectively. A breakout above 94.00 should open a clean path towards 94.30.
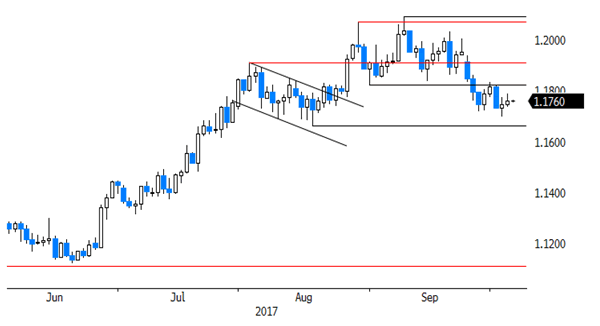
Euro wobbly ahead of ECB minutes
It has been a rocky and volatile week for the Euro, as anxiety over political uncertainty in Spain weighed heavily on the currency.
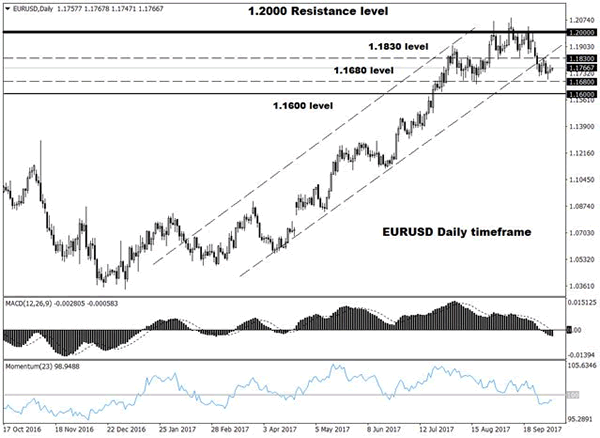
The array of sluggish Eurozone services PMI and soft retail sales data released on Wednesday have also sparked doubts over the European Central Bank's tapering plans, and consequently compounded to the Euro's woes. With the EURUSD currently trading around 1.1750 as of writing, bears still remain in control on the daily charts and are eyeing 1.1680.
Much attention will be directed towards the minutes of September's European Central Bank meeting, which could offer some fresh insight into the central banks tapering plans. The Euro still remains at risk of depreciating further, if the minutes express concerns over the strength of the Euro.
From a technical standpoint, the EURUSD remains under noticeable pressure on the daily charts. Bears remain in control under the 1.1830 lower high, with an intraday breakdown below 1.1730 opening a path towards 1.1680.
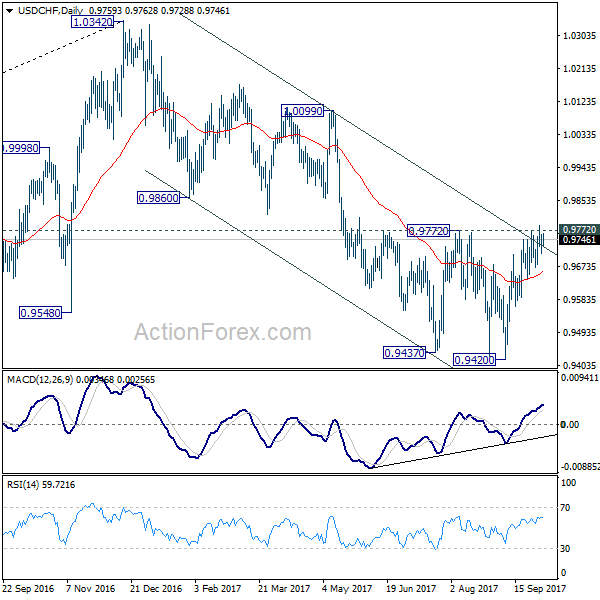
USD/CHF Daily Outlook
Daily Pivots: (S1) 0.9714; (P) 0.9749; (R1) 0.9771; More....
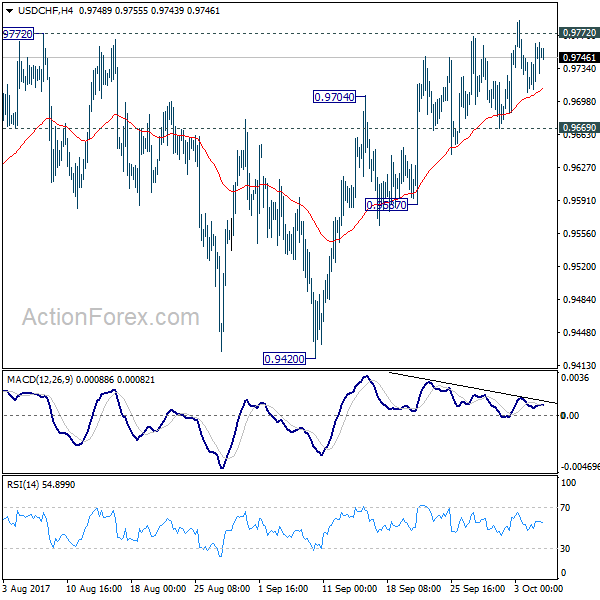
USD/CHF is staying in consolidation in tight range and intraday bias remains neutral. And outlook remains unchanged. On the upside, decisive break of 0.9772 key resistance will suggest that whole down trend form 1.0342 has completed. In that case, near term outlook will be turned bullish for 0.9860/1.0099 resistance zone. However, break of 09669 minor support will suggest rejection from 09772 and turn bias back to the downside for 0.9587 support. Break will target retesting 0.9420 low.
In the bigger picture, focus remains on whether 0.9443 key support (2016 low) could be taken out firmly as down trend from 1.0342 extends. There are various interpretation of the price actions. But in any case, medium term outlook will stay bearish as long as 0.9772 resistance holds. Current down trend could extend to 38.2% retracement of 0.7065 (2011 low) to 1.0342 (2016 high) at 0.9090. However, break of 0.9772 will indicate that USD/CHF has successfully defended 0.9443 again and turn outlook bullish for 1.0099 resistance.
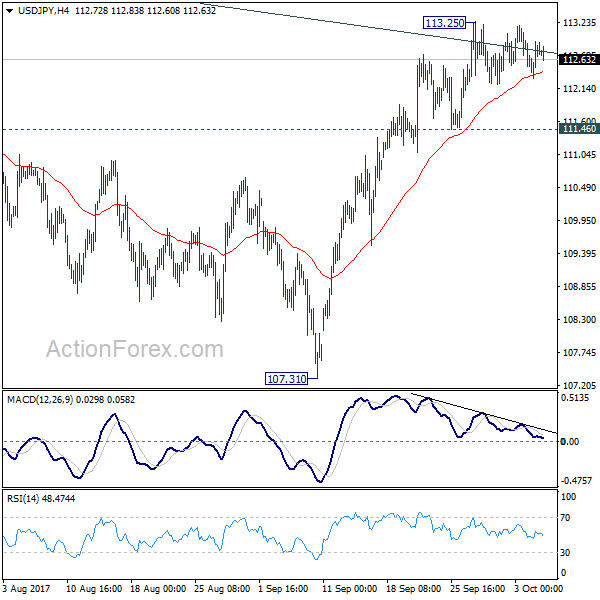
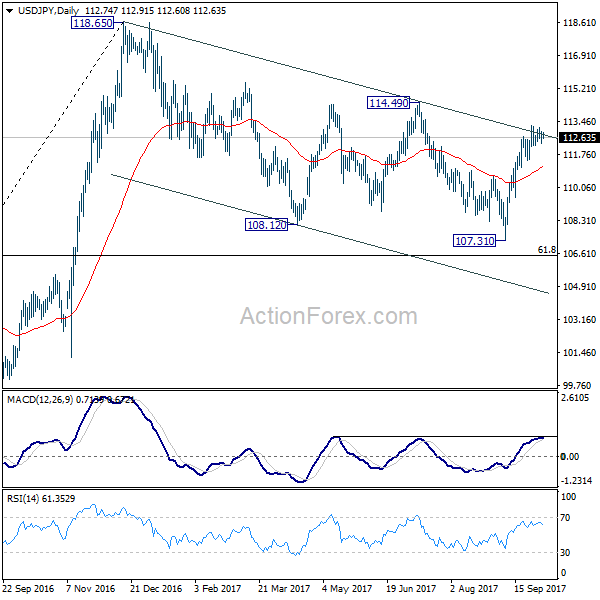
USD/JPY Daily Outlook
Daily Pivots: (S1) 112.40; (P) 112.67; (R1) 113.01; More....
Intraday bias in USD/JPY remains neutral as consolidation from 113.25 continues. On the upside, sustained break of medium term channel resistance will argue that correction from 118.65 is already completed with three waves down to 107.31. Break of 114.49 will confirm this bullish case and target a test on 118.65 next. On the downside, considering bearish divergence condition in 4 hour MACD, break of 111.46 will suggest rejection from the channel resistance and turn bias back to the downside.
In the bigger picture, rise from 98.97 (2016 low) is seen as the second leg of the corrective pattern from 125.85 (2015 high). It's unclear whether this this second leg has completed at 118.65 or not. But medium term outlook will be mildly bearish as long as 114.49 resistance holds. And, there is prospect of breaking 98.97 ahead. Meanwhile, break of 114.49 will bring retest of 125.85 high. But even in that case, we don't expect a break there on first attempt.
Currencies: Dollar Awaits Guidance Amid Diffuse News Flow
Sunrise Market Commentary
- Rates: Caught between Spain and US payrolls
The underperformance of Spanish assets can continue as the stand-off between Madrid and Barcelona persists. Today’s Spanish auction could also have consequences for other markets, especially in case of difficulties (risk-off). We expect more outperformance of the Bund vs. the US Note future ahead of US payrolls. Minutes of the ECB meeting are a wildcard. - Currencies: dollar awaits guidance amid diffuse news flow
Yesterday, there were too many divergent news topics to give USD trading a clear directional guidance. This pattern might continue today as investors look forward to tomorrow’s US payrolls. Catalonia, the ECB minutes and speculation on the succession of Yellen are wildcards. Sterling remains in the defensive and EUR/GBP nears the 0.89 resistance
The Sunrise Headlines
- The three major US equities indices (+0.1%) all hit minor new record closing highs for the third day in a row. Overnight, most Asian stock markets are positively oriented with Japan underperforming and China still closed.
- Catalan President Puigdemont said he'll soon apply the results of its illegal independence vote, but stopped short of saying when he'd trigger secession. He urged Madrid to accept an offer of mediation, which they declined (AFP)
- US secretary of state Tillerson denied longstanding rumours about his possible resignation after a report that he referred to Mr. Trump as a “moron” and had to be talked out of quitting by Vice President Mike Pence and others.
- Theresa May promised to give a “voice to the voiceless” in a speech intended to quell questions about her leadership. Instead, she lost her own voice and was confronted by a prankster as the Tories’ conference backdrop literally fell apart.
- The Trump administration objected to a UK-EU deal to divide valuable agricultural import quotas, in a sign of how the US and others plan to use Brexit to force the UK to further open its sensitive market for farm products.
- Australian retailers suffered their worst sales since early 2013 in August as debt-laden consumers tightened their purse strings, cutting back sharply on food, furniture and clothing. AUD/USD drops towards key support (0.78).
- Today’s eco calendar contains few eco data (US weekly jobless claims), but it is filled with central bank speeches and the publication of the ECB September Minutes. Spain and France tap the bond market
Currencies: Dollar Awaits Guidance Amid Diffuse News Flow
Dollar awaiting clear guidance
Yesterday, USD traders faced several conflicting issues including strong EMU eco data, uncertainty on Catalonia and the US debate on who will succeed Yellen at the helm of the Fed. EUR/USD and USD/JPY hovered up and down. The US non-manufacturing ISM was very strong and helped the dollar to regain some ground. However, at the end of the day, EUR/USD (1.1759 from 1.1744) and USD/JPY (112.76 from 112.85) closed the session little changed.
Overnight, several Asian markets are still closed for regional holidays. Other markets show a mixed picture. Japanese indices are little changed and so is USD/JPY (112.75 area). Australia August retails sales were very weak. AUD/USD declined 0.7865 to the 0.7830 area. EUR/USD holds a very tight sideways range in the 1.1760 area. The speech of Catalan President Puigdemont yesterday evening brought little insight in the next steps in the independence process.
Today, the US eco calendar only contains second tier releases. Initial claims are expected to have fallen somewhat, but is still well above the pre-storm levels. The August trade deficit is expected slightly lower. If confirmed, trade would positively add to Q3 GDP. The factory orders are expected to have rebounded, as already suggested by the durable orders. The event calendar is long. Fed governors Powell, Williams, Georges and Harker speak, but on non-policy issues. Since Powell is on the shortlist to become Fed chairman, any policy comment of him may affect markets. ECB Praet and Coueré chair panels at an ECB conference. Chances are slim they will unveil market sensitive info. The ECB Minutes will be closely read, looking for hints in what direction the debate on the APP is going.
Yesterday, the dollar didn’t find a clear direction as the news flow contained too many conflicting signals. We don’t see a single dominant theme to guide FX trading today. In addition, investors aren’t keen to add directional positions ahead of tomorrow’s US payrolls. So, more sideways trading is likely, mirroring yesterday’s session. Concrete hints in the ECB Minutes on policy normalisation might be supportive for the euro, but no key technical levels should be taken out. Catalonia and speculation on the succession of Yellen remain wildcards
From a technical point of view EUR/USD hovered in a consolidation pattern between 1.1823 and 1.2070, but broke below last week. There is some hesitation in the USD rebound, but the pair holds below the 1.1823 previous range bottom. Higher US yields are probably needed to support additional USD gains. Next support in EUR/USD comes in at 1.1662, while 1.1423 marks the 38% retracement from the 2017 rally. The USD/JPY momentum was constructive of late, but for an important part due to yen weakness. USD sentiment recently also improved though. USD/JPY regained 110.67/95 (previous resistance), a short-term positive. The 114.49 correction top is the next important resistance. The rally lost momentum this week. So a break beyond 144.49 probably is not evident.
EUR/USD: dollar rebound stalled, as it needs additional good news
EUR/GBP
GBP holding near the recent lows .
Sterling traded on the defensive earlier this week as the Manufacturing and construction PMI were softer than expected. Yesterday, the news flow was more sterling supportive. The services PMI rebounded from 53.2 to 53.6. The report fits in a scenario of a limited BOE tightening in the near future. Sterling rebounded, but the move was limited given the recent correction. PM May said she is seeking a Brexit deal that works, but the government is also preparing for a no-deal scenario. The impact on markets was limited. However, sterling reversed most of the intraday rebound later in the session. EUR/GBP closed the day at 0.8876 (from 0.8871). Cable finished at 1.3248 (from 1.3237).
Today, BoE’s McCafferty and Chief economist Haldane speak in London. McCafferty voted already for a rate hike in September. Haldane likely supports the majority MPC view that rates might be raised in the near future. So, if they address monetary policy issues, they might sound rather hawkish, but that shouldn’t come as a surprise. Sterling was in the defensive of late. However EUR/GBP nears the 0.8900/07 resistance area. Maybe there is more important news needed for EUR/GBP to clear this hurdle. Even so, the test has started.
EUR/GBP made an impressive uptrend since April to set a top at 0.9307 late August. UK price data amended the dynamics and hawkish BoE comments reinforced a sterling rebound. Medium term, we maintain a EUR/GBP buy-on-dips approach as we expect the mix of euro strength and sterling softness to persist. The prospect of (limited) withdrawal of BOE stimulus triggered a good sterling countermove. However, this rebound has apparently run its course. EUR/GBP supports at 0.8743 and 0.8652 are probably difficult to break. We look to buy EUR/GBP on dips. A sustained rebound above the 0.89 area would improve the ST technical picture of EUR/GBP.
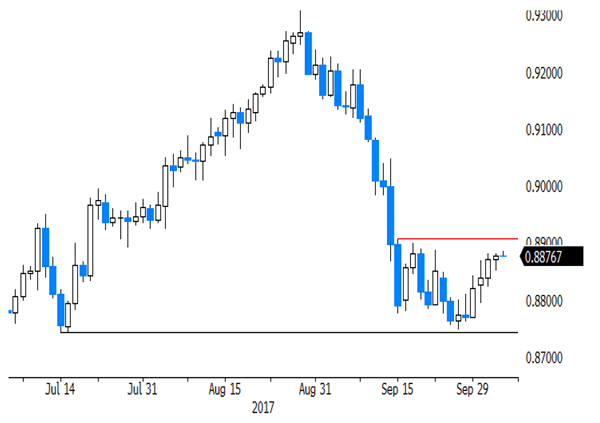
EUR/GBP: nears 0.89 resistance area
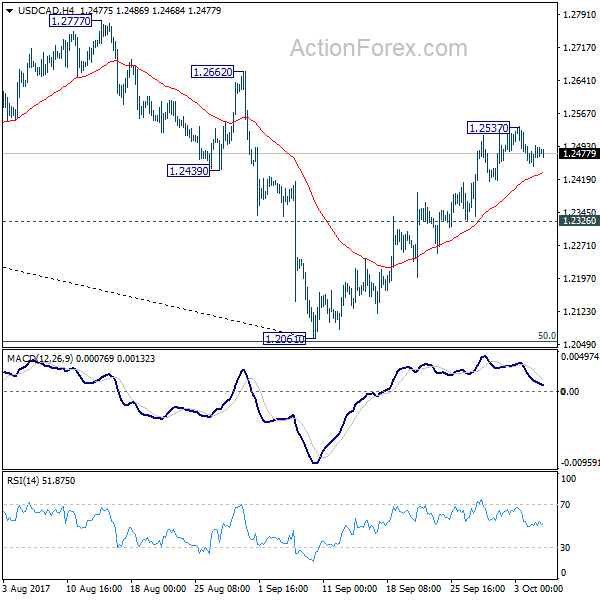
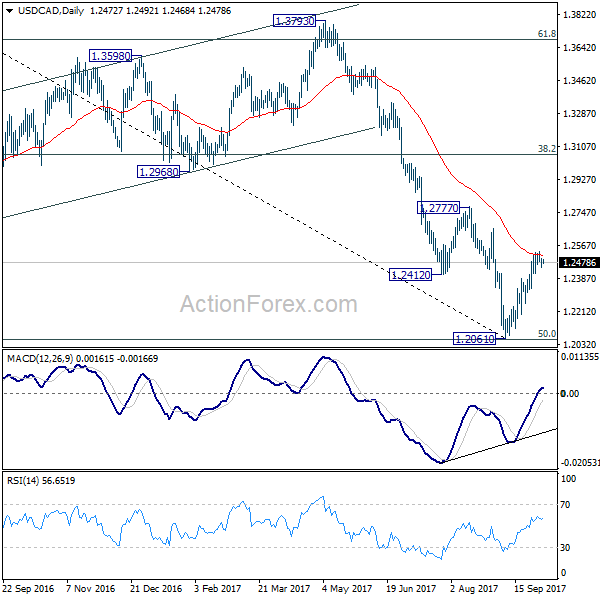
USD/CAD Daily Outlook
Daily Pivots: (S1) 1.2449; (P) 1.2474; (R1) 1.2499; More....
Intraday bias in USD/CAD remains neutral at this point. With 1.2326 minor support intact, further rise is expected. Above 1.2537 will target 1.2777 resistance first. Decisive break of 1.2777 will target 38.2% retracement of 1.4689 to 1.2061 at 1.3065 next. However, break of 1.2326 will dampen our bullish view and turn bias back to the downside for 1.2061 instead.
In the bigger picture, current development argues that USD/CAD has defended 50% retracement of 0.9406 (2011 low) to 1.4869 (2016 high) at 1.2048. And with 1.2048 intact, we'd favor the case that fall from 1.4689 is a correction. Break of 1.2777 will further affirm this bullish case. That is, larger up trend from 0.9406 is not completed. However, on the other hand, firm break of 1.2048 will indicate that fall from 1.4689 is at least a medium term down trend and should target 61.8% retracement at 1.1424 and below.
Daily Technical Outlook And Review: EUR/USD, GBP/USD, AUD/USD, USD/JPY, USD/CAD, USD/CHF, DOW 30, GOLD
A note on lower timeframe confirming price action...
Waiting for lower timeframe confirmation is our main tool to confirm strength within higher timeframe zones, and has really been the key to our trading success. It takes a little time to understand the subtle nuances, however, as each trade is never the same, but once you master the rhythm so to speak, you will be saved from countless unnecessary losing trades. The following is a list of what we look for:
- A break/retest of supply or demand dependent on which way you're trading.
- A trendline break/retest.
- Buying/selling tails ... essentially we look for a cluster of very obvious spikes off of lower timeframe support and resistance levels within the higher timeframe zone.
- Candlestick patterns. We tend to only stick with pin bars and engulfing bars as these have proven to be the most effective.
We typically search for lower-timeframe confirmation between the M15 and H1 timeframes, since most of our higher-timeframe areas begin with the H4. Stops are usually placed 1-3 pips beyond confirming structures.
EUR/USD
During the course of Wednesday's segment, the pair largely ignored data and was confined to a tight range of 50 pips above the H4 mid-level support at 1.1750.
The single currency is, at least in our technical view, expected to remain bid from 1.1750 today and eventually advance up to the 1.18 handle, followed closely by August's opening level at 1.1830. This is primarily due to weekly price trading within the confines of a demand base coming in at 1.1662-1.1814, along with daily flow showing price hovering above demand at 1.1612-1.1684. What's more, we can also see that there's room for the unit to gravitate north up to daily resistance pegged at 1.1878, which happens to merge nicely with a daily trendline resistance extended from the low 1.0839.
Suggestions: Drill down to the lower timeframes and look for an entry north from 1.1750. When using lower-timeframe action as a means of entry, we typically look for the following to take shape as a way of approving a higher-timeframe area (this will help get you in using a smaller stop loss and ultimately increase risk/reward up to 1.18 [the first take-profit level]):
A break of supply followed up with a retest as demand.
A trendline break/retest.
A collection of well-defined buying tails off of lower-timeframe support.
As highlighted above, we usually search for lower-timeframe confirmation between the M15 and H1 timeframes, since most of our higher-timeframe areas begin with the H4. Stops are typically placed 1-3 pips beyond confirming structures.
Data points to consider: ECB Monetary policy meeting accounts at 12.30pm; US weekly unemployment claims along with trade balance at 1.30pm; FOMC members Powell and Harker take to the stage at 2.10-3pm; US Factory orders m/m at 3pm GMT+1.
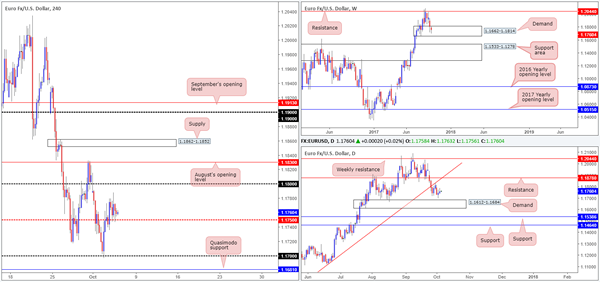
Levels to watch/live orders:
- Buys: 1.1750 region ([waiting for lower-timeframe confirming action to take shape from here is advised before pulling the trigger] stop loss: dependent on where one confirms the area).
- Sells: Flat (stop loss: N/A).
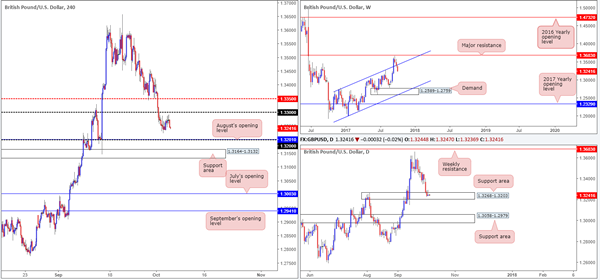
GBP/USD
GBP/USD prices are little changed this morning, despite a better-than-expected UK services PMI. As you can see, the H4 candles remain loitering between the 1.33 handle and August's opening level at 1.3201/1.32 handle. A quick look over at the bigger picture shows weekly price recently re-entered the ascending channel formation (1.1986/1.2673). We know there's a lot of ground to cover here but this move could have potentially opened up downside to as low as the demand area positioned at 1.2589-1.2759. On the flip side, daily activity is currently seen trading within the walls of a support area coming in at 1.3268-1.3203, which forced price to chalk up an inverted pin bar yesterday (a bullish candlestick signal). A violation of this area, however, will possibly clear the river south down to as far as the support area positioned at 1.3058-1.2979.
Suggestions: In a similar fashion to Wednesday's analysis, neither a long nor short seems attractive at the moment. No matter which direction one chooses in this market, you'll have to contend with potential higher-timeframe opposition! For that reason, we'll remain on the sidelines for now and wait for further developments.
Data points to consider: MPC members McCafferty and Haldane take the stage at 5/6.30pm; US weekly unemployment claims along with trade balance at 1.30pm; FOMC members Powell and Harker take to the stage at 2.10-3pm; US Factory orders m/m at 3pm GMT+1.
Levels to watch/live orders:
- Buys: Flat (stop loss: N/A).
- Sells: Flat (stop loss: N/A).
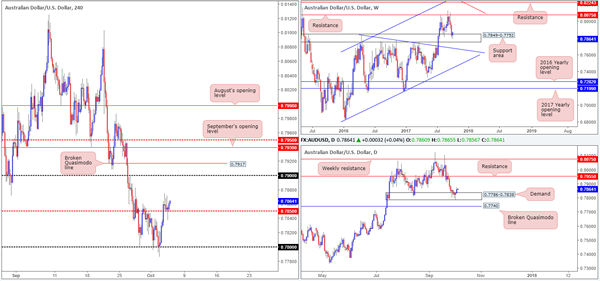
AUD/USD
The commodity currency closed marginally higher on Wednesday, breaching the H4 mid-level resistance at 0.7850 and shortly after retesting it as support. This should not really come as too much of a surprise to tech traders who keep an eye on the bigger picture.
Weekly action is seen finding refuge at a major support area drawn from 0.7849-0.7752. This zone has a strong history and held well as support during the month of August, thus there's a good chance that we may see history repeat itself here. In conjunction with the current weekly zone, a strong daily demand base logged at 0.7786-0.7838 is seen painted within its boundaries. Should the currency remain bid from this demand, the next port of call on the daily scale will likely be the resistance level located at 0.7955.
Technically speaking, we see absolutely no reason why the Aussie will not continue to press north. From a fundamental standpoint, nevertheless, Australian retail and trade balance figures are scheduled to be released in an hour (as of writing), and therefore could alter the technical structure somewhat.
Suggestions: In light of looming Au. News, we'd strongly advise tech traders to stand down for now, and reassess post-news. Getting caught on the wrong side of a high-impacting event will not do your account any favors!
Data points to consider: Australian Retail sales m/m and Trade balance figures at 1.30am; US weekly unemployment claims along with trade balance at 1.30pm; FOMC members Powell and Harker take to the stage at 2.10-3pm; US Factory orders m/m at 3pm GMT+1.
Levels to watch/live orders:
- Buys: Flat (stop loss: N/A).
- Sells: Flat (stop loss: N/A).
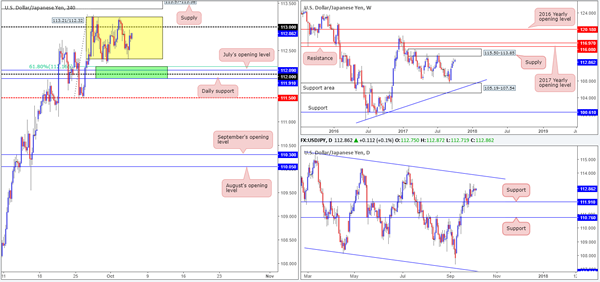
USD/JPY
Since the 27th September, the USD/JPY has been entrenched within a H4 range at 113.21/112.32 (see yellow box). In spite of this, we maintain an optimistic outlook for the pair overall. Our reasoning lies within the higher-timeframe structures. Weekly price shows room to push up to nearby supply coming in at 115.50-113.85, as well as daily price up to a trendline resistance extended from the high 115.50, which happens to merge nicely with the noted weekly supply.
In light of the above, we still have an eyeball on the 112 handle for potential longs due to the following confluence:
Positioned directly above daily support at 111.91.
Located just below July's opening level at 112.09.
Nearby a 61.8% H4 Fib support at 112.16 taken from the low 111.47.
Suggestions: With space seen for both weekly and daily action to push higher, coupled with the 112 handle's surrounding confluence mentioned above, a long from the green H4 buy zone is still worthy of attention. As psychological levels are prone to fakeouts, however, you may want to wait for H4 price to confirm buyer intent before pulling the trigger. For us, this would simply be a full or near-full-bodied bullish candle formed within the green zone, which would, in our view, provide enough evidence to hold the position up to at least 113/H4 supply at 113.57-113.38.
Data points to consider: US weekly unemployment claims along with trade balance at 1.30pm; FOMC members Powell and Harker take to the stage at 2.10-3pm; US Factory orders m/m at 3pm GMT+1.
Levels to watch/live orders:
- Buys: 111.91/112.16 ([waiting for a reasonably sized H4 bullish candle to form – preferably a full, or near-full-bodied candle – is advised] stop loss: ideally beyond the candle's tail).
- Sells: Flat (stop loss: N/A).
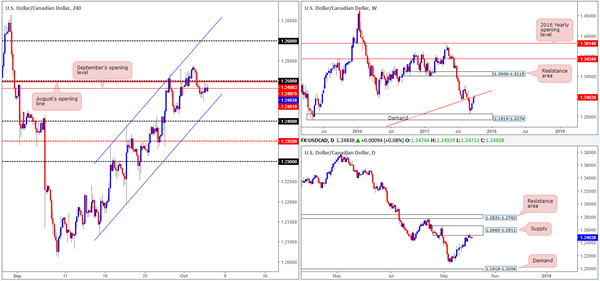
USD/CAD
For those who read Wednesday's report you may recall our desk mentioning that if a full or near-full-bodied H4 bearish candle closed below September's open level at 1.2481, this would be considered a strong sell signal to short down to at least 1.24. We entered at 1.2468 shortly after we wrote this report, and placed a stop-loss order a few pips above the 1.25 handle at 1.2503. As you can see, the trade is still active but looks vulnerable to the upside at the moment.
Despite our sell trade struggling, our overall bias remains focused to the downside. A strong underlying downtrend, coupled with weekly price kissing the underside of a trendline resistance taken from the low 0.9633 and the daily candles loitering at the underside of supply carved from 1.2663-1.2511, echoes overbought conditions, in our view.
Suggestions: In the event that our short trade turns lower, we will have to contend with the nearby H4 channel support etched from the low 1.2118. Ultimately, we want to see this line engulfed and price head on to the 1.24 handle where we'll look to begin taking profits.
Data points to consider: US weekly unemployment claims along with trade balance at 1.30pm; FOMC members Powell and Harker take to the stage at 2.10-3pm; US Factory orders m/m at 3pm; Canadian Trade balance at 1.30pm GMT+1.
Levels to watch/live orders:
- Buys: Flat (stop loss: N/A).
- Sells: 1.2468 ([live] stop loss: 1.2503).
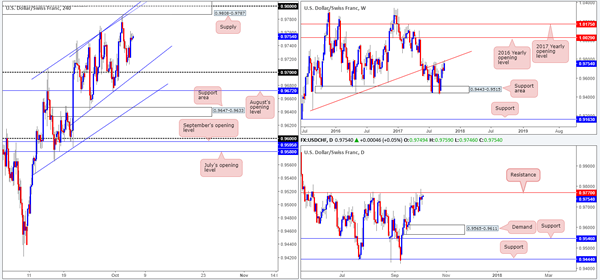
USD/CHF:
Influenced by Wednesday's better-than-expected US ISM non-manufacturing print, the USD/CHF managed to print a nice-looking daily buying tail and erase Tuesday's losses. While the bulls look to reassert their dominance, we maintain a fairly pessimistic outlook for the Swissie pair at the moment, due to the following reasons:
High on the curve, the weekly candles are seen bumping heads with the underside of a trendline resistance extended from the low 0.9257.
A closer look at price action on the daily timeframe shows the unit trading within striking distance of resistance coming in at 0.9770.
Over on the H4 timeframe, supply at 0.9808-0.9787 is seen lurking nearby, along with the 0.98 handle and two converging channel resistances etched from highs of 0.9705/0.9746.
Suggestions: Owing to the collective resistances seen on the weekly, daily and H4 timeframes, a short from the H4 supply could be an option today (pending sell order at 0.9790 – stop loss at 0.9810).
Data points to consider: US weekly unemployment claims along with trade balance at 1.30pm; FOMC members Powell and Harker take to the stage at 2.10-3pm; US Factory orders m/m at 3pm GMT+1.
Levels to watch/live orders:
- Buys: Flat (stop loss: N/A).
- Sells: 0.9790 ([pending order] stop loss: 0.9810).
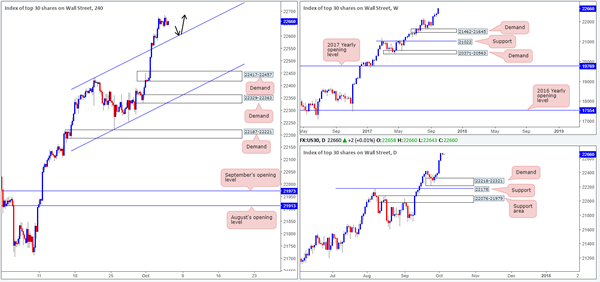
DOW 30:
Wall Street, as you can see, took a breather on Wednesday, following two record-hitting days. The H4 candles were confined to a tight range of 50 points, hovering just above a recently broken H4 channel resistance extended from the high 22431 (now acting support). In a similar fashion to yesterday's report, we see little reason why the index will not continue to punch higher given the strength of the underlying trend – just look at the weekly chart!
Suggestions: With H4 price now trading proud above the channel support, this is, in our view, an ideal line to buy from should the unit dip lower (see black arrows). Nevertheless, we would strongly recommend waiting for a reasonably sized H4 bull candle (a full or near-full-bodied candle) to form following the retest, before pulling the trigger. This is simply to help avoid any fakeout that may take place.
Data points to consider: US weekly unemployment claims along with trade balance at 1.30pm; FOMC members Powell and Harker take to the stage at 2.10-3pm; US Factory orders m/m at 3pm GMT+1
Levels to watch/live orders:
- Buys: Watch for H4 price to retest channel support ([waiting for a reasonably sized H4 bullish candle to form – preferably a full, or near-full-bodied candle – following the retest is advised] stop loss: ideally beyond the candle's tail).
- Sells: Flat (stop loss: N/A).
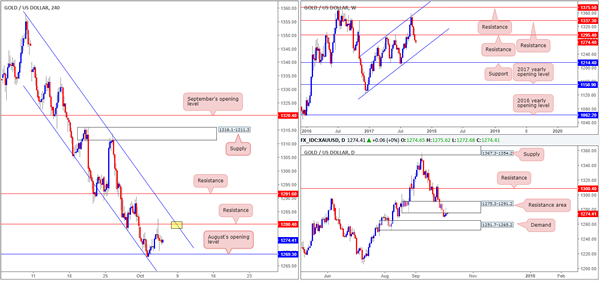
GOLD
In recent trading, we can see that gold aggressively challenged the H4 resistance at 1280.4 going into the early hours of the US segment. In our previous report, we highlighted this level, along with the H4 channel resistance extended from the high 1357.5 (yellow marker), as being a potential sell zone. Given 1280.4 effectively proved itself as a worthy resistance yesterday, the yellow area now carries more weight, in our humble view. Alongside this, we also have the following in favor:
Weekly price showing little support in view until we reach channel support extended from the low 1122.8.
Daily action continuing to chomp at the underside of a resistance area pegged at 1275.3-1291.2.
Steep downtrend.
Suggestions: On account of the above, we would be surprised to see H4 price trade beyond the noted channel resistance. With that being the case, the yellow marker on the H4 timeframe remains the place to be for shorts!
Levels to watch/live orders:
- Buys: Flat (stop loss: N/A).
- Sells: 1280.4 region ([waiting for a reasonably sized H4 bearish candle to form – preferably a full, or near-full-bodied candle – following the retest is advised] stop loss: ideally beyond the candle's wick).
European Open Briefing: Asia-Pacific Markets Opened A Tad Firmer On Thursday
Global Markets:
- Asian stock markets: Nikkei up 0.01 %, Shanghai Composite rose 0.28 %, Hang Seng gained 0.73 %, ASX 200 up 0.10 %
- Commodities: Gold at $1277.67 (+0.07 %), Silver at $16.62 (+0.02 %), WTI Oil at $49.92 (-0.12 %), Brent Oil at $55.81 (+0.02 %)
- Rates: US 10-year yield at 2.32, UK 10-year yield at 1.37, German 10-year yield at 0.45
News & Data:
- (AUD) Retail Sales m/m -0.6 % vs 0.3 % expected
- (AUD) Trade Balance 0.99 B vs 0.88 B expected
- (GBP) Services PMI 53.6 vs 53.2 expected
- (USD) ADP Non-Farm Employment Change 135 K vs 131 K expected
- (USD) Final Services PMI 55.3 vs 55.1 expected
- (USD) ISM Non-Manufacturing PMI 59.8 vs 55.5 expected
- (USD) Crude Oil Inventories -6.0 M vs -0.5 M expected
- Hurricanes hit U.S. hiring in September, services sector resilient- RTRS
Markets Update:
Asia-Pacific markets opened a tad firmer on Thursday, following cues from strong U.S. data. Bonds, equities and the dollar were all steady after U.S. data did little to change views on the timing or pace for monetary tightening. Japanese equities struggled for direction early Thursday despite a weaker yen, even as other markets in the region were broadly higher
USDJPY is seen trading flat at 112.75. Price popped early (around the Tokyo fix) to test its overnight high around 112.90 but has since slipped back and consolidating for the remainder of the session. Meanwhile, Japan’s Nikkei Stock Average Nikkei 225 was nearly unchanged in morning trade with the market facing more resistance as the benchmark index nears its 2015 peak, which was the highest since 1996.
EURUSD was seen consolidating within a 10 pip range around 1.1755 for most of the Asian session today after the Euro rose 0.1 percent against the US Dollar on Wednesday. The dollar index, which tracks the dollar against a basket of currencies added 0.1 percent and is currently valued at 93.50
AUDUSD lost over 40 pips from session highs of 0.7865 and is currently seen trading around 0.7830 after the AUD saw its worst m/m sales results ( -0.6 % vs 0.3 % expected) in 4+ years in addition to slow wage growth, high debt and rising utility bills being the other negative factors. The Newzealand Dolalr slipped a little earlier in the session reaching lows of around 0.7145 before recovering partially to current levels of around 0.7160.
Upcoming Events:
- All Day – (CNY) Chinese Bank Holiday
- 11:30 GMT – (EUR) ECB Monetary Policy Meeting Accounts
- 12:30 GMT – (CAD) Trade Balance
- 12:30 GMT – (USD) Unemployment Claims
- 12:30 GMT – (USD) Trade Balance
- 13:10 GMT – (USD) FOMC Member Powell Speaks
- 14:00 GMT – (USD) FOMC Member Harker Speaks
- 14:00 GMT – (USD) Factory Orders m/m
- 16:00 GMT – (GBP) MPC Member McCafferty Speaks
- 17:30 GMT – (GBP) MPC Member Haldane Speaks
Market Update – Asian Session: Australia Bond Yields Lower As Retail Sales Unexpectedly Decline
Asia Summary
Equities markets in China and South Korea have continued their holidays. Hong Kong markets are also closed today in observance of a national holiday. In New Zealand, the NZX-50 index has traded at a fresh record high.
Large Japanese retailer Aeon has opened higher on its better than expected H1 operating profit.
In Australia, retail sales unexpectedly declined in August, and this has put downward pressure on the Aussie and bond yields, despite better than expected monthly trade surplus figures. With the downward revision in retail sales, the data has now declined for 2 straight months.
Meanwhile, former RBA official Edwards said the central bank could hike rates even if inflation remains below its 2-3% target, as he said very low rates during times when growth is firm invites trouble. The RBA last raised rates in Nov of 2010.
Key economic data
(AU) AUSTRALIA AUG RETAIL SALES M/M: -0.6% V +0.3%E
(AU) AUSTRALIA AUG TRADE BALANCE (A$) 989M V 850ME
(JP) Foreigners Buy net of ¥953.3B in Japan stocks (highest weekly purchase since 2015) v ¥923.9B in net sales prior week
(PH) Philippines Sept CPI M/M: 0.5% v 0.2%e; Y/Y: 3.4% v 3.1%e (highest since April); Core Y/Y: 3.3% v 3.1%e (highest since Sept 2014)
(NZ) New Zealand FY17 Budget Surplus NZ$4.07B v NZ$1.83B y/y (NZ$363M above forecast); Core Crown Tax Revenue NZ$75.6B, +NZ$5.2B y/y
Speakers and Press
(AU) Former RBA Official John Edwards: RBA could raise rates even if inflation remains below 2-3% target; very low rates during times when growth is firm invites trouble.
(JP) Japan PM Abe said to pledge to 'speed up' Abenomics - Japanese Press
Asian Equity Indices/Futures (00:30ET)
Nikkei +0.1%, Hang Seng closed, Shanghai Composite closed, ASX200 +0.2%, Kospi closed
Equity Futures: S&P500 flat ; Nasdaq flat , Dax +0.1% , FTSE100 +0.1%
FX ranges/Commodities/Fixed Income (00:30ET)
EUR 1.1751-1.1763; JPY 112.70-112.91; AUD 0.7824-0.7865; NZD 0.7147-0.7168
Aug Gold flat at 1,277/oz; Aug Crude Oil flat at $49.98/brl; Sept Copper +0.3% at $2.964/lb
GLD SPDR Gold Trust ETF daily holdings flat at 854.3 metric tons
Equities notable movers
Australia
Topbetta Holdings, TBH.AU Q1 Rev up over 170% y/y; +4.1%
Japan
Aeon, 8267.JP H1 Operating profit above expectations; +1.7%
US markets on close: Dow +0.1%, S&P500 +0.1%, Nasdaq flat, Russell -0.3%
Best Sector in S&P500: Utilities +1%
Worst Sector in S&P500: Financials -0.5%
At the close: VIX 9.63 (+0.10 pts); Treasuries: 2-yr 1.475% (flat), 10-yr 2.330% (flat), 30-yr 2.874% (+1bp)
US Market Summary
US stocks ended mostly higher after the strongest ISM services reading in more than a decade, though the Russell 2000 broke an 8-day streak of gains. US Sec of State Tillerson, responding to an NBC News report that he had called Pres Trump a 'moron' and sought to resign his post, held a press conference to pledge his continued commitment to the Trump administration. The Spanish IBEX finished down 3% as Catalonia headlines continue to weigh on risk sentiment. US Treasury prices declined following the strong US data, pushing up yields. Healthcare names outperformed, with Mylan a leader for the day, while IT, energy and financial names were the laggards.
US Afterhours Movers
ACAD Initiates Phase III Study of Pimavanserin in Dementia-Related Psychosis; +5.3% afterhours
ZUMZ Reports Sept SSS +9.3% y/y; Raises Q3 $0.45-0.48 v $0.47e, Rev $241-243M v $237Me (prior $0.43-0.48, Rev $236-241M), SSS +6-7% y/y; +4.5% afterhours
SEAS Reportedly has hired advisors to consider a sale; +3.5% afterhours
GNW North Carolina regulator approves proposed Oceanwide acquisition of Genworth's NC-domiciled insurance companies; +2.9% afterhours
CAFD Reports Q3 $0.27 v $0.65e, Rev $27.7M v $25.8Me; Guides Q4 Rev $12-15M v $14.8Me, adj EBITDA $22-25M; -1.5% afterhours
IMGN Files to offer 13M shares via Jefferies, Leerink and RBC (12% of shares outstanding); -8.1% afterhours