Sample Category Title
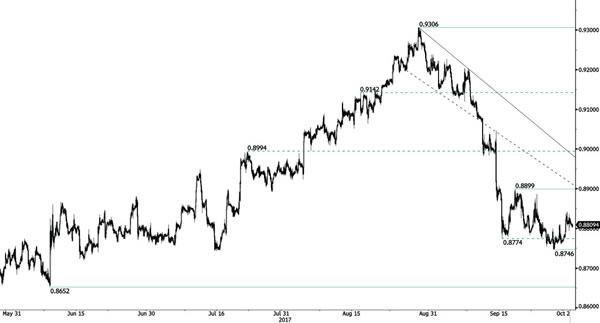
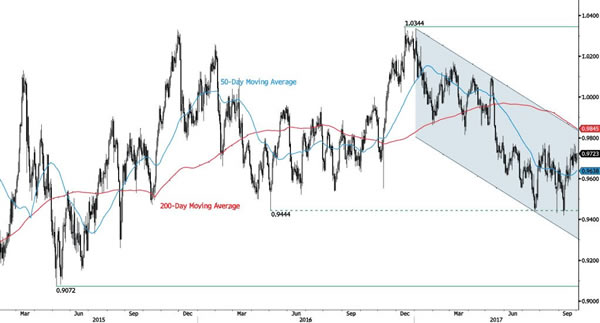
EUR/GBP Bullish Consolidation
EUR/GBP is trading sideways. Yet, the pair is facing selling pressures. As long as prices remain below the resistance at 0.8899 (19/09/2017 low), the short-term technical structure is biased to the downside. Hourly support is given at 0.8746 (27/09/2017). Resistance lies at 0.8899 (19/09/2017 high).
In the long-term, the pair has largely recovered from recent lows in 2015. The technical structure suggests a growing upside momentum. The pair is trading above from its 200 DMA. Strong resistance can be found at 0.9500 (psychological level).
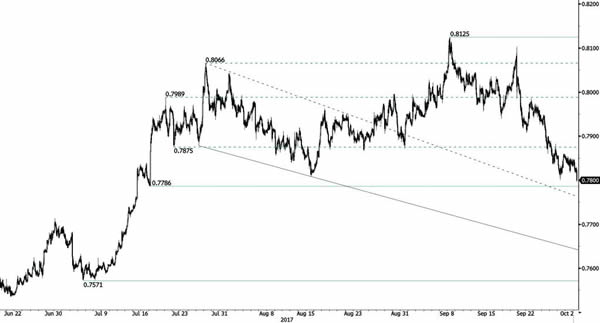
AUD/USD Monitoring Strong Support At 0.7786.
AUD/USD has weakened over the past weeks. Hourly resistance is given at 0.7883 (27/05/2017 high). The pair is approaching support at 0.7786 (18/07/2017 low). Expected to show continued consolidation.
In the long-term, the trend is turning positive. Key supports stands at 0.6009 (31/10/2008 low) . A break of the key resistance at 0.8164 (14/05/2015 high) is needed to invalidate our long-term bearish view.
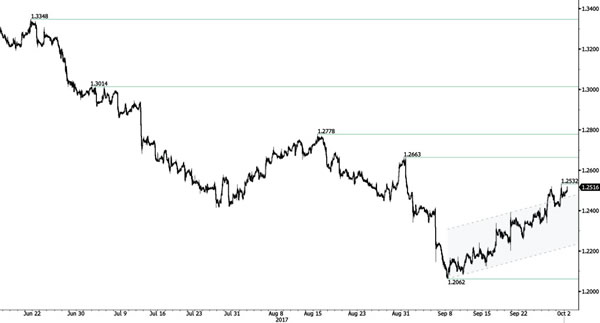
USD/CAD Short-Term Bullish Pressures Continue
USD/CAD continues to move higher despite ongoing consolidation. Strong support is located at a distance 1.2062 (08/09/2017 low). Hourly support lies at 1.2331 (26/09/2017 high). Resistance is given at 1.2532 (29/09/2017 high). Expected to show continued short-term bullish pressures.
In the longer term, the pair has broken longterm support that can be found at 1.2461 (16/03/2015 low). Strong resistance is given at 1.4690 (22/01/2016 high). The pair is likely to head further lower.
USD/CHF Ready For Another Leg Higher
USD/CHF is trading mixed at the moment. Yet, demand is slightly increasing since September. Closest resistance is given at 0.9808 (30/05/2017 high). There are nonetheless decent downside risks. Strong support is given at 0.9421 (03/05/2017). Expected to show renewed bearish pressures.
In the long-term, the pair is still trading in range since 2011 despite some turmoil when the SNB unpegged the CHF. Key support can be found 0.8986 (30/01/2015 low). The technical structure favours nonetheless a long term bullish bias since the unpeg in January 2015.
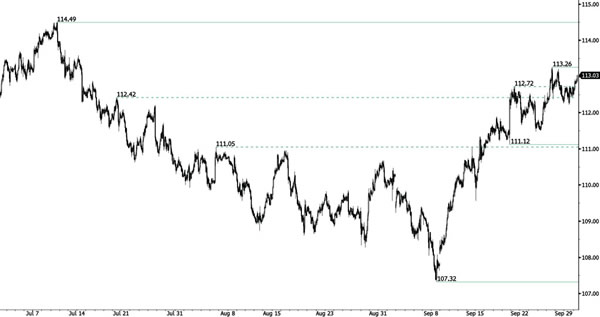
USD/JPY Continued Bullish Momentum
USD/JPY is still lying into a bullish momentum despite ongoing consolidation. Strong support is located at 111.12 (20/09/2017 low). The pair is way into a bullish trendh. Yet, downside risks are rising as markets may soon take some short-term profit.
We favor a long-term bearish bias. Support is now given at 99.02 (10/08/2013 low). A gradual rise towards the major resistance at 125.86 (05/06/2015 high) seems unlikely. Expected to decline further support at 93.79 (13/06/2013 low).
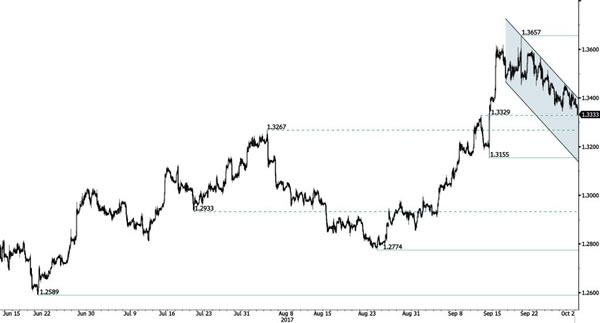
GBP/USD Riding Downtrend Channel
GBP/USD is pushing lower after topping at 1.3657 (20/09/2017 high). Hourly support is given at 1.3155 (14/09/2017 low). Expected to show continued bearish pressures within downtrend channel.
The long-term technical pattern is reversing. The Brexit vote had paved the way for further decline. Long-term support can be found at 1.1841 (07/10/2017 low). Long-term resistance given around 1.35 is at stake and indicates a long-term reversal in the negative trend. Yet, it is very unlikely at the moment.
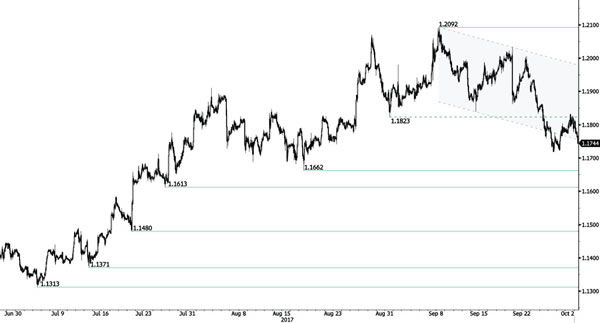
EUR/USD Continued Weakness
EUR/USD is way into a bearish trend. Hourly resistance can be found at 1.2092 (08/09/2017 high) while hourly support lies at 1.1823 (31/08/2017 low) has been broken. Stronger support is given at a distance at 1.1662 (17/08/2017 low). Expected to show continued short-term bearish pressures.
In the longer term, the momentum is now turning largely positive. We favour a continued bullish bias. Key resistance is holding at 1.2252 (25/12/2014 high) while strong support lies at 1.0341 (03/01/2017 low).
Daily Technical Analysis: EURUSD, GBPUSD, USDJPY, USDCHF
EURUSD
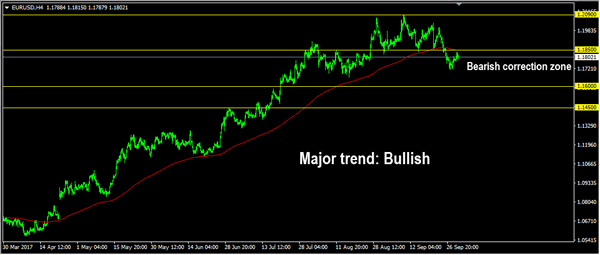
The EURUSD continued its bearish correction momentum last week bottomed at 1.1717 but closed higher at 1.1816. The bias is neutral in nearest term. My major technical outlook remains bullish but price is still in a bearish correction phase. Immediate support is seen around 1.1770. A clear break below that area could trigger further bearish pressure testing 1.1700 area. Immediate resistance is seen around 1.1823/50. A clear break above that area could trigger further bullish pressure testing 1.1935 which need to be clearly broken to the upside to potentially end the current bearish correction phase. On the downside, a clear break and daily close below 1.1700 would expose 1.1600 region.
GBPUSD
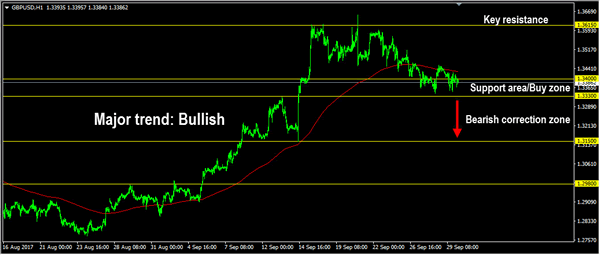
The GBPUSD continued to trade lower last week, hit a fresh two-week low at 1.3342. The bias is neutral in nearest term. Overall I remain bullish and 1.3400 – 1.3330 support area remains a good place to buy with a tight stop loss below 1.3330 as a clear break below that area would take price to a bearish correction zone testing 1.3150 region. Immediate resistance is seen around 1.3455. A clear break and daily close above that area could trigger further bullish pressure testing 1.3515 – 1.3570 region but key resistance remains at 1.3615.
USDJPY
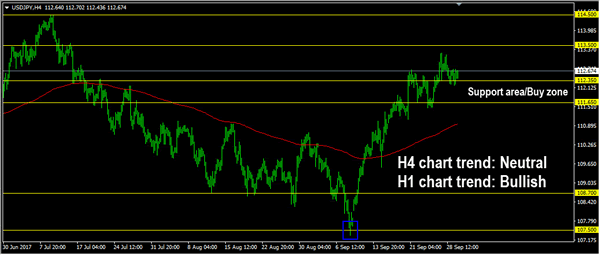
The USDJPY was indecisive last week but overall still able to maintain its bullish H1 chart bias which started after a false break below 107.50 four weeks ago and hit a fresh four-week high at 113.25. The bias is neutral in nearest term probably with a little bullish bias testing 113.50 area. On the downside, 112.35 – 111.65 area remains a key support and good place to buy with a tight stop loss below 111.65. Overall I remain neutral.
USDCHF
The USDCHF was indecisive last week. Price attempted to push higher, topped at 0.9769 but closed lower at 0.9677 after a rejection to break above the daily EMA 200 as you can see on my daily chart below. The bias is neutral in nearest term probably with a little bearish bias testing 0.9650 area. On the upside, 0.9765 – 0.9807 remains a key resistance and good place to sell with a tight stop loss. Overall I remain neutral.

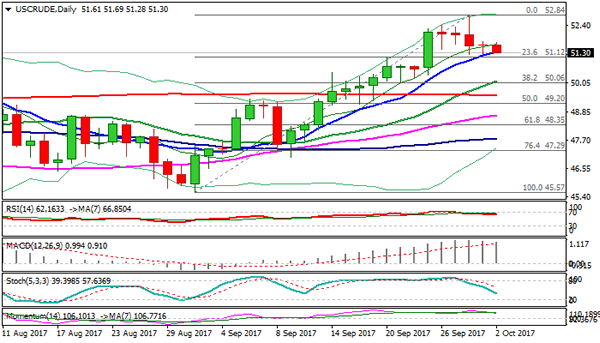
Technical Outlook: WTI OIL – Rising 10SMA Continues To Contain But Risk Of Deeper Pullback Exists
WTI oil stands at the back foot on Monday and threatening of further downside, but near-term price action so far remains limited by rising 10SMA. Oil price eases from fresh multi-month high at $52.84, posted after three straight weeks of strong rally, driven by increasing signs that effects of global oversupply that last for three years are easing. Corrective action is seen as likely scenario, however, dips were so far mild as strong bullish setup of daily studies and positive sentiment is building up. Risk of deeper pullback would remain low while the price stays above rising 10SMA which could result in renewed attempts higher. Otherwise, deeper correction towards psychological $50.00 support (Fibo 38.2% of $45.57/$52.84/rising 20SMA) could be expected on sustained break below near-term base at $51.20 zone.
Res: 51.75, 52.41, 52.84, 53.00
Sup: 51.20, 50.41, 50.00, 49.54
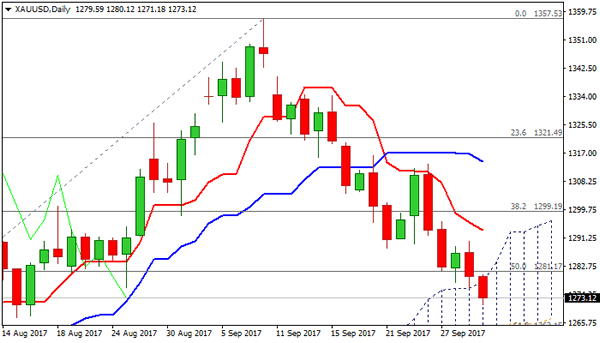
Technical Outlook: SPOT GOLD – Bears May Extend To $1263 After Penetrating Into Rising Daily Cloud
Spot Gold hit fresh 7-week low at $1271 on Monday, on fresh bearish extension that penetrated into rising daily cloud (spanned between $1278 and $1258) and cracked support at $1272, provided by 100SMA.
The yellow metal remains in downtrend from $1357 (08 Sep peak) which eyes supports at $1267/63 (15 Aug trough / Fibo 61.8% of $1204/$1357 ascend) and could extends to $1258 (daily cloud base).
Bears might be delayed for consolidative / corrective actions on oversold slow stochastic on daily chart, with no firmer bullish signals seen so far.
Solid resistances lay at $1278/80 (broken cloud top / session high) guarding Friday’s high / 55SMA at $1290 and falling daily Tenkan-sen at $1293.
The latter is expected to cap extended corrective upticks.
Res: 1278, 1280, 1290, 1293
Sup: 1271, 1267, 1263, 1258\