
Sample Category Title
USD/JPY Strong Short-Term Bullish Move
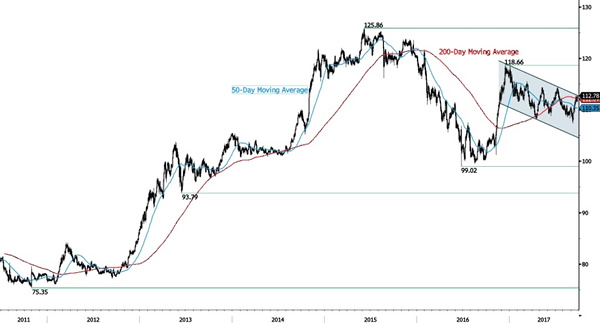
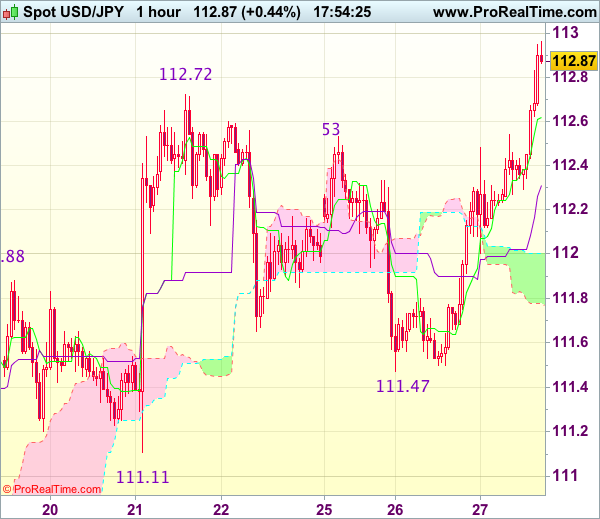
USD/JPY is monitoring the 113.00 level. Strong support is located at 111.12 (20/09/2017 low). Expected to show further bearish pressures. Yet, downside risks are rising as markets may soon take some short-term profit.
We favor a long-term bearish bias. Support is now given at 99.02 (10/08/2013 low). A gradual rise towards the major resistance at 125.86 (05/06/2015 high) seems unlikely. Expected to decline further support at 93.79 (13/06/2013 low).
GBP/USD Riding Downtrend Channel
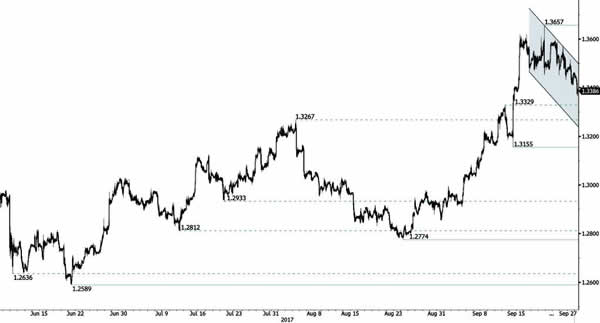
GBP/USD is pushing lower after recent surge. Hourly resistance is given at 1.3657 (20/09/2017 high). Strong support is given at 1.3431 (25/09/2017 low). Expected to show continued bearish pressures.
The long-term technical pattern is reversing. The Brexit vote had paved the way for further decline. Long-term support can be found at 1.1841 (07/10/2017 low). Long-term resistance given around 1.35 is at stake and indicates a long-term reversal in the negative trend. Yet, it is very unlikely at the moment.
EUR/USD Continued Bearish Pressures
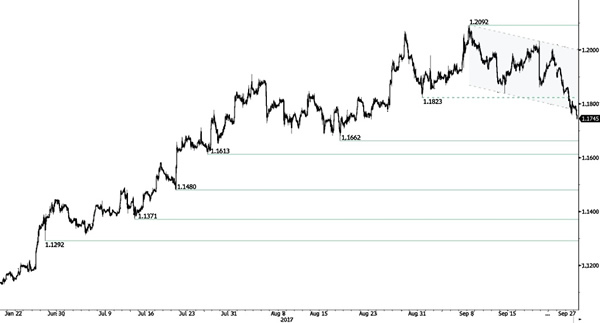
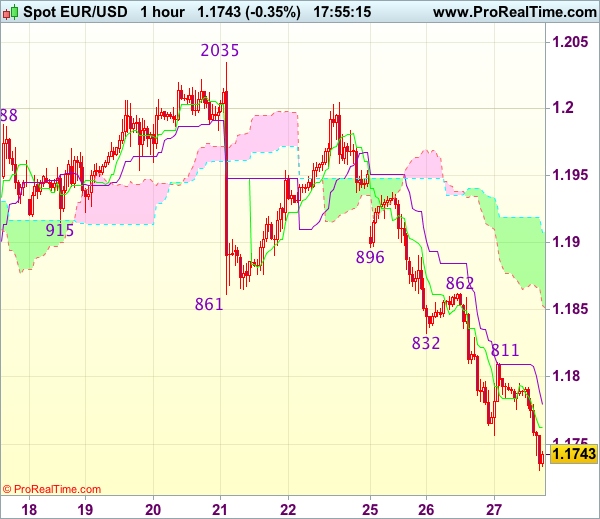
EUR/USD is going lower within downtrend channel. Hourly resistance can be found at 1.2092 (08/09/2017 high) while hourly support lies at 1.1823 (31/08/2017 low) has been broken. Stronger support is given at a distance at 1.1662 (17/08/2017 low). Expected to show continued short-term bearish pressures.
In the longer term, the momentum is now turning largely positive. We favour a continued bullish bias. Key resistance is holding at 1.2252 (25/12/2014 high) while strong support lies at 1.0341 (03/01/2017 low).
Elliott Wave Analysis: German DAX And CADJPY
We see risk-on mode in full action this morning, with DAX breaking out of a triangle which is positive for xxx/JPY pairs. In the mean time USD remains strong.
DAX is seen in a fifth wave now which has a room for 12750, as we think that higher degree red wave 5) can be in progress. We see market in bullish mode as long as price is above 12550.
German DAX, 1H
CADJPY is also making a nice leg up from 90.00 area where pair show evidences of a completed corrective wave four, so there is a chance that market is in wave five already headed above 91.60. But be aware of a pullback down for wave ii) which may seek support near 90.40-90.70.
CADJPY, 1H
Trade Idea : EUR/USD – Sell at 1.1810
EUR/USD - 1.1754
Most recent candlesticks pattern : N/A
Trend : Down
Tenkan-Sen level : 1.1762
Kijun-Sen level : 1.1780
Ichimoku cloud top : 1.1908
Ichimoku cloud bottom : 1.1851
Original strategy :
Sell at 1.1850, Target: 1.1750, Stop: 1.1885
Position : -
Target : -
Stop : -
New strategy :
Sell at 1.1830, Target: 1.1720, Stop: 1.1865
Position : -
Target : -
Stop : -
As the single currency has fallen again after brief recovery to 1.1811, adding credence to our bearish view that the decline from .2093 top is still in progress and downside bias remains for further weakness to 1.1720 (1.236 times projection of 1.2093-1.1838 measuring from 1.2035), then 1.1700, however, loss of downward momentum should prevent sharp fall below previous support at 1.1662 and bring rebound later.
In view of this, we are looking to sell euro on recovery, above the Kijun-Sen (now at 1.1780) would bring recovery to said resistance at 1.1811, however, previous support at 1.1832-38 (now resistance) should hold and bring another decline later. Above resistance at 1.1862 would abort and signal low is formed instead, bring a stronger rebound to 1.1896 (another previous support).
Technical Outlook: AUDUSD – Bears May Extend Towards Daily Cloud Base At 0.7794
The Aussie holds firmly in red and trends lower for the third day. The pair penetrated deeply into thick daily cloud after strong bearish acceleration on Tuesday broke and closed below cloud top (0.7905), which previously acted as strong support and now reverted to resistances.
The pair is currently riding on extended third wave of five –wave cycle from 0.8124 (08 Sep top), which eyes strong supports at 0.7807/04 (15 Aug trough / FE 161.8%) and daily cloud base at 0.7794.
Daily Tenkan-sen / Kijun-sen lines formed bear-cross which adds on bearish pressure for final push towards above mentioned targets.
However, bears may show stronger hesitation at 0.7800 support zone, as this marks key short-term support and oversold conditions of daily studies warn of correction.
Upticks should ideally stay capped by broken daily cloud to keep bears intact for further retracement of larger 0.7328/0.8124 ascend, seen on sustained break below 0.7800 breakpoint zone.
Res: 0.7888, 0.7905, 0.7948, 0.7969
Sup: 0.7820, 0.7807, 0.7794, 0.7753
Trade Idea : USD/JPY – Buy at 112.50
USD/JPY - 112.83
Most recent candlesticks pattern : N/A
Trend : Up
Tenkan-Sen level : 112.62
Kijun-Sen level : 112.31
Ichimoku cloud top : 112.00
Ichimoku cloud bottom : 111.78
Original strategy :
Buy at 111.70, Target: 112.70, Stop: 111.35
Position : -
Target : -
Stop : -
New strategy :
Buy at 112.50, Target: 113.50, Stop: 112.15
Position : -
Target : -
Stop : -
As the greenback has surged again and broke above previous resistance at 112.72, confirming recent upmove has resumed and upside bias remains for further gain to 113.00, then 113.25-30 (1.236 times projection of 107.32-111.04 measuring from 109.55), however, near term overbought condition should prevent sharp move beyond previous chart resistance at 113.58 and reckon 113.75-80 would hold from here, risk from there has increased for a retreat later.
In view of this, we are looking to reinstate long on pullback as 112.40-50 should limit downside. Below the Kijun-Sen (now at 112.31) would defer and suggest an intra-day top is formed, brig correction towards the upper Kumo (now at 112.00) which is likely to hold on first testing.
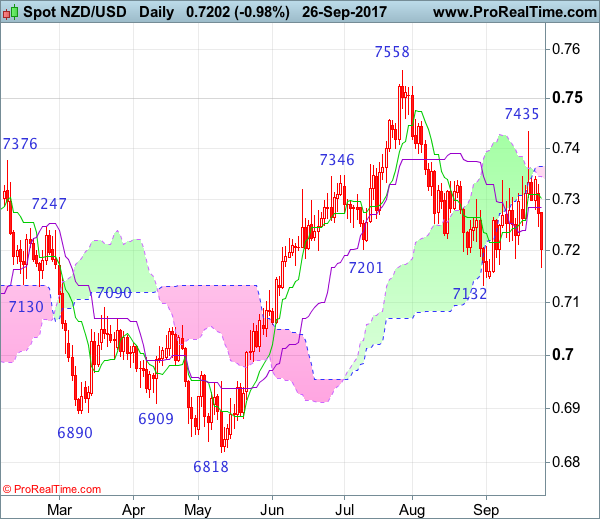
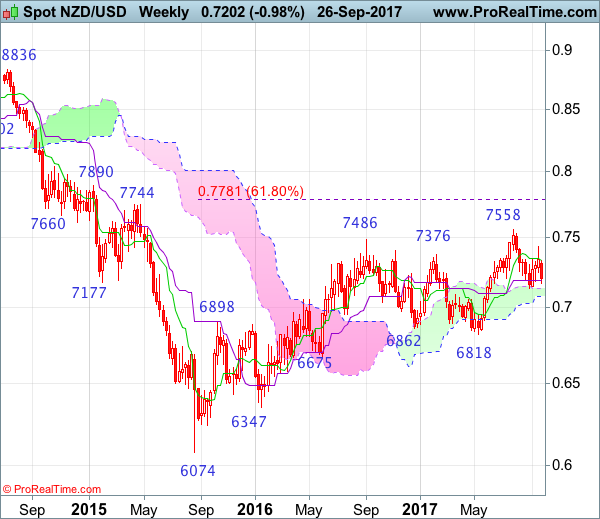
NZD/USD Candlesticks and Ichimoku Analysis
Weekly
• Last Candlesticks pattern: N/A
• Time of formation: N/A
• Trend bias: Up
Daily
• Last Candlesticks pattern: Shooting star
• Time of formation: 20 Sep 2017
• Trend bias: Up
NZD/USD – 0.7186
Although kiwi rebounded to 0.7435 last week, renewed selling interest did emerge there and has fallen again (we recommended in our previous update to sell kiwi at 0.7395 and a short position was entered on such bounce), the subsequent selloff has justified our bearishness and suggest the rebound from 0.7132 has ended at 0.7435, hence downside bias remains for another test of this support, however, break there is needed to retain bearishness and signal another leg of the corrective decline from 0.7558 top is underway, then further fall to 0.7095-00 and then 0.7050 would follow but near term oversold condition should limit downside to 0.7000-10 (psychological support and 100% projection of 0.7558-0.7132 measuring from 0.7435) and 0.6950 would hold from here, bring rebound later.
On the upside, whilst initial recovery to 0.7225-30 cannot be ruled out, reckon upside would be limited to 0.7270-75 and bring another decline. Above the Tenkan-Sen (now at 0.7307) would risk test of 0.7325-30 but reckon the upper Kumo (now at 0.7365) would hold, bring another decline later. A break of the upper Kumo would risk another bounce to said resistance at 0.7435 but only breach there would shift risk back to upside and signal the corrective decline from 0.7558 has ended, bring further gain to 0.7500. then towards said resistance at 0.7558.
Recommendation: Short entered at 0.7395 met target at 0.7195 with 200 points profit and would sell again at 0.7250 for 0.7050 with stop above 0.7350.
On the weekly chart, although rebounded last week, kiwi met renewed selling interest at 0.7435 and has dropped again in line with our bearish expectation, signaling the recovery from 0.7132 has ended at 0.7435 and mild downside bias remains for the corrective fall from 0.7558 top to bring retracement of recent upmove, below said support at 0.7132 would add credence to this view and extend weakness to the lower Kumo (now at 0.7081), then 0.7000-10 (psychological support and 100% projection of 0.7558-0.7132 measuring from 0.7435), however, near term oversold condition should limit downside to 0.6950 and reckon 0.6880 would hold from here, bring rebound.
On the upside, expect recovery to be limited to 0.7240-50 and 0.7300 should hold, bring another decline. Only above said resistance at 0.7435 (last week’s high) would abort and shift risk back to upside, this would also suggest the pullback from 0.7558 has ended instead, bring further gain to 0.7500. Only a break of 0.7558 would extend medium term erratic upmove from 0.6074 (2015 low) to 0.7690-00 (61.8% projection of 0.6074-0.7485 measuring from 0.6818) and later towards 0.7780-85 (61.8% Fibonacci retracement of 0.8836-0.6074), however, reckon upside would be limited to 0.7890 and price should falter well below resistance at 0.8035.
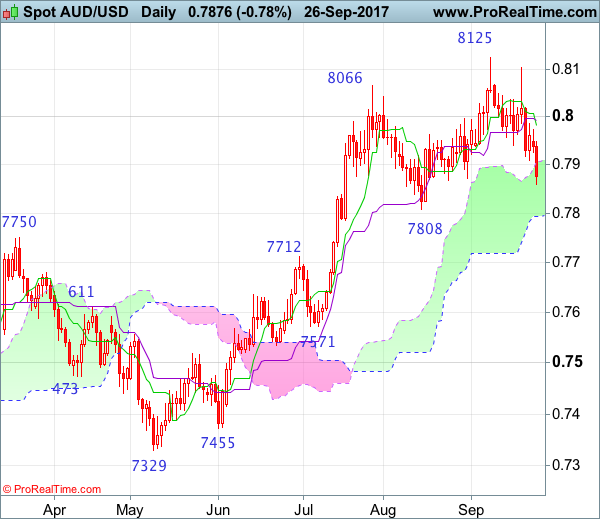
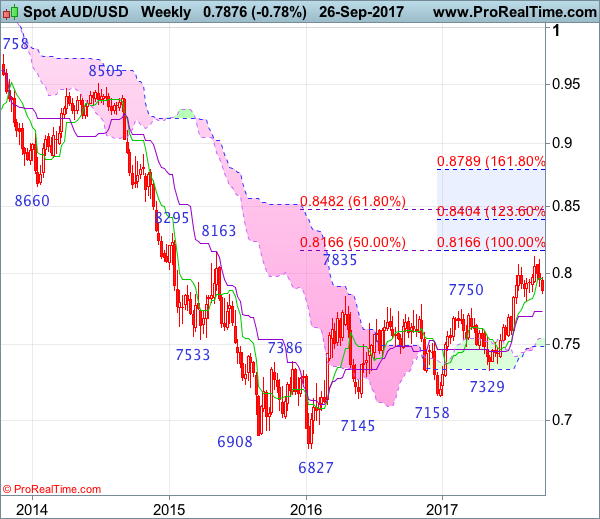
AUD/USD Candlesticks and Ichimoku Analysis
Weekly
• Last Candlesticks pattern: Long white candlestick
• Time of formation: 10 Jul 2017
• Trend bias: Up
Daily
• Last Candlesticks pattern: Long white candlestick
• Time of formation: 18 Jul 2017
• Trend bias: Up
Although aussie rebounded last week to 0.8104, as the pair has dropped again after faltering below resistance at 0.8125, retaining our view that further consolidation below this recent high (with a shooting star on the daily chart followed by a black candlestick), adding credence to our view that top has possibly been formed at 0.8125 and mild downside bias remains for test of previous support at 0.7808 but break there is needed to signal retracement of recent rise has commenced and extend weakness to 0.7760-70 first.
On the upside, expect recovery to be limited to 0.7920-25 and the Tenkan-Sen (now at 0.7987) should hold, bring another decline later. A daily close above the Kijun-Sen (now at 0.7996) would defer and risk rebound to 0.8015-20 but said resistance at 0.8104 should hold, bring another decline. Only a break of 0.8104 would shift risk back to upside and signal pullback has ended, bring retest of 0.8125, break there would extend the medium term erratic rise from 0.6827 to 0.8163 resistance, then 0.8200 but reckon 0.8260-65 (61.8% projection of 0.7329-0.8066 measuring from 0.7808) would limit upside and price should falter well below another previous resistance at 0.8295.
Recommendation: Hold short entered at 0.8060 for 0.7860 with stop lowered to 0.8020
On the weekly chart, aussie met renewed selling interest at 0.8104 last week and has slipped again, retaining our near term bearishness for the retreat from 0.8125 temporary top to bring test of support at 0.7808, however, a drop below this level is needed to add credence to this view, bring retracement of recent rise to 0.7727 (50% Fibonacci retracement of 0.7329-0.8125 as well as current level of the Kijun-Sen), however, reckon downside would be limited to 0.7675-80 and 0.7630-35 (61.8% Fibonacci retracement) would hold, bring rebound later.
On the upside, whilst recovery to the Tenkan-Sen (now at 0.7967) cannot be ruled out, reckon 0.8000 would limit upside and 0.8020 should hold, bring another retreat. Above 0.8020 would risk rebound towards 0.8104 but break there is needed to signal the retreat from 0.8125 has ended, bring retest of this level later. Above said resistance at 0.8125 would extend the erratic rise from 0.6827 low to previous resistance at 0.8163, then 0.8200 but loss of upward momentum should limit upside to 0.8260-65 (61.8% projection of 0.7329-0.8066 measuring from 0.7808) and another previous resistance at 0.8295 should hold, price should falter well below 0.8390-00, bring retreat later.
USD Rally Still Has Legs
The US dollar rally is finally here
The greenback has been rallying strongly over the last two days amid building expectations the Fed will hike the federal fund rate target by another notch in December together with expectation Donald Trump will finally passes his tax reform which aim mainly at lowering the corporate tax rate from 35% to 20% and capping the one for individual to 35% from 39.6% among other specificities.
The US dollar surged across the board, adding gains against most of its peers. It gained the most against the pound sterling, the Swiss franc and the Japanese yen, rising 0.52%, 0.51% and 0.43% respectively. According to the probability extracted from the Fed funds futures, the probability of a rate hike in December has risen to 70%, compared to 63% a week ago.
The greenback also got a boost from Donald Trump amid an announcement made on Wednesday about a proposed rate tax cuts plan. Beside the tax cuts for individual and corporation, the proposal also mentioned an increase of the bottom tax rate to 12% from 10% currently and also the eventuality of a higher tax rate for wealthy individuals. It seems that this tax cuts plan will find a larger support among Congress members as its overall effect will be more balanced compared to what the Donald has proposed so far.
We were advocating, for quite some time now - that the USD was oversold and that the time was coming for a recovery. It seems that the time has finally come, especially against currency that profited extensively of the USD weakness. Currency such as the AUD, AUD and EM in general are potential subject to a broader correction.
Mario Draghi does not threaten Bitcoin
This was one comment that seems at first sight very bullish for the bitcoin, the most famous digital currency. Mario Draghi, in its statements to the European Parliament’s Committee on Economic and Monetary Affairs has mentioned that the European Central Bank has not the mandate to prohibit or regulate Bitcoin.
It is clear that big institutions are not in a hurry to regulate. We believe that the power of money creation is one very important power that are not going to be given up. Ironically, new derivatives are going to be introduced by next year on the Bitcoin and should, by the way, likely weigh on prices. The gold price has been driven lower by paper contracts. The ratio between paper and physical is currently higher than 200 according to the latest disclosure from the CME. One can perfectly imagine what impact it may trigger when derivatives are going to be introduced on Bitcoin.
Right now, the Bitcoin price is holding slightly below $4000 and there are upside pressures. The price is likely to rise again. We do not consider that this is a “tulip mania” the bubble name of the hyperinflation that occurred in Netherlands. It is rather another way to store wealth.