
Sample Category Title
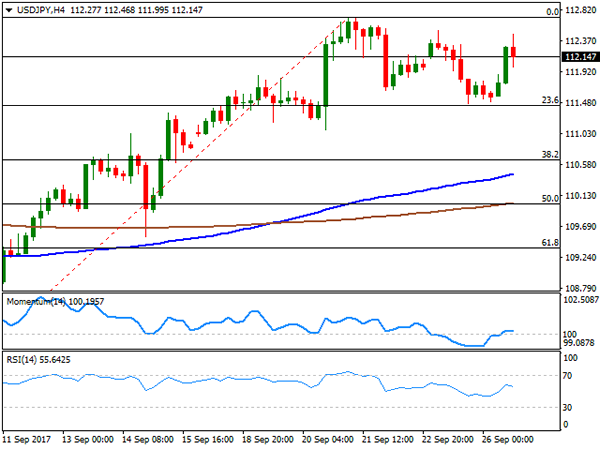
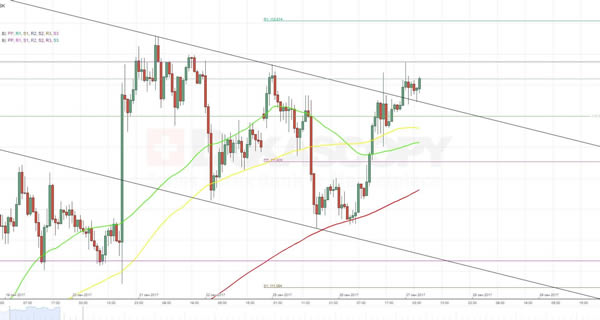
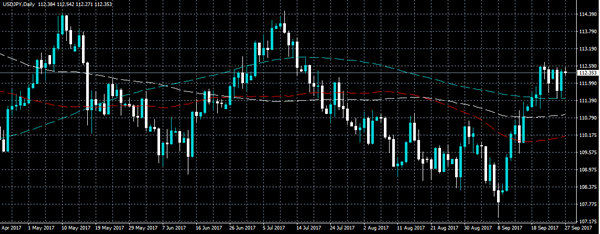
Technical Outlook: USDJPY – Bounce From Daily Cloud Top May Extend Above 113.00
The pair rallies for the second day after daily cloud top offered significant support and contained repeated downside attempts.
From the technical point of view, this was strong boost for the pair, with additional supports for the US dollar from rising hopes of US rate hike and US tax reforms.
Fresh bullish acceleration on Wednesday met target at 112.80 (Fibo 76.4% of 114.49/107.31 descend) and may extend towards 113.57 (14 Aug trough) on sustained break above 112.80/113.00 pivots.
Daily Techs are in firm bullish setup and supportive for further advance, with broken 200SMA (112.07) acting as good support, which should keep the downside protected.
Res: 113.00, 113.57, 114.00, 114.49
Sup: 112.07, 111.75, 111.47, 111.06
Foreign Exchange Market Commentary: EUR/USD, USD/JPY, GBP/USD, GOLD, WTI CRUDE, DJIA, FTSE100, DAX
EUR/USD
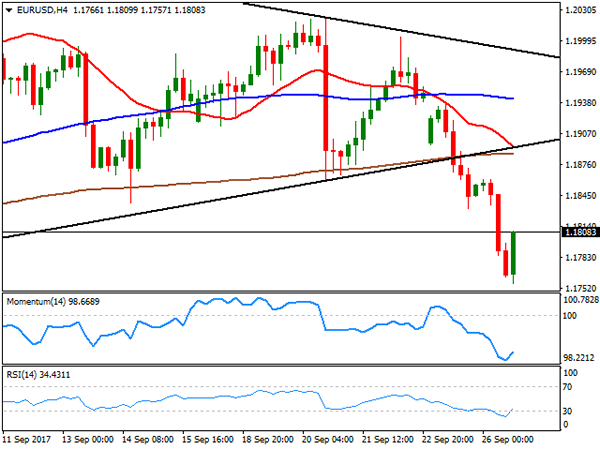
The greenback ended the day with solid gains against most of its major rivals, partially bolstered by risk aversion at the beginning of the day, later on demand amid high-yielding rivals' weakness. The common currency was unable to lift its head after the outcome of the German election, with local investors resuming selling after London's opening. The EUR/USD pair fell down to 1.1757, its lowest since August 23rd, accelerating south on the technical breakout of the 1.1820/30, which contained declines since late August. In the news, the Euro zone had little to offer beyond the German's August import price index, which was a modest disappointment, flat monthly basis. In the US, on the other hand, there were multiple Fed speakers hitting the wires, including head's Yellen.
Chances of a rate hike increased after she reiterated that low inflation is probably due to transitory factors, while adding that keeping rates on-hold until inflation reaches 2% could be "imprudent." New home sales fell in August, down by 3.4%, against a 3.3% advance expected, whilst the Richmond Fed manufacturing index for September soared to 19 from previous 14. Market players chose to ignore the negative housing data, keeping the greenback bid at the end of the day.
The EUR/USD pair has shed almost 200 pips since the week started, leaving intraday technical readings within oversold territory, but by no means suggesting an upcoming reversal. Now bouncing from the mentioned low, the pair remains well below the daily ascendant trend line coming from mid August broken on Monday, while in the 4 hours chart, the 20 SMA has already crossed below the 100 SMA and points to do the same with the 200 SMA, this last in the 1.1890 region, reflecting the strong selling momentum that would likely extend over the upcoming sessions, as long as selling interest contains upward corrections in the 1.1820/30 region. Further declines will expose 1.1661, August monthly low.
Support levels: 1.1760 1.1730 1.1695
Resistance levels: 1.1825 1.1850 1.1890
USD/JPY
The USD/JPY recovered most of the ground lost on Monday, settling around 112.15 as the greenback recovered its charm. Despite risk aversion, the pair managed to hold above the 111.40 level during the Asian session, a relevant level as it stands for the 23.6% retracement of the September upward move. The dollar advanced further despite mixed local data on broad demand during the US afternoon, finding some support on headlines referring to the country's growth agenda, as President Trump announced that lawmakers are discussing the tax reform, which includes a "tremendously" cut for the middle class. He added that he wants to lower the corporate tax rate, to bring bank overseas investments, also aiming to make the tax code simpler and fair. Earlier on the day, the BOJ released the Minutes of its latest meeting, but was a non-event as the Central Bank maintained the status quo. The overall stance for the pair is bullish as it keeps holding above the 200 DMA, also around 111.40, although in the 4 hours chart, technical readings lack directional momentum, as indicators hold pat around their mid-lines. Nevertheless, and given that the price develops well above modestly bullish 100 and 200 SMAs, the risk is towards the upside, with further gains expected on a break above 112.71, this month high.
Support levels: 111.75 111.40 111.00
Resistance levels: 112.10 112.40 112.85
GBP/USD
The USD/JPY recovered most of the ground lost on Monday, settling around 112.15 as the greenback recovered its charm. Despite risk aversion, the pair managed to hold above the 111.40 level during the Asian session, a relevant level as it stands for the 23.6% retracement of the September upward move. The dollar advanced further despite mixed local data on broad demand during the US afternoon, finding some support on headlines referring to the country's growth agenda, as President Trump announced that lawmakers are discussing the tax reform, which includes a "tremendously" cut for the middle class. He added that he wants to lower the corporate tax rate, to bring bank overseas investments, also aiming to make the tax code simpler and fair. Earlier on the day, the BOJ released the Minutes of its latest meeting, but was a non-event as the Central Bank maintained the status quo. The overall stance for the pair is bullish as it keeps holding above the 200 DMA, also around 111.40, although in the 4 hours chart, technical readings lack directional momentum, as indicators hold pat around their mid-lines. Nevertheless, and given that the price develops well above modestly bullish 100 and 200 SMAs, the risk is towards the upside, with further gains expected on a break above 112.71, this month high.
Support levels: 111.75 111.40 111.00
Resistance levels: 112.10 112.40 112.85
GOLD
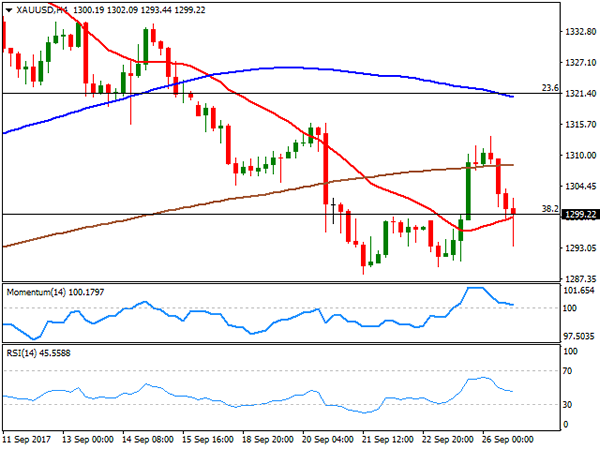
Spot gold turned back south, ending the day around $1,299.30 a troy ounce amid a resurgent dollar. Risk aversion at the beginning of the day lifted the metal up to 1.313.57, but dollar's broad demand afterwards put it under pressure after the US opening, particularly as the market is showing less sensitivity to US-North Korea headlines. The commodity came under further pressure after Fed's Yellen comments on inflation and monetary policy, reaffirming policymakers' will to keep on moving forward, despite "transitory" inflation setback. The daily chart for the metal shows that its currently hovering around the 38.2% retracement of its July/September rally, and also that the risk is towards the downside, as the 20 SMA keeps gaining downward strength above the current level, whilst technical indicators are turning back south within bearish territory. In the 4 hours chart, the price is pressuring a marginally bullish 20 SMA, whilst technical indicators turned sharply lower from near overbought levels, now aiming to enter bearish territory, also favoring a downward move ahead.
Support levels: 1,288.10 1,280.45 1,272.20
Resistance levels: 1,303.95 1,311.60 1,321.45
WTI CRUDE OIL
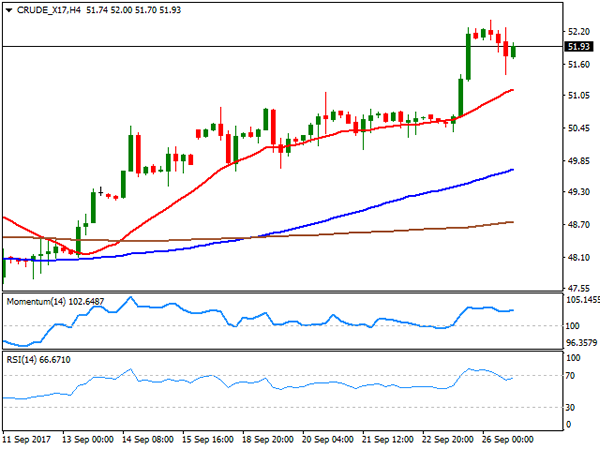
Crude oil prices surged at the beginning of the day to fresh multi-month highs, but ended it marginally lower, as investors took profits out of the table ahead of US inventories reports. West Texas Intermediate crude futures traded as high as $52.41 a barrel to settle around 51.90, overall maintaining the positive stance seen over the last few days. Maintaining the commodity afloat, were news that rising demand in emerging economies will help the market to rebalance. Daily basis, the positive tone persists, as technical indicators have barely pared their advance, holding within overbought territory anyway, whilst the price is firmly above all of its moving averages, and as the shortest accelerates above the larger ones. In the shorter term, and according to the 4 hours chart, technical indicators have entered a consolidative phase near overbought levels, whilst the 20 SMA extended its advance, now acting as dynamic support around 51.20. Positive news coming from the US will likely result in the price retesting 53.74, last April high.
Support levels: 51.20 50.50 49.80
Resistance levels: 52.45 53.10 53.70
DJIA
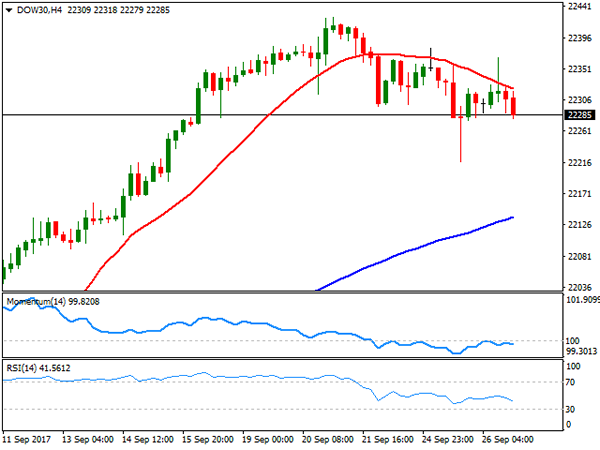
US indexes closed mixed, with the Dow Jones Industrial Average down 11 points, to 22,284.32, down for a fourth consecutive day, but the Nasdaq Composite and the S&P posting modest advances, up by 0.15% and 0.01% respectively. US equities hovered within gains and losses all through the day, as Fed's Chairwoman Yellen failed to motivate investors. Within the Dow, Apple led advancers, up 1.72%, followed by Nike, which added 0.88%. McDonald's was the worst performer, down 1.86%, followed by DowDuPont that lost 1.41%. The daily chart for the index shows that technical indicators retreated further from overbought levels, now clearly supporting a downward corrective movement, although the price remains far above all of its moving averages, with the 20 DMA heading north around 22,140, a key support, should the decline continue. Shorter term, and according to the 4 hours chart, the Dow also gains downward momentum, capped by a bearish 20 SMA, now at 22,320, and with technical indicators gaining downward strength within negative territory.
Support levels: 22,258 22,216 22,140
Resistance levels: 22,320 22,370 22,424
FTSE100
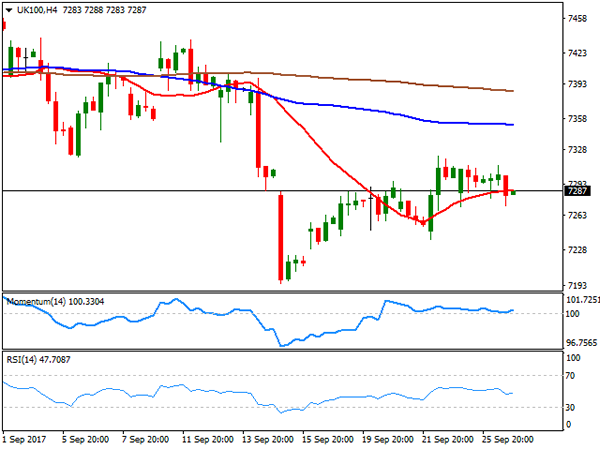
The FTSE 100 ended the day marginally lower, down 15 points, at 7,285.74, undermined by comments from EU Tusk, who said that there had been "no sufficient progress" within Brexit negotiations. Despite PM May's encouraging speech from late last week, European negotiators are unwilling to move forward until the divorce Bill and citizens' rights are settled, undermining confidence in the Pound, and UK assets. NMC was the best performer, adding 2.76%, followed by Carnival which gained 2.68% after raising its full-year forecast for earnings, while also rising its forecast for net revenue yields. Shire led declines, down 2.36%, followed by WPP which closed 1.69% lower. The index remains within Friday's range, still biased lower according to technical readings, as indicators are turning south within negative territory, whilst the 20 DMA extended further lower above the current level. In the 4 hours chart, however, the index turned neutral, now stuck around its 20 SMA and with technical indicators heading nowhere around their mid-lines.
Support levels : 7,236 7,195 7,152
Resistance levels: 7,312 7,344 7,381
DAX
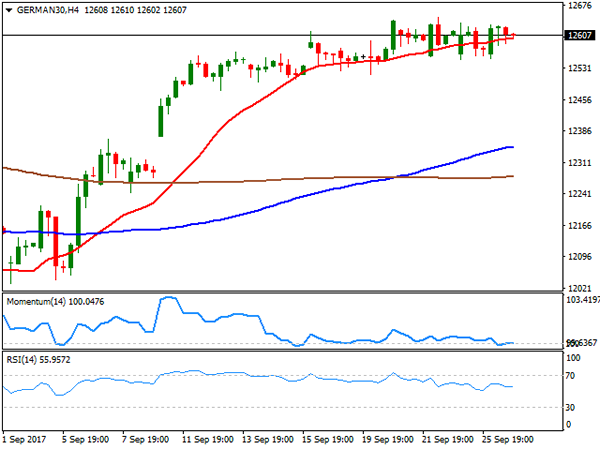
Equities saw little change in Europe this Tuesday, as early slides, triggered by risk aversion, were reversed ahead of the close. A weaker EUR should have pushed equities higher, but falling oil prices and geopolitical jitters offset any positive momentum within European stocks. The German DAX managed to add 10 points, or 0.08%, to end the day at 12,605.20, with most members ending the day up, led by Linde, which added 2.54%, and Volkswagen that gained 2.33%. Adidas was the worst performer, down 2.01% on the day. The daily chart for the index shows that it remains stuck within a limited range, but near September highs, maintaining the upside favored. In the same chart, technical indicators hold near overbought readings, with the Momentum modestly lower and the RSI marginally higher, giving no clear clues on what's next. In the shorter term, and according to the 4 hours chart, the index turned neutral, now standing a few points above its 20 SMA, and with technical indicators heading nowhere within neutral territory.
Support levels: 12,537 12,489 12,439
Resistance levels: 12,584 12,630 12,677
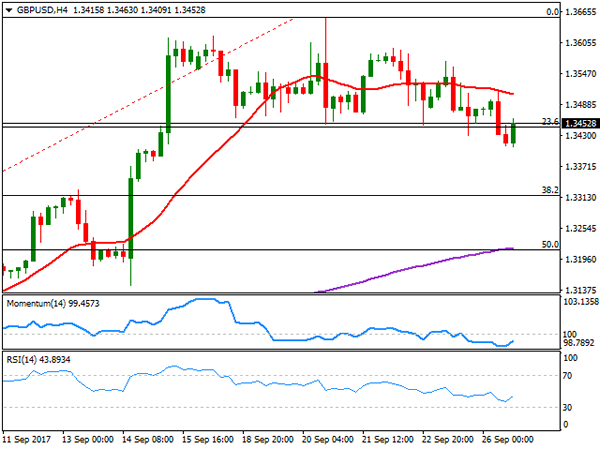
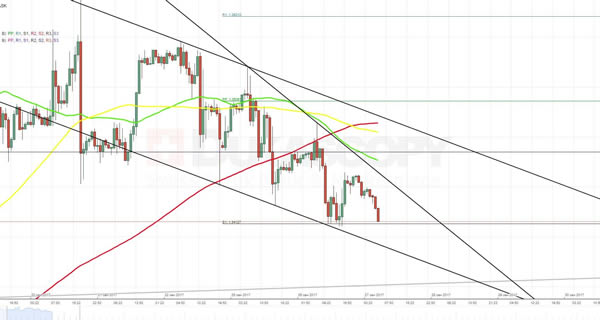
Technical Outlook: GBPUSD – Risk Of Deeper Pullback After Break Below 1.3450 Base
Fresh bearish acceleration on Wednesday eventually took out key near-term support at 1.3450 (former congestion floor) which was repeatedly cracked but without firm break.
Fresh weakness was triggered by stronger dollar, boosted by Fed Yellen's comments on further rate hikes and hopes on Trump's tax reform.
Cable hit fresh nearly two-week low at 1.3363 after bears broke below 1.3400 handle (round-figure support / 4-hr cloud base) and may extend weakness towards next targets at 1.3318 (Fibo 38.2% of 1.2773/1.3655 rally) and 1.3282 (rising 20SMA).
Daily RSI reversed from overbought territory and shows enough space at the downside for deeper correction of 1.2773/1.3655 ascend.
Broken 4-hr cloud base now acts as initial resistance, followed by former base at 1.3450 and broken 10SMA at 1.3477.
Res: 1.3400, 1.3450, 1.3477, 1.3514
Sup: 1.3363, 1.3318, 1.3282, 1.3268
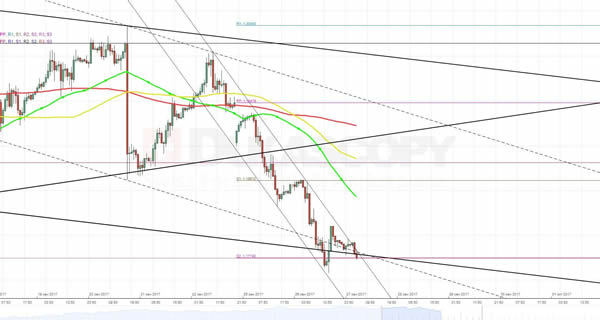
Technical Outlook: EURUSD – Extended Weakness Eyes Daily Key Support Provided By Cloud Top
The Euro extends post-German election weakness into third straight day with fresh pressure on the single currency coming from broadly stronger dollar. Tuesday’s remarks of Fed Chair Yellen, who said that the Fed needs to continue gradual interest rate hikes despite uncertainty about the inflation, raised hopes that the US central bank would act in December, as markets expect.
The Euro generated strong bearish signals on completion of H&S pattern on daily chart on break below the neckline (1.1848), as well as close below 1.1826/04 pivots (Fibo 61.8% of 1.1662/1.2092 upleg / 55SMA).
Fresh bearish acceleration on Wednesday dented Fibo 76.4% support at 1.1763 and eyes very strong supports at 1.1724/20 (daily Ichimoku cloud top / Fibo 38.2% of 1.1118/1.2092 rally).
Rising cloud which tracks bullish action since mid-Apr marks significant support which should ideally contain correction from 1.2092, with oversold slow stochastic on daily chart, supporting the notion.
However, strong near-term bearish sentiment may drive the price below cloud top and risk test of next pivot at 1.1662 (17 Aug trough), loss of which would sideline larger bulls for stronger correction.
Res: 1.1803, 1.1848, 1.1861, 1.1887
Sup: 1.1720, 1.1662, 1.1605, 1.1545
XAU/USD Analysis: Makes Expected Rebound
An area around the 1,313.61 mark indeed represented a sort of benchmark, which bullion traders used to try to restore previously lost positions. As this advance had a short-term effect, the pair expectedly fell back through the weekly and monthly PP as well as the 55- and 100-hour SMAs yesterday. On the one hand, such movement points out on formation of a minor descending channel. If this is true, then the rate is likely to continue to move to the bottom, trying to hit the weekly S2 at 1,283.66.
A pressure from the above technical indicators would support such movement. On the other hand, there is a need to take into account that three times in a row the rate failed to pass through the 1,290.93 level.
USD/JPY Analysis: Tests 112.55 Mark Again
One of the ideas expressed yesterday appeared to be true. The currency pair, indeed, formed a minor descending channel and after forming the second reaction low used the 200-hour SMA as a springboard to break through a combined resistance set up by the weekly PP at 111.90 in conjunction with the 55- and 100-hour SMAs. Despite disappointing Yellen’s speech the rate even managed to test the monthly R2 at 112.55. Basically, today the buck has all means to make the sixth attempt to break to the top. But the fact that the northern side is secured by the upper edge of a long-term dominant pattern plus the above monthly R2, this new attempt is expected to fail again.
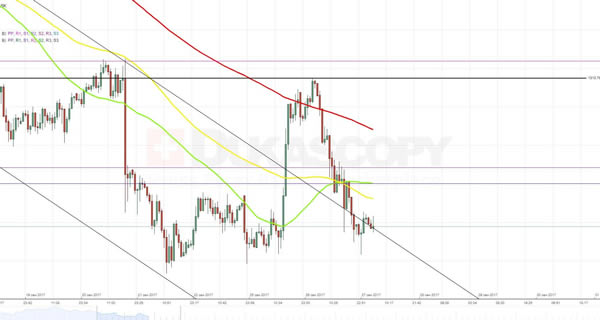
GBP/USD Analysis: Forms Falling Wedge
In accordance with expectations, a combined resistance formed by the 55-, 100- and 200-hour SMAs did not let the Pound to recover against the Dollar. In contrast, the pressure from those indicators formed a short-term falling wedge that most likely is going to break during this trading session. In theory, the breakout should occur in the northern direction.
But in this particular case, the upper side still remains protected by the above moving averages plus the monthly R2 at 1.3485, while the opposite direction is obstructed only by the weekly S2 at 1.3327. In addition to that, in larger perspective bears most probably are willing to push the rate back to the 1.3208 area.
EUR/USD Analysis: Tries To Break Medium-Term Channel
As it was expected, the Dollar continued to appreciate against the Euro and reached the bottom edge of medium-term descending channel yesterday. In fact, a reaction of traders on release of the CB Consumer Confidence even pushed the pair a little bit outside the pattern. But the subsequent Janet Yellen’s speech returned it back to the 1.18 area. Although bears are relentlessly trying to push the rate to the south, from trade patterns perspective a rebound should follow. In favour of this scenario speaks the fact that the pair is located at the intersection of lower boundaries of two descending channels as well as the weekly S2 at 1.1774. On the other hand, the 55- and 100-hour SMAs most probably will try to block any attempt to return back to the 1.1861 levels.
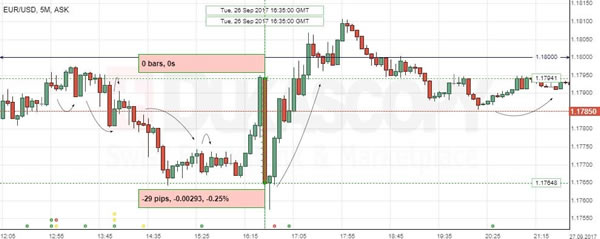
EUR/USD: Fed Chair Yellen Speech
The EUR/USD currency pair showed stormy reaction ahead and on the Fed’s Chair Janet Yellen address. Before the speech started, the EUR fell sharply against the US Dollar, touching the four-week low, but gained strength back initially. In the Wednesday’s morning session the pair continued to consolidate below the 1.1800 level.
Janet Yellen sounded more hawkish, telling that the Fed is likely to raise rates so long as inflation growth keeps accelerating, and suggested the Central Bank to wary of making changes too gradually. Meanwhile, the Euro was influenced by uncertainties concerning the ECB monetary policy outlook, as Mr. Draghi and his colleagues failed to clarify the next moves on the QE tapering.
USDJPY Dollar Driven
The USDJPY pair has moved back above the 112 handle, hitting 112.54 during the Asian session, as the U.S dollar index continues to climb, boosted by optimism over the Trump administrations proposed tax reform.
Going forward, the USDJPY remains strongly bullish, with the pair bouncing over 100-pips from the weekly low, after yesterday's technical re-test of its 200-day moving average, at 111.45
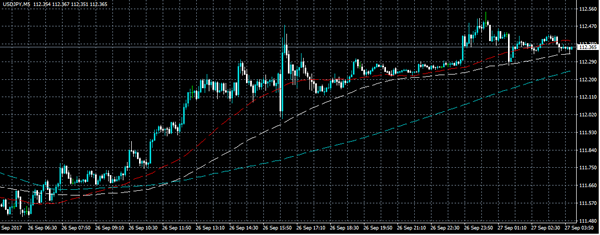
The USDJPY pair is increasingly U.S dollar driven this week, traders should look to the U.S dollar index, as it now trades above the key 92.83 technical level, for further indication of the next directional move in the USDJPY.
Key intraday USDJPY support is found at the pairs daily pivot point, at 112.07 and the pairs weekly pivot point, at 111.90. Below 111.90, key weekly support is found at 111.64 and 111.45.
Key intraday USDJPY resistance above the current daily price high, is found at 112.80, 113.20 and 113.79. The 114.41 level acts as the foremost weekly resistance.
.