Sample Category Title
Swiss Franc Trading On A Weaker Footing, Ahead Of Switzerland’s ZEW Expectations Data
For the 24 hours to 23:00 GMT, the USD rose 0.31% against the CHF and closed at 0.9693.
In the Asian session, at GMT0300, the pair is trading at 0.9704, with the USD trading 0.11% higher against the CHF from yesterday's close.
The pair is expected to find support at 0.9665, and a fall through could take it to the next support level of 0.9626. The pair is expected to find its first resistance at 0.9735, and a rise through could take it to the next resistance level of 0.9766.
Looking forward, market participants would keep a close watch on Switzerland's ZEW expectations index for September and the UBS consumption indicator for August, slated to release in a few hours.
The currency pair is showing convergence with its 20 Hr and 50 Hr moving averages.

Loonie Trading Marginally Higher, Ahead Of The BoC Governor’s Speech
For the 24 hours to 23:00 GMT, the USD declined 0.07% against the CAD and closed at 1.2358.
In the Asian session, at GMT0300, the pair is trading at 1.2355, with the USD trading a tad lower against the CAD from yesterday’s close.
The pair is expected to find support at 1.232, and a fall through could take it to the next support level of 1.2284. The pair is expected to find its first resistance at 1.2402, and a rise through could take it to the next resistance level of 1.2448.
Ahead in the day, all eyes will be on a speech by the Bank of Canada (BoC) Governor, Stephen Poloz.
The currency pair is trading below its 20 Hr moving average and showing convergence with its 50 Hr moving average.

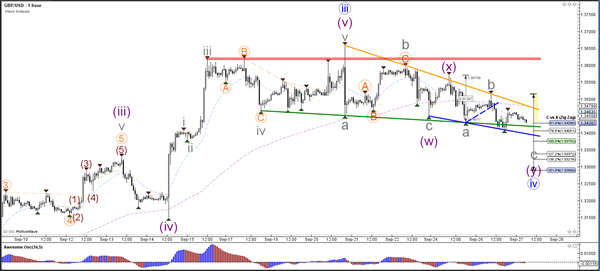
Daily Technical Analysis: GBP/USD Falling Wedge Pattern Approaches Support Within Wave-4
Currency pair GBP/USD
The GBP/USD seems to be building a falling wedge chart pattern (green/yellow lines). Price is now testing the support of that wedge. The corrective chart pattern fits within the larger wave 4 (blue) correction.
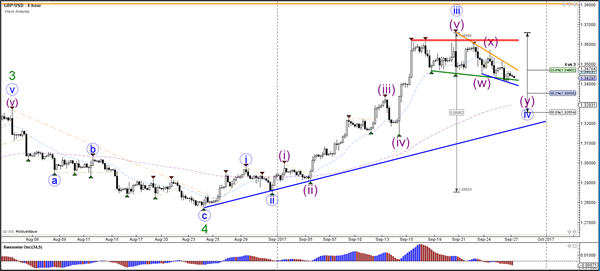
The GBP/USD has many support layers below it and could complete an ABC (grey) correction at support. A break of resistance (orange/red) could indicate the continuation of the uptrend whereas a break below support could indicate a larger wave C (grey) correction towards the Fibonacci targets.
Currency pair EUR/USD
The EUR/USD broke the support zone (dotted green) as expected in yesterday's analysis. The bearish momentum is indicated by the resistance trend line (yellow). Price could continue lower towards the Fibonacci targets but overall the bearish price action seems to be corrective. This could be explained by the potential wave 4 (blue).
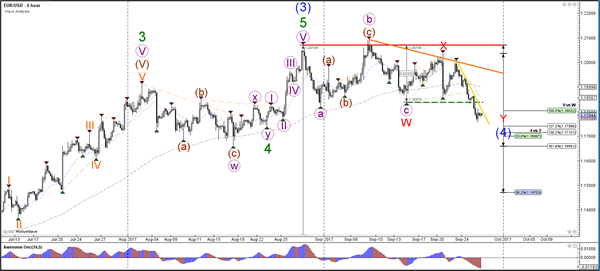
The EUR/USD broke the support (dotted blue) of the bear flag chart pattern and continued lower towards the 1.1750 quarter level. The EUR/USD could extend the bearish momentum if price breaks below the support trend line (blue).
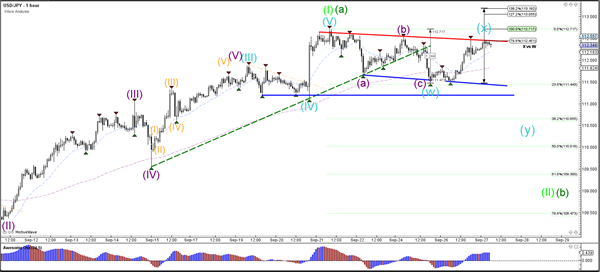
Currency pair USD/JPY
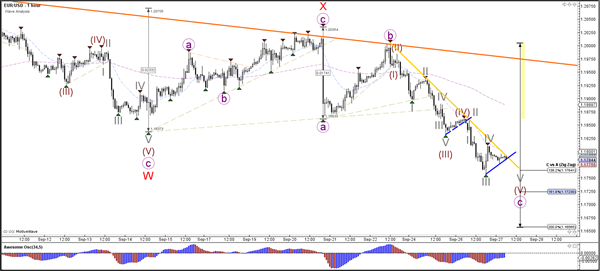
The USD/JPY has bounced at the 23.6% Fibonacci support level. Price is now testing the resistance trend line (red) of the correction and a bearish bounce could confirm the wave X (blue) correction. A deeper correction could be part of a wave 2 (light green) or a wave B (green).
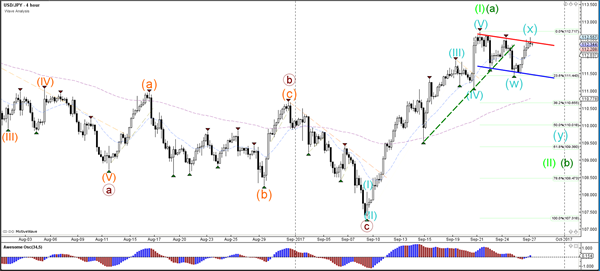
The USD/JPY is probably in a wave X (blue) unless price manages to break above the resistance trend line (red) and the 138.2% Fibonacci level of wave X vs W.
European Open Briefing: Equity Markets Across Most Of The Asia-Pacific Region Rose On Wednesday
Global Markets:
- Asian stock markets: Nikkei down 0.35 %, Shanghai Composite rose 0.05 %, Hang Seng up 0.49 %, ASX 200 rose 0.01 %
- Commodities: Gold at $1297.25.11 (-0.34 %), Silver at $16.88 (+0.01 %), WTI Oil at $52.16 (+0.54 %), Brent Oil at $58.13 (+0.36 %)
- Rates: US 10-year yield at 2.24, UK 10-year yield at 1.33, German 10-year yield at 0.40
News & Data:
- (USD) CB Consumer Confidence 119.8 vs 119.9 expected
- (USD) New Home Sales 560 K vs 585 K expected
- (EUR) German Import Prices m/m 0.0 % vs 0.1 % expected
- (GBP) High Street Lending 41.8 K vs 41.7 K expected
- (RUB) GDP y/y 2.3 % vs 1.8 % previous
- Brent oil edges up, near 26-month high amid supply concerns
- U.S. consumer confidence falls; new home sales hit eight-month low.
- Fed's Yellen says gradual hikes should continue, despite weak inflation- RTRS
Markets Update:
Equity markets across most of the Asia-Pacific region rose on Wednesday as investors hoped for progress on major tax reform in the United States following comments from Federal Reserve chief Janet Yellen about the prospect of higher interest rates. However, the Japanese stocks were lower ahead of interim dividend payments by many Japanese companies
USDJPY is currently seen trading around 112.35, earlier in the session price approached the 112.50 mark towards a 2-1/2 month high but couldn’t sustain the break above. Overall the Yen continues to drop against the USD continuing its 0.5 percent fall on Tuesday.
EURUSD continued to trade within a small range around 1.1780 closing onto more than one-month low as the Euro fell 0.5 percent against the US dollar mainly due to the anticipated political horse-trading in Germany before a new government could be formed. The dollar index, which tracks the dollar against a basket of currencies rose 0.1 percent and is currently valued at 93.09 touching the highest in a month.
AUDUSD is currently seen trading at 0.7865, as the Aussie fell 0.6 percent against the US Dollar. Meanwhile the NZDUSD is seen trading around the round number 0.7200 after recovering from yesterday’s lows of around 0.7160. Gold was little changed at $1,297.09 after slumping 1.3 percent in Tuesday’s session.
Upcoming Events:
- 08:00 GMT – (EUR) M3 Money Supply y/y
- 12:30 GMT – (USD) Core Durable Goods Orders m/m
- 12:30 GMT – (USD) Durable Goods Orders m/m
- 14:00 GMT – (USD) Pending Home Sales m/m
- 14:30 GMT – (USD) Crude Oil Inventories
- 15:45 GMT – (CAD) BOC Gov Poloz Speaks
- 18:00 GMT – (USD) FOMC Member Brainard Speaks
- 20:00 GMT – (NZD) Official Cash Rate
- 20:00 GMT – (NZD) RBNZ Rate Statement
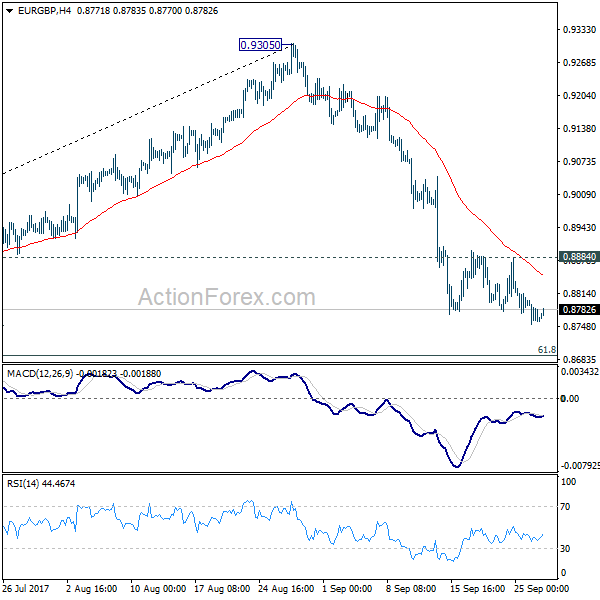
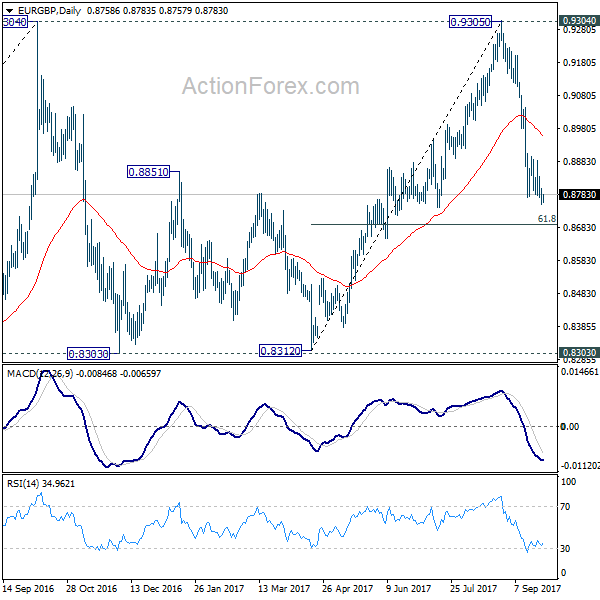
EUR/GBP Daily Outlook
Daily Pivots: (S1) 0.8743; (P) 0.8771; (R1) 0.8789; More...
Intraday bias in EUR/GBP remains on the downside for 61.8% retracement of 0.8312 to 0.9305 at 0.8691 and below. Fall from 0.9305 is seen as the third leg of consolidation pattern from 0.9304. We'll look for bottoming signal again at it approaches 0.8303 support. However, break of 0.8884 minor resistance is needed to indicate short term bottoming. Otherwise, outlook will stay bearish in case of recovery.
In the bigger picture, price actions from 0.9304 are viewed as a medium term corrective pattern. It's still in progress with fall from 0.9305 as the third leg. Break of 0.8303 could be seen. But we'd expect strong support from 0.8116 cluster support (50% retracement of 0.6935 to 0.9304 at 0.8120) to contain downside. Whole up trend from 0.6935 is expected to resume after consolidation from 0.9304 completes.
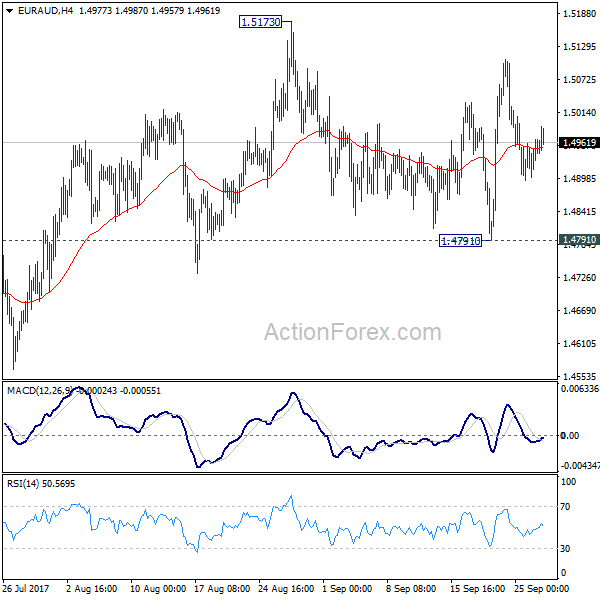
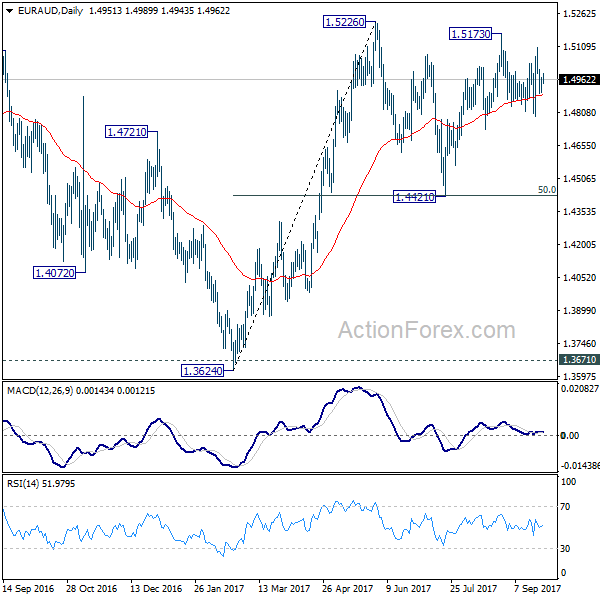
EUR/AUD Daily Outlook
Daily Pivots: (S1) 1.4909; (P) 1.4938; (R1) 1.4977; More....
Intraday bias in EUR/AUD remains neutral as consolidation continues in range of 1.4791/5173. On the upside, break of 1.5173/5226 resistance zone will finally resume larger rise from 1.3624. On the downside, break of 1.4791 support will turn bias to the downside and extend the fall from 1.5173 to retest 1.4421 support.
In the bigger picture, we're holding on to the view that corrective decline from 1.6587 medium term top has completed at 1.3624. Rise from 1.3624 is expected to extend to retest 1.6587. The corrective structure of the price actions from 1.5226 is affirming this view. Above 1.5226 will target a test on 1.6587 key resistance. However, break of 1.4421 support will dampen our view and would drag EUR/AUD lower to retest key support zone around 1.3624.
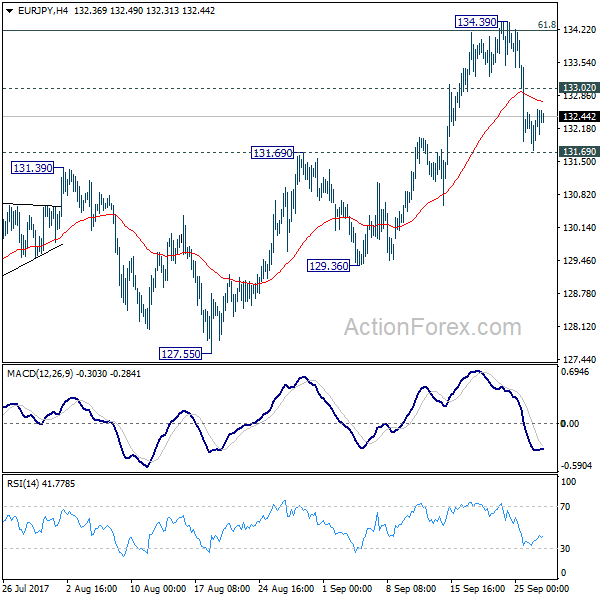
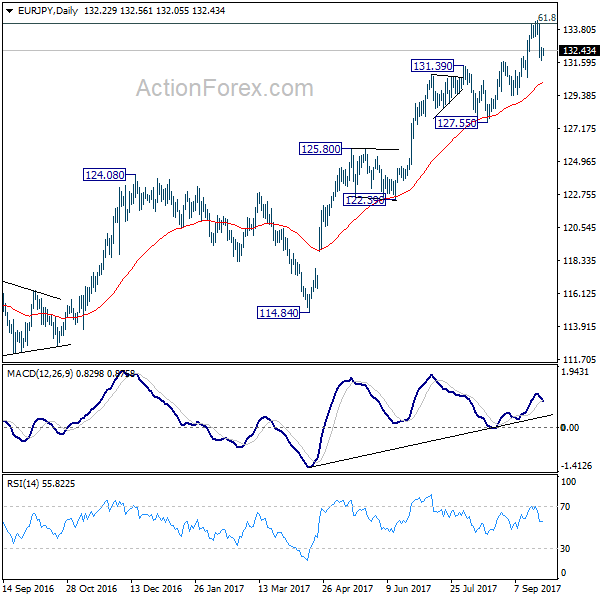
EUR/JPY Daily Outlook
Daily Pivots: (S1) 131.86; (P) 132.23; (R1) 132.71; More...
Intraday bias in EUR/JPY remains neutral as corrective trading from 134.39 is still in progress. Outlook stays bullish as long as 131.69 support holds. Above 133.02 minor resistance will turn bias back to the upside. Sustained break of 134.20 fibonacci level will extend larger up trend to 141.04 resistance next. However, break of 131.69 will be an early sigh of medium term reversal and will target 127.55 key support level instead.
In the bigger picture, current rise from 109.03 is seen as at the same degree as the down trend from 149.76 (2014 high) to 109.03 (2016 low). 61.8% retracement of 149.76 to 109.03 at 134.20 is already met. Sustained break there will pave the way to key long term resistance zone at 141.04/149.76. On the downside, break of 127.55 support is needed to be the first signal of medium term reversal. Otherwise, outlook will remain bullish.
Market Update – Asian Session: Yellen Spurs Hopes Of Dec Fed Hike, USD Rises
Asia Summary
Asian equity markets opened mixed, China electric vehicle names were higher on expected policy guidelines in October. Japan markets were notably weaker with more than 120 stocks on Nikkei225 and 1,100 on the Topix trading ex-dividend. Regional currencies weakened against the dollar, which extended gains to a 3rd day after Fed Chair Yellen boosted expectations for an interest rate increase in December. US financial press leaked what is said to be Trump’s tax framework, which will cap corporate tax rate at 20% (from 35%) and have a 35% individual tax rate that has option to go higher based on what Senate wants. PBOC skipped OMO with the onshore yuan strengthening for the first time in three sessions after PBOC set reference rate higher.
Key economic data
(NZ) New Zealand Q3 Employment Confidence Index: 113.8 v 113.4 prior (highest since 2008)
(CN) CHINA AUG INDUSTRIAL PROFITS Y/Y: 24.0% V 16.5% PRIOR
Speakers and Press
China/Hong Kong
(US) Commerce Sec Ross: US wants better physical access to China, China needs to respect IP rights
(CN) China NDRC fines 18 PVC companies for monopoly
(CN) Beijing city to release guidelines in Oct. on new-energy vehicle components, batteries and supporting facilities to boost development of the industry - Chinese press
(CN) China Beige Book International (CBB): economy may be faring well this year but 2018 is shaping up to be less positive, with progress on reducing debt and industrial capacity proving elusive
Korea
(US) Pres Trump: we are totally prepared for North Korea military option if we have to resort to that; the North Korean Leader is acting very badly - joint press conf with Spain PM Rajoy (US session)
(KR) US Treasury Dept announces new sanctions on North Korean banks and individuals
Japan
(JP) Nikkei225 more than 120 stocks will trad ex-dividend today and over 1,000 in Topix
New Zealand/Australia
(NZ) New Zealand First Party Leader Peters: Will wait until special votes are in on Oct 7th before deciding on what party to support, possible will talk to Labour Party or National Party before the 7th
(AU) Australia PM Turnbull: Gas industry executives have agreed to 2-yr supply deal for enough gas for Australia’s domestic market, govt won’t have to impose LNG export curbs for 2018 - Sky
Asian Equity Indices/Futures (00:00ET)
Nikkei -0.4%, Hang Seng +0.5%; Shanghai Composite +0.0%, ASX200 -0.3%, Kospi -0.0%
Equity Futures: S&P500 +0.1%; Nasdaq100 +0.1%, Dax +0.0%, FTSE100 -0.1%
FX ranges/Commodities/Fixed Income (00:00ET)
EUR 1.1795-1.1776; JPY 112.54-112.23; AUD 0.7888-0.7871;NZD 0.7216-0.7187
Dec Gold -0.3% at $1,297/oz; Nov Crude Oil +0.5% at $52.13/brl; Dec Copper +0.4% at $2.93/lb
GLD SPDR Gold Trust ETF daily holdings +0.8% t0 862.6 metric tonnes
(AU) Australia buys back A$700M in March and Oct 2019 bonds; March weighted avg yield 1.8099%; Oct weighted avg yield 1.9464%
(AU) Australia sells A$700M in 2027 bonds, avg yield 2.7834%, bid to cover 4.34x
(CN) PBOC OMO: skips v injected CNY50B in 14 and 28-day reverse repo prior; drains net CNY40B v CNY80B prior
USD/CNY (CN) China PBOC sets yuan reference rate at 6.6192 v 6.6076 prior (2nd consecutive weaker setting, weakest since Aug 29th)
Equities notable movers
Australia/New Zealand
CDU.AU Enters into copper concentrate sales agreement with Mitsui; +7.4%
YAL.AU Exercises option to acquire Mitsubishi's 28.9% stake in Warkworth for $230M; -4.5%
MYR.AU Said that major holder Solomon Lew hopes to either buy the company at an opportunistic price or that someone else will. – Australian; +2.8%
Singapore
MAND.SG Bids for Excelsior did not meet expectations, continues to review all options; -31.7%
Hong Kong/China
317.HK Strength attributed to parent China State Shipbuilding Corporation (600150.CN) suspended due to significant transaction/possible restructuring; +13.4%
US
BBD.CA US Commerce Dept applies duties of 220% as it says the company's C-Series jets are subsidized
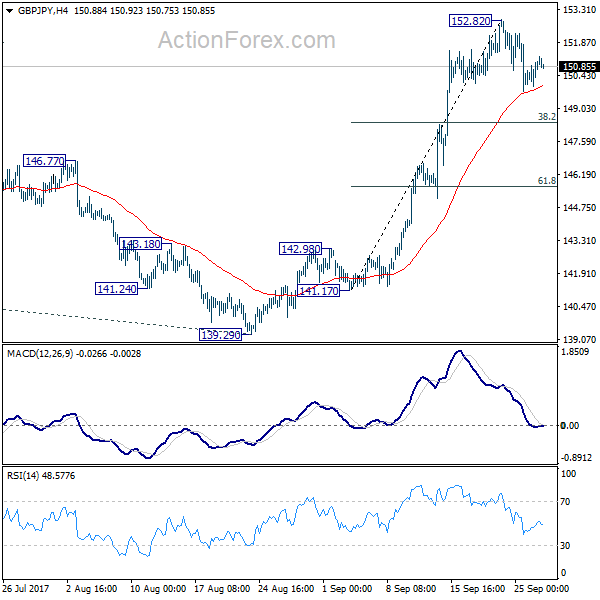
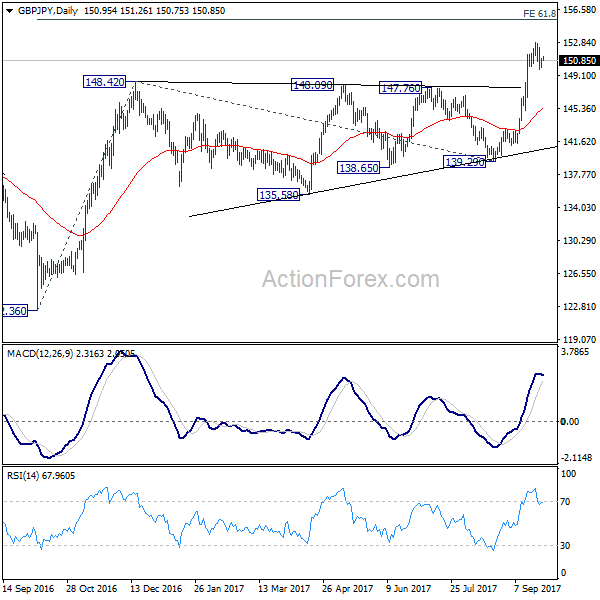
GBP/JPY Daily Outlook
Daily Pivots: (S1) 150.32; (P) 150.69; (R1) 151.42; More
GBP/JPY's correction from 152.82 is still in progress and deeper fall could be seen. But downside should be contained by 38.2% retracement of 141.17 to 152.82 at 148.36 to bring rally resumption. Break of 152.82 will extend the larger rise from 122.36 to 61.8% projection of 122.36 to 148.42 from 139.29 at 155.39 next.
In the bigger picture, medium term rebound from 122.36 is in progress. Firm break of 38.2% retracement of 196.85 to 122.36 at 150.43 will carry long term bullish implications. In that case, GBP/JPY could target 61.8% retracement at 167.78. For now, the bullish scenario is preferred as long as 139.29 support holds.
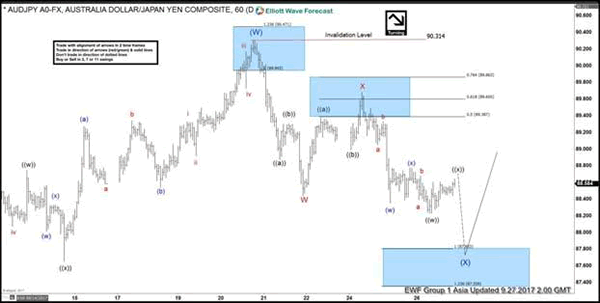
Elliott Wave View: AUDJPY Correction In Progress
AUDJPY Short Term Elliott Wave view suggests that the rally to 90.31 ended Intermediate wave (W). Intermediate wave (X) pullback remains in progress as a double three Elliott Wave structure. Down from 90.31, Minor wave (W) ended at 88.44 and Minor wave (X) ended at 89.68. Near term, while bounces stay below 90.31, expect pair to extend lower towards 87.36 – 87.8 area to complete Intermediate wave (X). Afterwards, pair should resume the rally to a new high or at least bounce in 3 waves. We don’t like selling the proposed pullback.
AUDJPY 1 Hour Elliottwave Chart
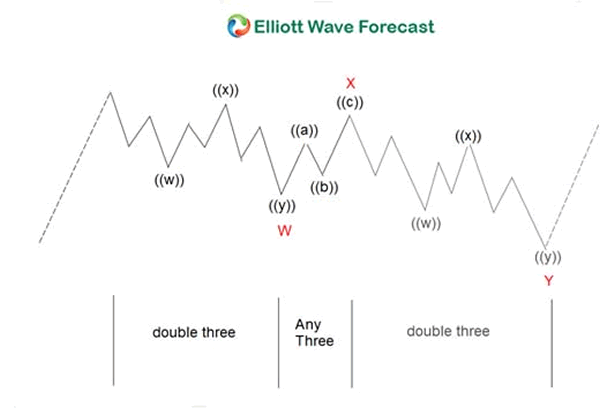
Double three ( 7 swings) is the most important pattern in Elliott wave’s new theory. It is also probably the most common pattern in the market these days. Double three is also known as a 7-swing structure. It is a very reliable pattern that gives traders a good opportunity to trade with a well-defined level of risk and target areas. The image below shows what Elliott Wave Double Three looks like. It has labels (W), (X), (Y) and an internal structure of 3-3-3. This means that all 3 legs has corrective sequences. Each (W) and (Y) is formed by 3 wave oscillations and has a structure of A, B, C or W, X, Y of smaller degrees.