
Sample Category Title
EUR/CHF Daily Outlook
Daily Pivots: (S1) 1.1390; (P) 1.1439; (R1) 1.1471; More...
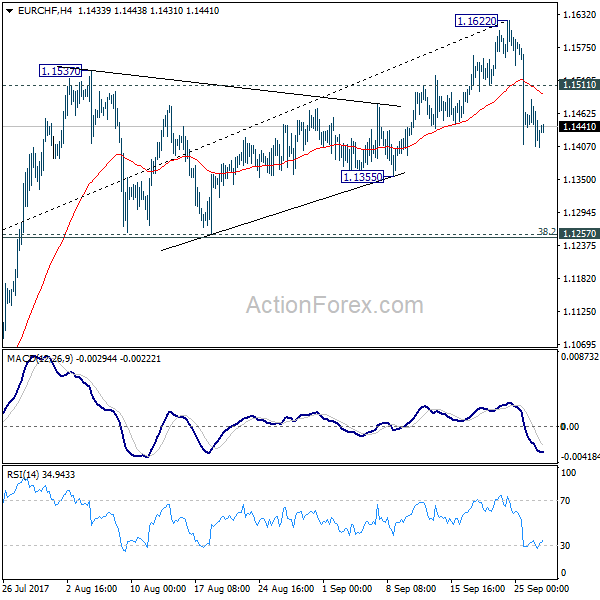
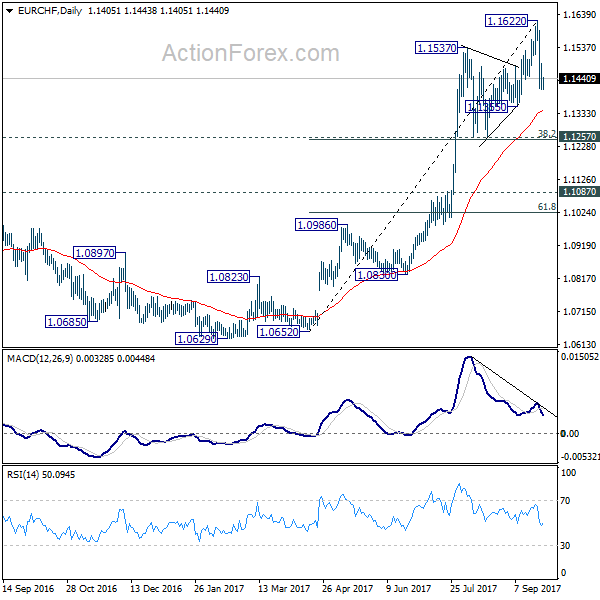
Intraday bias in EUR/CHF remains on the downside for the moment. Correction from 1.1622 short term top is in progress and would target 1.1355 support first. Strong support is expected from 1.1257 (38.2% retracement of 1.0652 to 1.1622 at 1.1251) to bring rebound. On the upside, break of 1.1511 minor resistance will suggest that the pull back is completed and bring retest of 1.1622.
In the bigger picture, long term rise from SNB spike low back in 2015 is still in progress. EUR/CHF should now be heading back to prior SNB imposed floor at 1.2000. For now, this will be the favored case as long as 1.1198 resistance turned support holds.
EUR/USD Daily Outlook
Daily Pivots: (S1) 1.1745; (P) 1.1803 (R1) 1.1850; More...
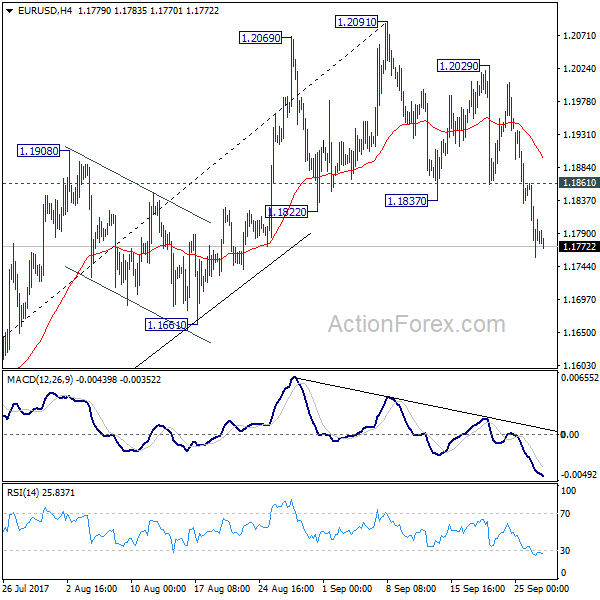
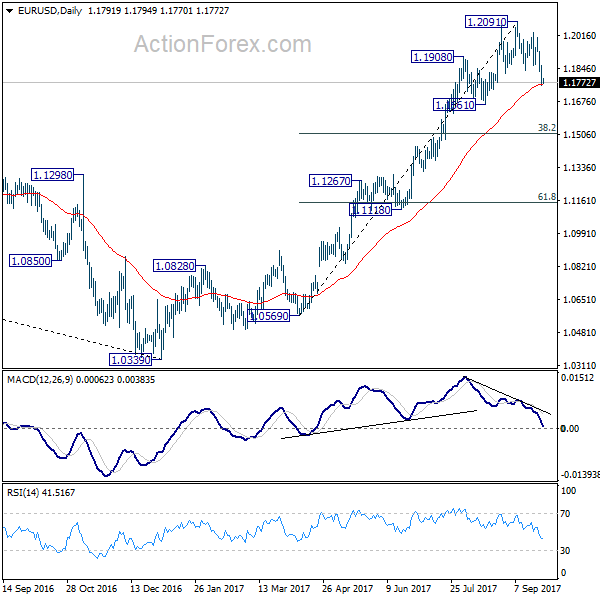
The correction from 1.2091 is still in progress and intraday bias remains on the downside for 1.1661 support. Such decline is correcting whole rise from 1.0569. Break of 1.1661 will target 38.2% retracement of 1.0569 to 1.2091 at 1.1510, where we're expecting support to bring rebound. On the upside, above 1.1861 minor resistance will turn intraday bias neutral first. But break of 1.2029 resistance is needed to confirm completion of the pull back. Otherwise, deeper fall will remain in favor as the correction develops.
In the bigger picture, rise from medium term bottom at 1.0339 is still in progress for 38.2% retracement of 1.6039 (2008 high) to 1.0339 (2017 low) at 1.2516. However, it should be noted that there is no confirmation of trend reversal yet. That is, such rebound from 1.0399 could be a correction. And the long term fall from 1.6039 (2008 high) could resume. Hence, we'd be cautious on strong resistance from 1.2516 to limit upside. But after all, break of 1.1661 is needed to indicate medium term topping. Otherwise, outlook will remain bullish in case of pull back.
GBP/USD Daily Outlook
Daily Pivots: (S1) 1.3406; (P) 1.3460; (R1) 1.3511; More....
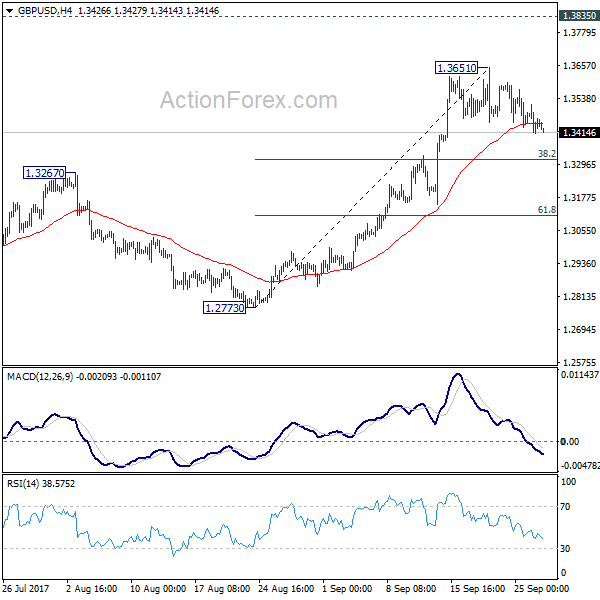
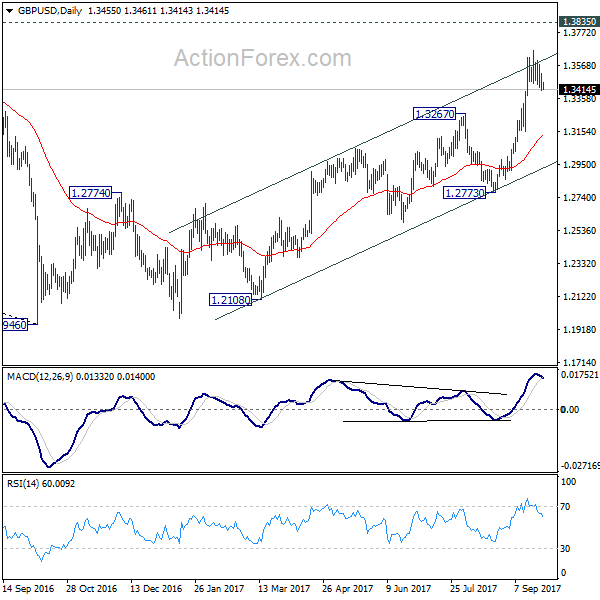
GBP/USD continues to gyrate lower as correction from 1.3651 extends. Intraday bias remains neutral for the moment. We'd continue to expect strong support from 38.2% retracement of 1.2773 to 1.3651 at 1.3316 to contain downside and bring rally resumption. Break of 1.3651 will turn bias back to the upside for 1.3835 support turned resistance next. Break there will target 55 month EMA (now at 1.4405).
In the bigger picture, current development argues that the long term trend in GBP/USD has reversed. That is, a key bottom was formed back in 1.1946 on bullish convergence condition in monthly MACD. Current rise from 1.1946 will target 38.2% retracement of 2.1161 (2007 high) to 1.1946 (2016 low) at 1.5466 next. In any case, medium term outlook will now stay bullish as long as 1.2773 support holds.
USD/CHF Daily Outlook
Daily Pivots: (S1) 0.9649; (P) 0.9688; (R1) 0.9723; More....
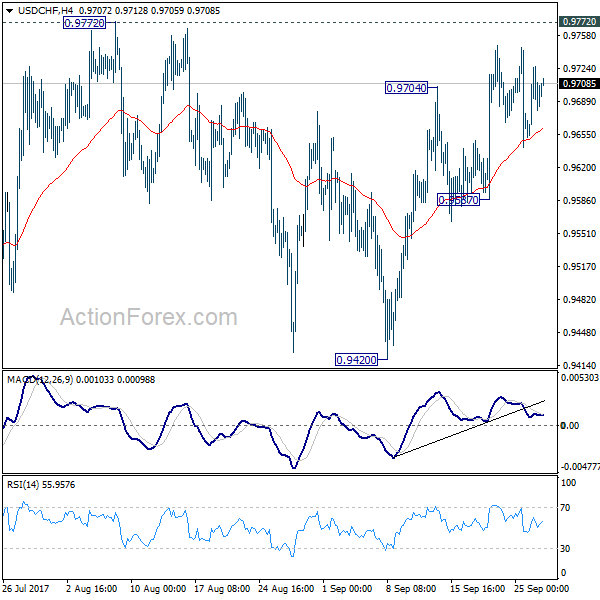
USD/CHF continues to engage in consolidative trading and intraday bias remains neutral at this point. On the upside decisive break of 0.9772 resistance will suggest that whole down trend form 1.0342 has completed. In that case, near term outlook will be turned bullish for 0.9860/1.0099 resistance zone. Nonetheless, with 0.9772 resistance intact, outlook remains bearish. Below 0.9587 minor support will turn bias back to the downside for retesting 0.9420 low.
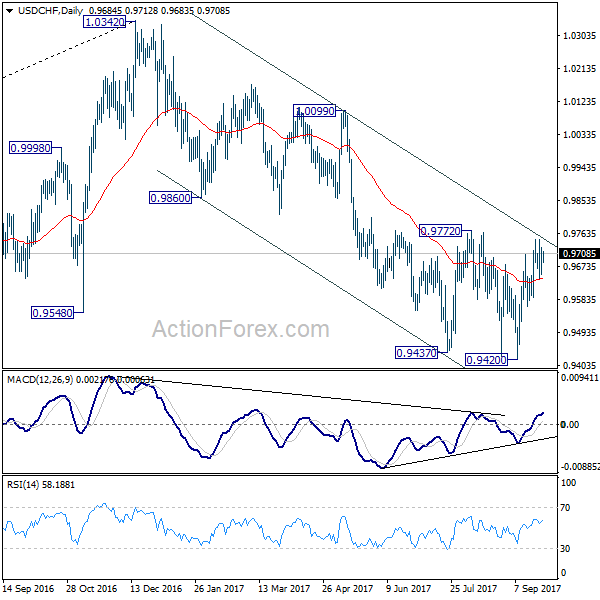
In the bigger picture, current development suggests that 0.9443 key support (2016 low) could be taken out firmly as down trend form 1.0342 extends. There are various interpretation of the price actions. But in any case, medium term outlook will stay bearish as long as 0.9772 resistance holds. Current down trend could extend to 38.2% retracement of 0.7065 (2011 low) to 1.0342 (2016 high) at 0.9090. However, break of 0.9772 will indicate that USD/CHF has successfully defended 0.9443 again and turn outlook bullish for 1.0099 resistance.
USD/JPY Daily Outlook
Daily Pivots: (S1) 111.65; (P) 112.06; (R1) 112.63; More...
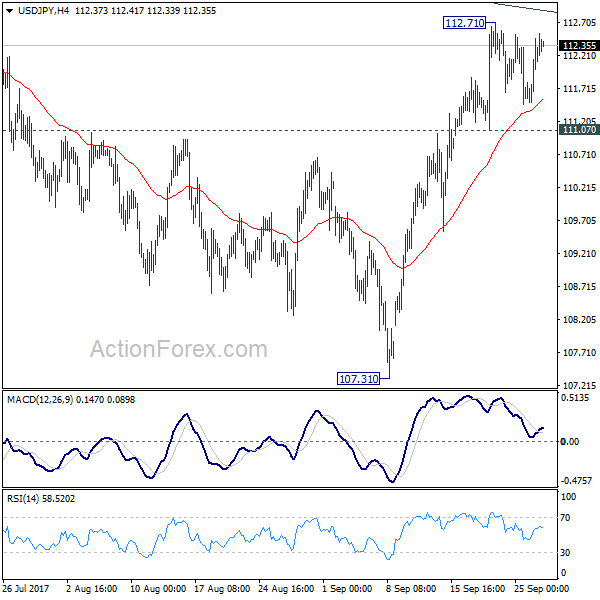
USD/JPY is still staying in range below 112.71 and intraday bias remains neutral first. Outlook is unchanged that further rise is expected as long as 111.07 support holds. Sustained break of medium term channel resistance (now at 112.90) will argue that whole correction from 118.65 has completed. In that case, further rise should be seen to 114.49 resistance for confirmation. However, break of 111.07 minor support will raise the risk of rejection from channel resistance and turn bias back to the downside for 55 day EMA (now at 110.72) and below.
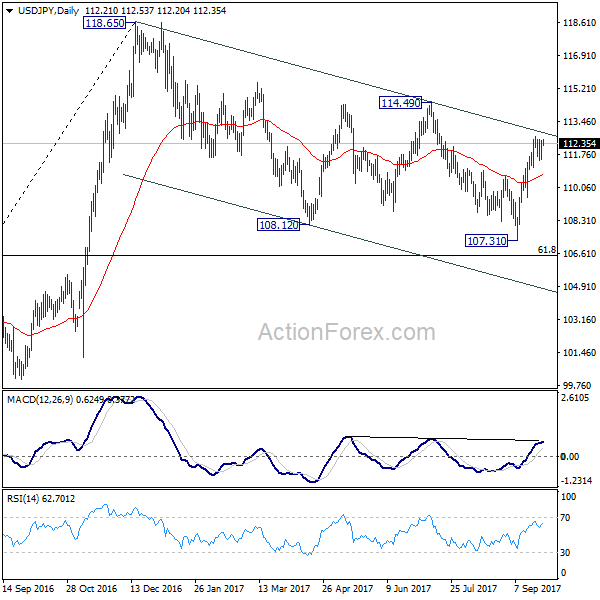
In the bigger picture, rise from 98.97 (2016 low) is seen as the second leg of the corrective pattern from 125.85 (2015 high). It's unclear whether this this second leg has completed at 118.65 or not. But medium term outlook will be mildly bearish as long as 114.49 resistance holds. And, there is prospect of breaking 98.97 ahead. Meanwhile, break of 114.49 will bring retest of 125.85 high. But even in that case, we don't expect a break there on first attempt.
USD/CAD Daily Outlook
Daily Pivots: (S1) 1.2311; (P) 1.2362; (R1) 1.2394; More....
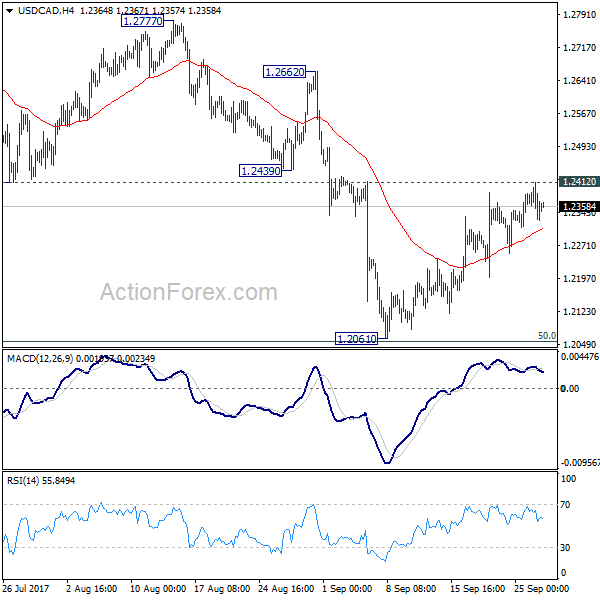
At this point, USD/CAD is still holding on to 1.2412 support turned resistance. Intraday bias remains neutral first. We'd remain cautious on strong support from 1.2048 to bring sustainable rebound. But still, break of 1.2412 support turned resistance is needed to be the first sign of trend reversal. Otherwise, outlook will remain bearish. Firm break of 1.2048 will pave the way to next fibonacci level at 1.1424. Break of 1.2412 will bring stronger rise back to 55 day EMA (now at 1.2520) and above.
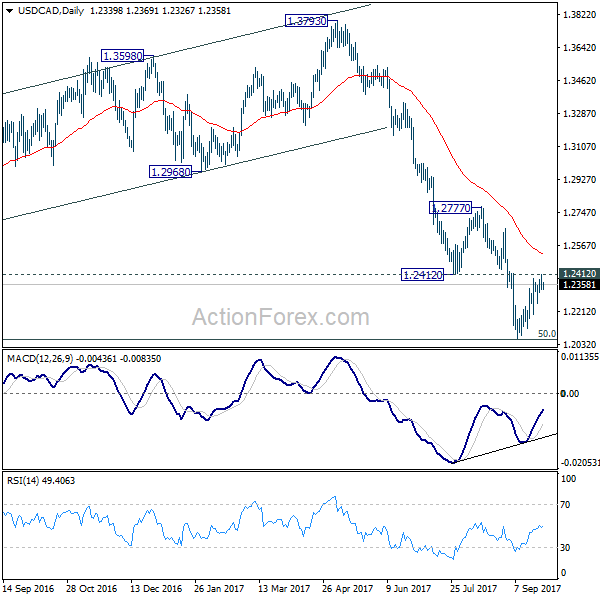
In the bigger picture, focus remains on 50% retracement of 0.9406 to 1.4869 at 1.2048. As long as this level holds, we'd still favor that case that fall from 1.4689 is a correction. Rebound from 1.2048 could extend the larger up trend from 0.9406. However, firm break of 1.2048 will indicate that fall from 1.4689 is at least a medium term down trend and should target 61.8% retracement at 1.1424 and below.
AUD/USD Daily Outlook
Daily Pivots: (S1) 0.7848; (P) 0.7898; (R1) 0.7937; More...
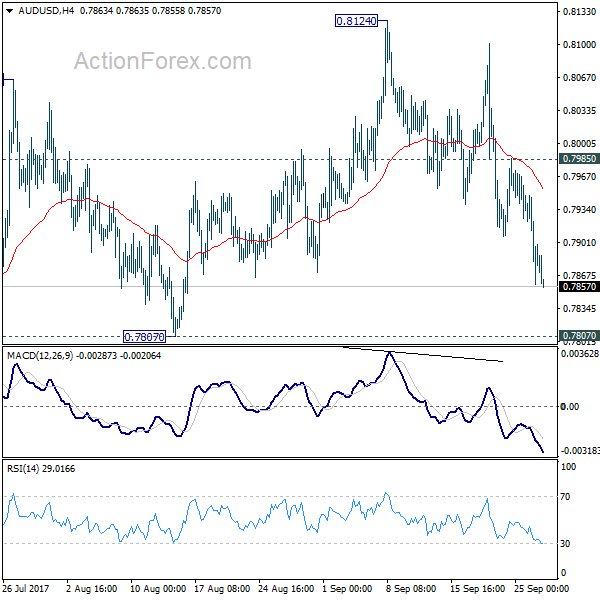
AUD/USD drops to as low as 0.7856 so far and correction from 0.8124 extends. Overall, with 0.7807 support intact, larger rally is still expected to resume later. Above 0.7985 minor resistance will turn bias to the upside for retesting 0.8124 high first. Break will target 00% projection of 0.6826 to 0.7833 from 0.7328 at 0.8335 next. However, considering bearish divergence condition in daily MACD, firm break of 0.7807 will indicate near term reversal and turn bias back to the downside for 55 week EMA (now at 0.7670).
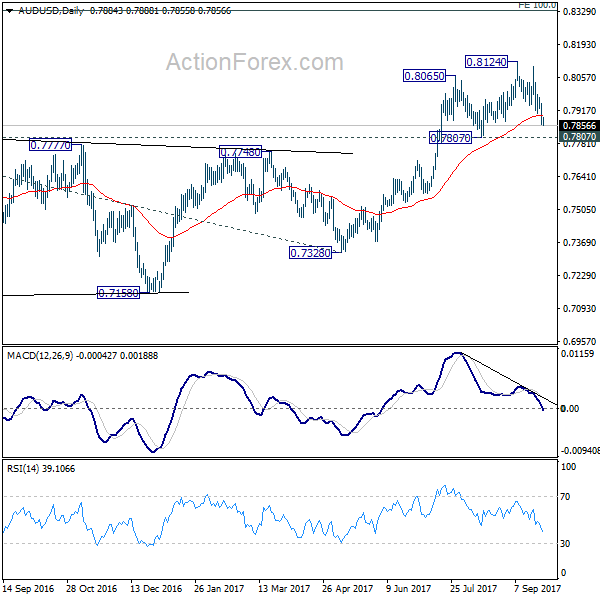
In the bigger picture, rise from 0.6826 medium term bottom is still in progress. At this point, there is no confirmation of trend reversal yet and we'll continue to treat such rebound as a corrective pattern. But in any case, break of 55 month EMA (now at 0.8090) will target 38.2% retracement of 1.1079 to 0.6826 at 0.8451. Break of 0.7807 support is needed to to be the first sign of completion of the rebound. Otherwise, further rise is now in favor.
Dollar Stays Firm after Yellen Speech, Trump’s Tax Plan Awaited
Dollar remains broadly firm today, unmoved by the cautious comments from Fed Chair Janet Yellen. Traders are eagerly awaiting the long-awaited tax reform from US President Donald Trump. Meanwhile, Euro and Kiwi continue to suffer post election weakness. It's reported that German Chancellor Angela Merkel have begun the coalition talk between CDU, CSU, GDP and Greens. But the common currency could stay pressured until the picture becomes clearer. And, it's consistent with the technical development that EUR/USD is in a medium term correction that would take some more time to complete.
Trump to deliver long awaited tax plan
Trump is expected to speak in Indiana on tax reform today. Yet, the details remained unclear with reports suggesting that Treasury secretary Mnuchin, Trump's chief economic adviser Gary Cohn, House Speaker Paul Ryan, Senate majority leader Mitch McConnell, House Ways and Means committee Chairman Kevin Brady and Senator Orrin Hatch still can't compromise of a number of issues. The biggest debate is on whether there should be any net tax cut on the wealthiest Americans, even if the top rate of income tax is lowered to 35% from 39.5% as proposed.
Fed Yellen still expects gradual tightening
Fed Chair Janet Yellen spoke at the National Association for Business Economics in Cleveland yesterday. Regarding the slowdown in inflation, Yellen noted that policy makers "may have misjudged the strength of the labor market, the degree to which longer-run inflation expectations are consistent with our inflation objective, or even the fundamental forces driving inflation." That highlights Fed's difficulty in forecasting inflation and thus its own rate path. Currently, there is a 30% chance that inflation could range anywhere from 1% to 3%. Any outcome could change the rate path drastically.
For now, Fed "continues to anticipate that, with gradual adjustments in the stance of monetary policy, inflation will rise and stabilize at around 2 percent over the medium term." And, "without further modest increases in the federal funds rate over time, there is a risk that the labor market could eventually become overheated, potentially creating an inflationary problem down the road that might be difficult to overcome without triggering a recession." Hence, "we should be wary of moving too gradually."
EC Tusk: No sufficient progress on Brexit negotiation yet
After meeting with UK Prime Minister Theresa May, European Council President Donald Tusk said he's "cautiously optimistic about the constructive and more realistic tone in the prime minister's speech in Florence and of our discussion today." But he reiterated EU's stance that discussion on future relations will start once there is "so called sufficient progress". And for now, "there is no sufficient progress yet".
May's office said in a statement that her Florence speech last week "had been intended to create momentum in the ongoing talks." And she urged "EU negotiators to now respond in the same spirit." And, May also said earlier that "by being creative in the ways we approach these issues, we can find solutions that work both for the remaining (EU) 27 but also for the UK and maintain that cooperation and partnership between the UK and the EU."
French Macron laid out plans for EU transformation
French President Emmanuel Macron set out his plans for a "profound transformation" of the US in his speech yesterday. He warned time time was running out for the EU to reinvent itself to counter the rise of far-right nationalism and "give Europe back to its citizens". He acknowledged that the Europe is "too slow, too weak too ineffective" and that's why isolationist attitude had resurfaced, with a far right party entering Bundestag for the first time in 70 years. In short, Macron called for a common finance minister for the Eurozone, budget and parliament. And he also proposed a common European defence force, a European intelligence agency to fight terrorism, a European-wide asylum office and stronger EU border force.
On the data front
Swiss will release UBS consumption indicator in European session. Eurozone will release M3 while UK will release CBI realized sales. But main focus will be on durable goods orders from US. Pending home sales will also be featured.
AUD/USD Daily Outlook
Daily Pivots: (S1) 0.7848; (P) 0.7898; (R1) 0.7937; More...
AUD/USD drops to as low as 0.7856 so far and correction from 0.8124 extends. Overall, with 0.7807 support intact, larger rally is still expected to resume later. Above 0.7985 minor resistance will turn bias to the upside for retesting 0.8124 high first. Break will target 00% projection of 0.6826 to 0.7833 from 0.7328 at 0.8335 next. However, considering bearish divergence condition in daily MACD, firm break of 0.7807 will indicate near term reversal and turn bias back to the downside for 55 week EMA (now at 0.7670).
In the bigger picture, rise from 0.6826 medium term bottom is still in progress. At this point, there is no confirmation of trend reversal yet and we'll continue to treat such rebound as a corrective pattern. But in any case, break of 55 month EMA (now at 0.8090) will target 38.2% retracement of 1.1079 to 0.6826 at 0.8451. Break of 0.7807 support is needed to to be the first sign of completion of the rebound. Otherwise, further rise is now in favor.
Economic Indicators Update
| GMT | Ccy | Events | Actual | Forecast | Previous | Revised |
|---|---|---|---|---|---|---|
| 06:00 | CHF | UBS Consumption Indicator Aug | 1.38 | |||
| 08:00 | EUR | Eurozone M3 Y/Y Aug | 4.70% | 4.50% | ||
| 10:00 | GBP | CBI Realized Sales Sep | 8 | -10 | ||
| 12:30 | USD | Durable Goods Orders Aug P | 1.00% | -6.80% | ||
| 12:30 | USD | Durables Ex Transportation Aug P | 0.20% | 0.60% | ||
| 14:00 | USD | Pending Home Sales M/M Aug | -0.50% | -0.80% | ||
| 14:30 | USD | Crude Oil Inventories | 4.6M | |||
| 20:00 | NZD | RBNZ Rate Decision | 1.75% | 1.75% |
Daily Technical Outlook And Review: EUR/USD, GBP/USD, AUD/USD, USD/JPY, USD/CAD, USD/CHF, DOW 30, GOLD
A note on lower timeframe confirming price action...
Waiting for lower timeframe confirmation is our main tool to confirm strength within higher timeframe zones, and has really been the key to our trading success. It takes a little time to understand the subtle nuances, however, as each trade is never the same, but once you master the rhythm so to speak, you will be saved from countless unnecessary losing trades. The following is a list of what we look for:
- A break/retest of supply or demand dependent on which way you're trading.
- A trendline break/retest.
- Buying/selling tails ... essentially we look for a cluster of very obvious spikes off of lower timeframe support and resistance levels within the higher timeframe zone.
- Candlestick patterns. We tend to only stick with pin bars and engulfing bars as these have proven to be the most effective.
We typically search for lower-timeframe confirmation between the M15 and H1 timeframes, since most of our higher-timeframe areas begin with the H4. Stops are usually placed 1-3 pips beyond confirming structures.
EUR/USD
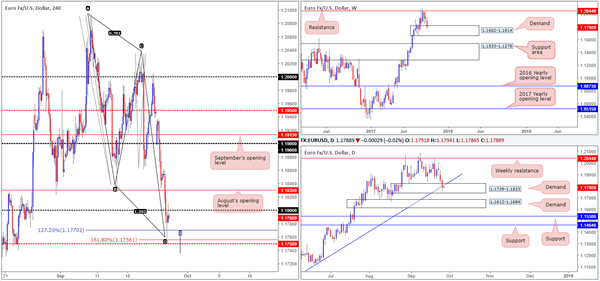
In recent trading, the single currency cruised south for a second consecutive session on Tuesday. Bids at August’s opening level (1.1830) and the 1.18 handle were wiped out, leaving H4 price free to challenge an AB=CD 127.2% ext. point at 1.1770 (taken from the high 1.2092)/161.8% ext. point at 1.1756 extended from the high 1.2034.
Further bolstering the aforementioned Harmonics is a H4 mid-level support at 1.1750, a minor weekly demand planted at 1.1662-1.1814, a daily demand at 1.1739-1.1823 and a trendline support taken from the low.
Suggestions: On account of this, the EUR boasts strong support at the moment which could lead to a rally north this week. H4 bulls have already made an appearance but seem troubled by the nearby 1.18 handle.
Although we are looking to buy this market, we’re wary of pulling the trigger given 1.18 resistance. To combat this, we would like to see price pullback from 1.18, fake below both yesterday’s low at 1.1757 and the 1.1750 line, and close higher (much like our bullish pin-bar drawing). A setup such as this would give us at least one times our risk to the 1.18 hurdle, thus allowing us to reduce risk to breakeven should the bulls fail to breach 1.18.
Data points to consider: US Core durable goods orders at 1.30pm; US New pending home sales at 3pm; FOMC member Brainard speaks at 7pm GMT+1.
Levels to watch/live orders:
- Buys: Watching for H4 price to whipsaw through 1.1750 before a long is considered (stop loss: beneath the candle’s tail).
- Sells: Flat (stop loss: N/A).
GBP/USD
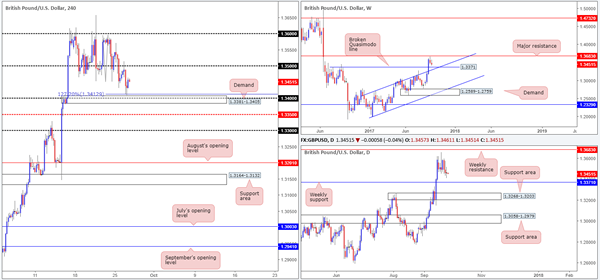
Offers at 1.35 held firm on Tuesday, consequently pushing the H4 candles down to a 127.2% ext. point at 1.3413 (extended from the high 1.3595) that is positioned just ahead of a demand pegged at 1.3381-1.3405/1.34 handle. Although the bulls have registered some interest from 1.3413, there’s still a strong possibility that this move may be a short-lived one, as weekly price looks poised to shake hands with a broken weekly Quasimodo line at 1.3371/channel resistance-turned support extended from the high 1.2706 (seen directly below the H4 demand). As such, if you are currently long from 1.3413, it may be a good idea to begin reducing risk to breakeven since the unit may be heading lower.
Suggestions: Wait for H4 price to fake through the current H4 demand and connect with the aforementioned weekly supports. This, in our opinion, is a high-probability buy since there are highly likely a truckload of stops planted beneath the current H4 demand which is exactly where we’ll be looking to buy!
Data points to consider: US Core durable goods orders at 1.30pm; US New pending home sales at 3pm; FOMC member Brainard speaks at 7pm GMT+1.
Levels to watch/live orders:
- Buys: Watching for H4 price to whipsaw through 1.3381-1.3405 to tap 1.3371 weekly support before a long is considered (stop loss: beneath the candle’s tail).
- Sells: Flat (stop loss: N/A).
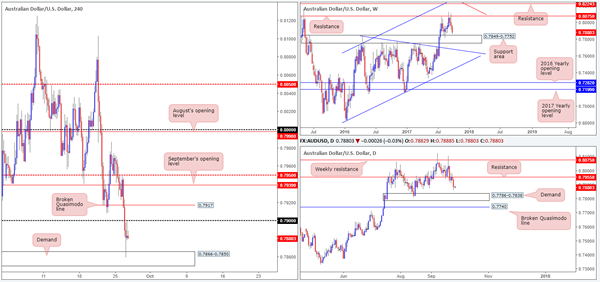
AUD/USD
Kicking this morning’s report off with a look at the weekly timeframe, we can clearly see that price is now within shouting distance of connecting with a support area marked at 0.7849-0.7752. Meanwhile, daily action shows the recently engulfed support at 0.7955 is holding ground as resistance. Provided that the bears continue to defend this line, daily demand at 0.7786-0.7838 is likely going to be the next port of call on this scale (seen plotted within the walls of the noted weekly support area).The story on the H4 timeframe, nevertheless, shows price responded beautifully to H4 demand pegged at 0.7866-0.7850 on Tuesday, but has failed to sustain this momentum beyond the nearby 0.79 handle.
Suggestions: Considering that both weekly and daily price show room to decline further, our team has absolutely no interest in buying from current price or the H4 demand base. The H4 Quasimodo support seen plotted below the current demand at 0.7839, however, is of interest (not seen on the screen). Not only does 0.7839 align nicely with the top edge of daily demand at 0.7838 and nearby the top edge of the weekly support area at 0.7849, we also have the benefit of all the juicy stop-loss orders planted below the current H4 demand. Remember, when a buyer’s stop is triggered it becomes a sell order, which is ideal liquidity to buy!
Given the above, we have set a pending buy order at 0.7839, with a stop placed below the apex of the Quasimodo formation (0.7807) at 0.7805. This equates to a 34-pip stop. As the first take-profit target does not come into view until 0.79, this allows the trader to nearly double his/her initial risk!
Data points to consider: US Core durable goods orders at 1.30pm; US New pending home sales at 3pm; FOMC member Brainard speaks at 7pm GMT+1.
Levels to watch/live orders:
- Buys: 0.7839 (stop loss: 0.7805).
- Sells: Flat (stop loss: N/A).
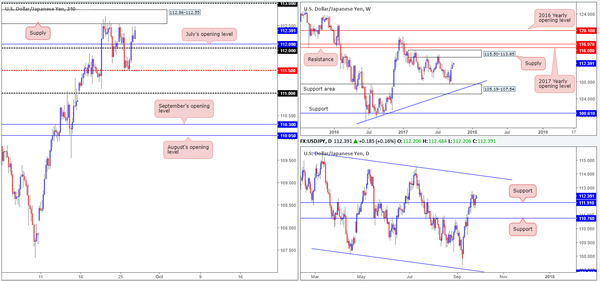
USD/JPY
Higher-timeframe direction currently shows weekly price heading for a supply zone coming in at 115.50-113.85. In conjunction with weekly flow, daily action is also seen holding ground at support drawn from 111.91. Should price continue to push higher from here, the next upside target is seen at a channel resistance extended from the high 115.50, which happens to intersect with the noted weekly supply.
Across on the H4 timeframe, price recently climbed above the 112 handle/nearby July’s opening level at 112.09, and now looks poised to challenge supply at 112.86-112.55. According to H4 structure, entering long is a tricky beast right now. Not only is there the current H4 supply to contend with, there’s also the 113 handle plotted just above this area and another nearby supply seen at 113.57-113.38.
Suggestions: In light of nearby H4 resistances, our team has no interest in buying this market today, despite what the higher-timeframe charts suggest.
Data points to consider: US Core durable goods orders at 1.30pm; US New pending home sales at 3pm; FOMC member Brainard speaks at 7pm GMT+1.
Levels to watch/live orders:
- Buys: Flat (stop loss: N/A).
- Sells: Flat (stop loss: N/A).
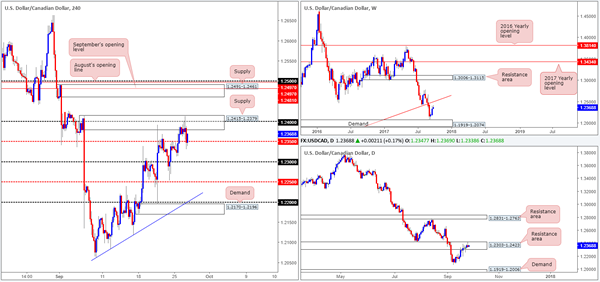
USD/CAD
During the course of Tuesday’s sessions, H4 price drove higher into supply at 1.2415-1.2379 and filled offers at 1.24. As can be seen on the chart, the pair was unable to sustain gains beyond 1.24 and ended the day pushing down to the mid-level support 1.2350. As we mentioned in yesterday’s report, both of these H4 barriers are sited within a daily resistance area pegged at 1.2303-1.2423. What we also mentioned, however, is that weekly price shows room to extend above the daily area to a long-term weekly trendline resistance extended from the low 0.9633.
Suggestions: Given the threat of further upside on the weekly scale, the team remains reluctant to sell at current prices. An area we would be interested in selling, nonetheless, is the H4 supply seen at 1.2491-1.2461. Not only is it surrounded by both September/August’s opening levels at 1.2497/1.2481 and the 1.25 handle, it also intersects nicely with the noted weekly trendline resistance.
As H4 price could potentially fake above 1.2491-1.2461 to attack offers at 1.25, we would advise waiting for a reasonably sized H4 bear candle to take shape from here (preferably a full, or near-full-bodied candle), before pulling the trigger.
Data points to consider: US Core durable goods orders at 1.30pm; US New pending home sales at 3pm; FOMC member Brainard speaks at 7pm GMT+1.
Levels to watch/live orders:
- Buys: Flat (stop loss: N/A).
- Sells: 1.2491-1.2461 area ([waiting for a reasonably sized H4 bearish candle to form – preferably a full, or near-full-bodied candle – is advised] stop loss: ideally beyond the candle’s wick).
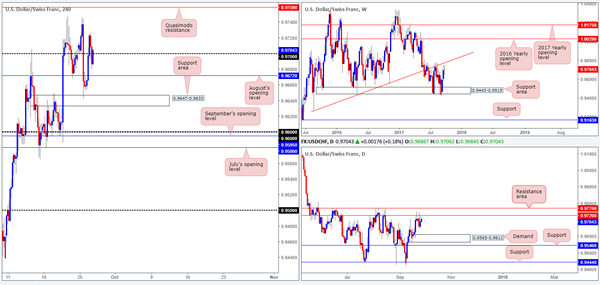
USD/CHF
The bounce from the H4 support area at 0.9647-0.9633 forced H4 price above both August’s opening level at 0.9672 and the 0.97 handle. This has, as far as we can see, potentially opened up the path north to a H4 Quasimodo resistance level pegged at 0.9759.
Scanning the weekly timeframe, however, shows that the unit is seen closing in on the trendline resistance extended from the low 0.9257. Alongside this, we can also see that daily price is currently trading from a resistance area pegged at 0.9770/0.9726 and shows room to decline down to at least demand located at 0.9565-0.9611.
Suggestions: Instead of trying to long the market above 0.97 when the unit is trading nearby weekly/daily structures, you could simply wait and see if price challenges the noted H4 Quasimodo resistance and look to sell. Positioned within the upper limits of the noted daily resistance area and intersecting with a weekly trendline resistance, this H4 level is, in our opinion, enough to warrant a sell without the need for additional confirmation.
Data points to consider: US Core durable goods orders at 1.30pm; US New pending home sales at 3pm; FOMC member Brainard speaks at 7pm GMT+1.
Levels to watch/live orders:
- Buys: Flat (stop loss: N/A).
- Sells: 0.9759 area (stop loss: 0.9776).
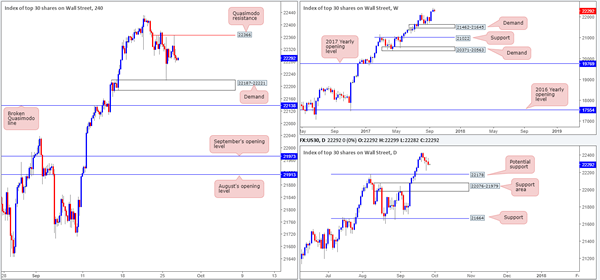
DOW 30
US equities printed a fourth consecutive bearish close on Tuesday, down from a record high of 22431. According to daily structure, the unit could continue pushing lower until we reach potential support marked at 22178. Up on the weekly timeframe, nevertheless, we can see that price could possibly pullback as far as the demand area at 21462-21645.
As can be seen on the H4 chart this morning, intraday movement came within a few points of tapping the minor Quasimodo resistance level at 22366, before collapsing lower. Assuming that the bears remain in the driving seat for a fifth consecutive session, this could lead to the H4 candles retesting demand seen at 22187-22221, or even the broken Quasimodo line seen just below it at 22138.
Suggestions: The key thing to remember here is this market remains entrenched within a strong uptrend, and is trading from record highs as we write. Therefore, a decisive H4 push above the aforesaid H4 Quasimodo resistance would, in our opinion, be a strong indication that the bulls are ready to press to fresh record highs. And this is something we want to be a part of! Therefore, what we’re looking for is a H4 close beyond 22366, followed by a retest and a reasonably strong H4 bull candle in the shape of a full, or near-full-bodied candle.
Data points to consider: US Core durable goods orders at 1.30pm; US New pending home sales at 3pm; FOMC member Brainard speaks at 7pm GMT+1.
Levels to watch/live orders:
- Buys: Watch for H4 price to close beyond 22366 and then look to trade any retest seen thereafter ([waiting for a H4 bullish rotation candle to form following the retest is advised] stop loss: ideally beyond the candle’s tail).
- Sells: Flat (stop loss: N/A).
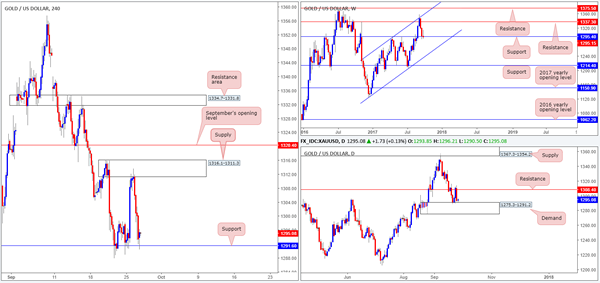
GOLD
Across the board, the US dollar rallied higher on Tuesday, thereby forcing the price of gold lower from H4 supply coming in at 1316.1-1311.3. Yesterday’s aggressive selloff, as you can see, brought the yellow metal down to a H4 support at 1291.6, which also denotes the top edge of a daily demand area penciled in at 1275.3-1291.2. Also noteworthy is weekly price remains trading around support drawn from 1295.4.
With the USDX H4 candles now trading from resistance at 11907, and daily price closing in on supply at 11969-11938, we believe that there’s a firm chance gold could rotate from the current H4 support/daily demand area today.
Suggestions: One could, given the above notes, look for long opportunities at the current H4 support. In the event that price remains bid from here, we would be looking to trail the position back up to the daily resistance at 1308.4, followed closely by the aforementioned H4 supply and September’s opening level at 1320.4.
Levels to watch/live orders:
- Buys: Possible long opportunities from H4 support at 1291.6 (stop loss: ideally below 21/09 low 1287.8).
- Sells: Flat (stop loss: N/A).
Market Morning Briefing: As It Turns Out, The Dollar Index Is Trading Above 93
STOCKS
Dow (22284.32, -0.05%) looks bearish towards 22200-22100 levels and could soon test these levels. While below 22400, near term looks bearish.
Dax (12605.20, +0.08%) is stuck below the 12675 level and could trade sideways for a few more sessions. A test of 12500 or lower is possible going forward.
Nikkei (20270.97, -0.29%) could come off towards 20100 in the near term. The stability in Dollar Yen is holding the index from falling sharply just now but in the medium term, the index looks bearish.
Shanghai (3344.67, +0.03%) is almost stable near previous levels and could trade sideways for a few sessions before deciding on further direction. Equal possibilities of either a rise towards 3360 or a fall towards 3300 exists.
Nifty (9871.50, -0.01%) could have possibly formed a double top and if the pattern turns out to be valid, there is more room on the downside for Nifty in the coming sessions. A break below 9800 would confirm its extension towards 9700-9600 in the coming sessions.
COMMODITIES
Precious metals may show some weakness in the near term. Crude prices are mixed, little room on the upside but could come off thereafter. Copper looks weak too for the coming sessions.
Brent (58.63) has some more room on the upside and looks bullish while WTI (52.12) is testing weekly resistance just above current levels. Brent could possibly move up towards 60-62 levels while WTI may come off in the coming sessions.
Brent-WTI spread (6.55) is down from previous levels of 7.15 but the spread could be headed towards 8 in the near term.
Gold (1295.22) came off sharply from 1313 yesterday and closed at levels below 1300. This was contrary to our expectation of testing 1320.Note that 1285-1290 region is an immediate support and could push the index to levels above 1300 again. But while the US Dollar Index (93.05) gains towards 94, Weakness in Gold could persist.
Silver (16.85) has some chances of testing 16.50 in the coming sessions. Overall near term trade could be seen below 17.00-17.20 levels.
Copper (2.9230) could trade below 2.95/98 in the coming sessions and the 3-day and the weekly charts indicate some potential fall towards 2.85-2.80 in the medium term. Our view is bearish for the near to medium term.
FOREX
As it turns out, the Dollar Index (93.05) is trading above 93, a level we thought would not break easily. A high of 93.29 was seen yesterday and a further rise to 93.50-94.00 is now possible. The Euro (1.1790) too has broken below 1.1800 and can see further decline towards 1.1750-10, as warned yesterday. The time frame could extend to next week.
Dollar-Yen (112.38) saw a good bounce yesterday on overall Dollar strength, suggesting that the sideways range of 110.50-113.00 mentioned yesterday may have some merits. The Euro-Yen (132.50) has moved up alongwith Dollar-Yen but has important Resistance in the 133.00-50 region.
The mentioned Support at 1.3430-00 on the Pound (1.3436) has held on first testing yesterday, but could be vulnerable to a break. If that happens, a fall to 1.3315-3265 will come into the picture.
The Aussie (0.7872) has disappointed a bit by being unable to hold above the support at 0.7900 mentioned yesterday. This brings up chances of further decline to 0.7750 now.
Dollar-Yuan (USDCNY = 6.6346) continues to rise. targeting 6.65. Dollar-Rupee (65.45) may face Resistance in the 65.50-60-75 region today.
INTEREST RATES
Contributing to the Euro (1.1790) weakness, the German-US 2Yr Spread (-2.18%) has broken below -2.13% and may dip some more towards -2.23%.
The UK-US 10Yr Spread (-0.91%) looks consolidative near current levels and seems to suggest chances of further rise towards -0.85%. This does not go well with expectations of Pound weakness (see Forex section above). So we need to watch this for a while.
US Yields (5Yr 1.86%, 10Yr 2.24%, 30Yr 2.78%) have seen an uptick in the wake of Yellen's speech last night, but face important Resistances near/ just above current levels. Need to watch whether these will hold or break.
The Indian 10Yr GOI (6.6689%) should have Resistance at 6.70% in the near term.