
Sample Category Title
US Dollar Up After Trump Tax Plan, Canadian Dollar Lower After Poloz Speech
Trump Tax Plan Faces Criticism, Dollar Pares Gains. The dollar rose for a third day, though it failed to hold an advance to the highest level in a month as President Trump's tax plan faced resistance. Details of Trump's tax proposal trickled out Wednesday, drawing immediate criticism from some lawmakers and reminding investors of the obstacles the plan faces. The greenback also benefited from weakness in the Canadian dollar, which dropped after the head of the Bank of Canada warned the central bank wasn't on a preset rate path. The dollar's index last traded at 93.414 after reaching a high of 93.607 on Wednesday, its strongest level since Aug.
The Euro Held Steady After Falling to Its More Than 1-Mth Low. The euro has fallen heavily against the US dollar over the past week, undermined by political uncertainty in Germany and renewed optimism that the US Federal Reserve will hike interest rates again before the year is out. European currency earlier approached 1.1700, falling to its lowest in about 5 weeks.
Canadian Weakens on BoC Caution. The Canadian dollar was trading near the session high of 1.2464, its highest level in almost four weeks, after BoC Governor Poloz said there is no “predetermined path for interest rates” and that the central bank will proceed “cautiously” as it assesses the performance of the economy. His speech — the first since the bank's second consecutive rate increase — damped expectations for a third hike.
Havens Tick Up Fueled by Poloz Speech. The yen and Swiss franc modestly rebounded fueled by unwinds of Canadian dollar cross trades after Poloz spoke. The yen was trading around 112.76 as it rebounded from a session high of 113.26. Swiss franc dropped to 0.9694 after reaching its highest of 0.9768.
The NZ Dollar Held Steady at $0.7228. New Zealand's central bank on Thursday kept interest rates unchanged at record lows of 1.75 per cent and firmly stuck to its neutral stance, against a backdrop of political uncertainty after an inconclusive national election. The New Zealand dollar slipped briefly to levels below $0.7200 after the central bank statement but later regained its footing.
Gold Rises from 1-Mth Lows. Gold rose on Thursday after falling to one-month lows on expectations of a rise in U.S. interest rates this year. Spot gold rose 0.3 percent to $1,284.36 per ounce after it revisited the previous session's low of $1,280.72 an ounce, the lowest since Aug. 25.
Brent Slips from 2015 Peaks, U.S. Crude Up On Inventory Draw. Brent prices fell while U.S. crude rallied, after oil stockpiles in the world's top consumer unexpectedly drew down with refiners coming back online following Hurricane Harvey last month. Brent futures traded at $57.71 a barrel, down from
Tuesday's 26-month peak of $59.49. US West Texas Intermediate crude (WTI) fetched $52.11 per barrel, just below Tuesday's five-month high of $52.43.
Watch Out Today for:
06:35 am GMT: JPY Bank of Japan Governor Kuroda Speech
08:15 am GMT: GBP BOE's Governor Carney speech
12:30 pm GMT: USD Core Personal Consumption Expenditures
13:30 pm GMT: USD Gross Domestic Product Annualized
EUR/USD Daily Outlook
Daily Pivots: (S1) 1.1708; (P) 1.1752 (R1) 1.1787; More...
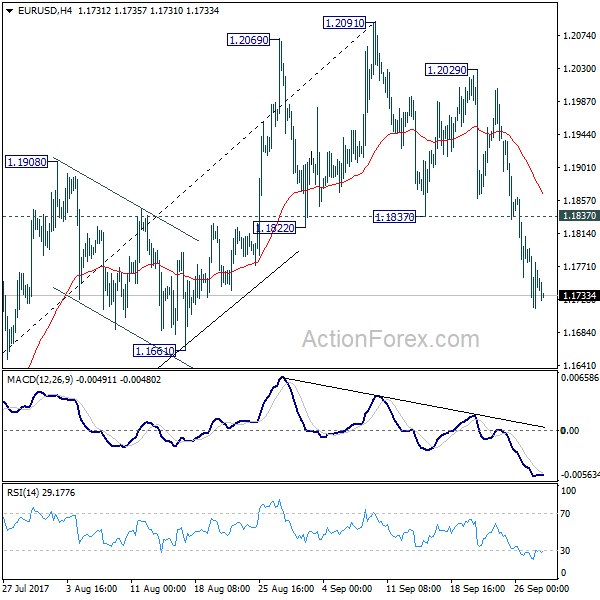
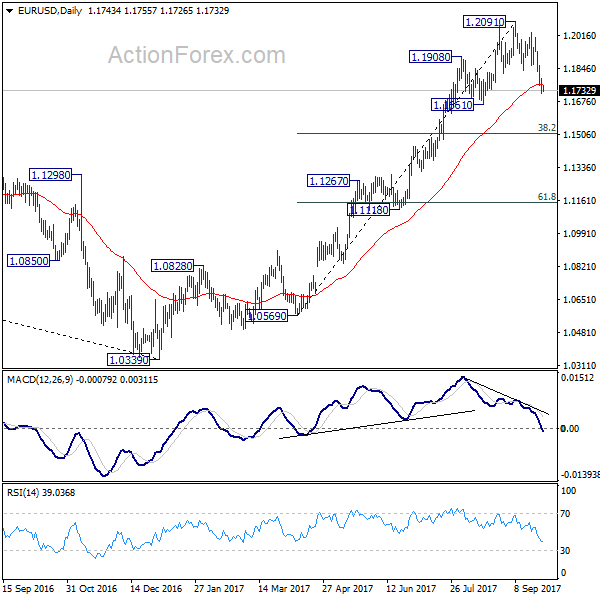
Intraday bias in EUR/USD remains on the downside as fall from 1.2091 is in progress. Deeper decline should be seen to 1.1661 support first. Such fall is correcting whole rise from 1.0569. Break of 1.1661 will target 38.2% retracement of 1.0569 to 1.2091 at 1.1510, where we're expecting support to bring rebound. On the upside, above 1.1837 minor resistance will turn intraday bias neutral first. But break of 1.2029 resistance is needed to confirm completion of the pull back. Otherwise, deeper fall will remain in favor as the correction develops.
In the bigger picture, rise from medium term bottom at 1.0339 is still in progress for 38.2% retracement of 1.6039 (2008 high) to 1.0339 (2017 low) at 1.2516. However, it should be noted that there is no confirmation of trend reversal yet. That is, such rebound from 1.0399 could be a correction. And the long term fall from 1.6039 (2008 high) could resume. Hence, we'd be cautious on strong resistance from 1.2516 to limit upside. But after all, break of 1.1661 is needed to indicate medium term topping. Otherwise, outlook will remain bullish in case of pull back.
Elliott Wave View: AUDJPY Correction Near Complete
AUDJPY Short Term Elliott Wave view suggests that the rally to 90.31 ended Intermediate wave (W). Intermediate wave (X) pullback remains in progress as a double three Elliott Wave structure. Down from 90.31, Minor wave W ended at 88.44 and Minor wave X ended at 89.68. Minor wave Y is unfolding also as a double three Elliott Wave structure. Minute wave ((w)) of Y ended at 88.23 and Minute wave ((x)) of Y is proposed complete at 88.89. Near term, while bounces stay below 9/21 peak at 90.31, expect pair to extend lower towards 87.36 – 87.8 area to complete Intermediate wave (X). Afterwards, pair should resume the rally to a new high or at least bounce in 3 waves. We don’t like selling the proposed pullback.
AUDJPY 1 Hour Elliottwave Chart
Double three ( 7 swings) is the most important pattern in Elliott wave’s new theory. It is also probably the most common pattern in the market these days. Double three is also known as a 7-swing structure. It is a very reliable pattern that gives traders a good opportunity to trade with a well-defined level of risk and target areas. The image below shows what Elliott Wave Double Three looks like. It has labels (W), (X), (Y) and an internal structure of 3-3-3. This means that all 3 legs has corrective sequences. Each (W) and (Y) is formed by 3 wave oscillations and has a structure of A, B, C or W, X, Y of smaller degrees.
GBP/USD Daily Outlook
Daily Pivots: (S1) 1.3347; (P) 1.3403; (R1) 1.3444; More....
GBP/USD's correction from 1.3651 is still in progress and intraday bias remains neutral. We'd continue to expect strong support from 38.2% retracement of 1.2773 to 1.3651 at 1.3316 to contain downside and bring rally resumption. Break of 1.3651 will turn bias back to the upside for 1.3835 support turned resistance next. Break there will target 55 month EMA (now at 1.4405).
In the bigger picture, current development argues that the long term trend in GBP/USD has reversed. That is, a key bottom was formed back in 1.1946 on bullish convergence condition in monthly MACD. Current rise from 1.1946 will target 38.2% retracement of 2.1161 (2007 high) to 1.1946 (2016 low) at 1.5466 next. In any case, medium term outlook will now stay bull
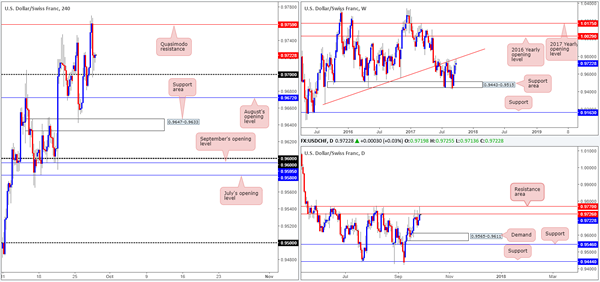
USD/CHF Daily Outlook
Daily Pivots: (S1) 0.9680; (P) 0.9724; (R1) 0.9767; More....
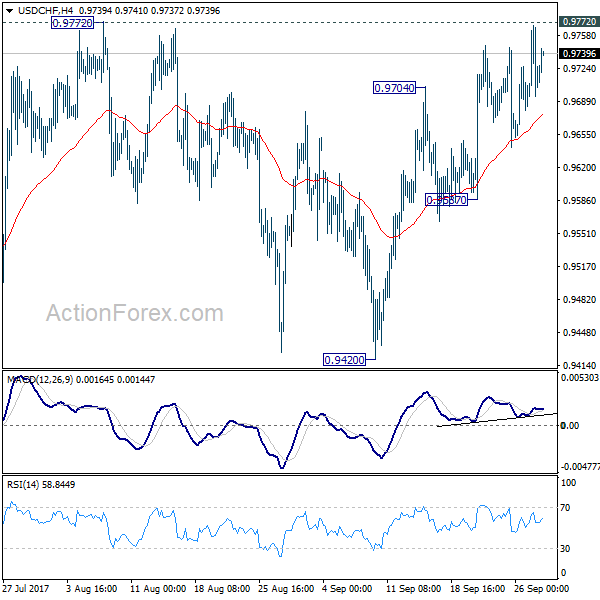
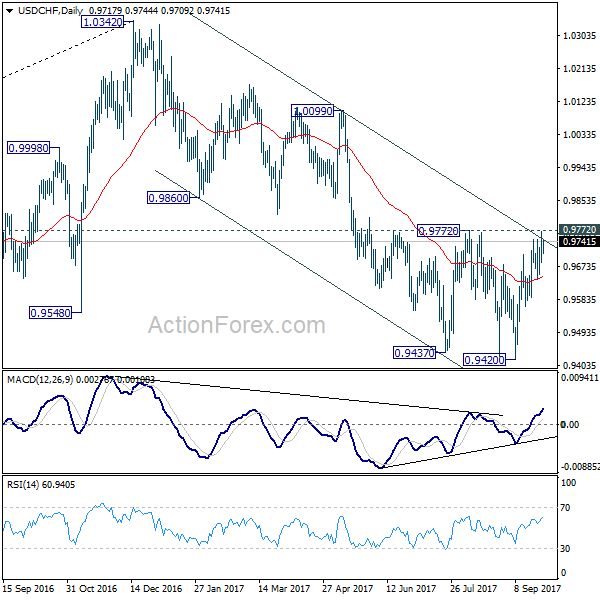
Focus remains on 0.9772 key resistance. Decisive break there will suggest that whole down trend form 1.0342 has completed. In that case, near term outlook will be turned bullish for 0.9860/1.0099 resistance zone. Nonetheless, with 0.9772 resistance intact, outlook remains bearish. Below 0.9587 minor support will turn bias back to the downside for retesting 0.9420 low.
In the bigger picture, focus remains on whether 0.9443 key support (2016 low) could be taken out firmly as down trend from 1.0342 extends. There are various interpretation of the price actions. But in any case, medium term outlook will stay bearish as long as 0.9772 resistance holds. Current down trend could extend to 38.2% retracement of 0.7065 (2011 low) to 1.0342 (2016 high) at 0.9090. However, break of 0.9772 will indicate that USD/CHF has successfully defended 0.9443 again and turn outlook bullish for 1.0099 resistance.
Daily Wave Analysis: EUR/USD, GBP/USD Test Shallow Wave-4 Fibonacci Levels At 1.17 And 1.3350
Currency pair EUR/USD
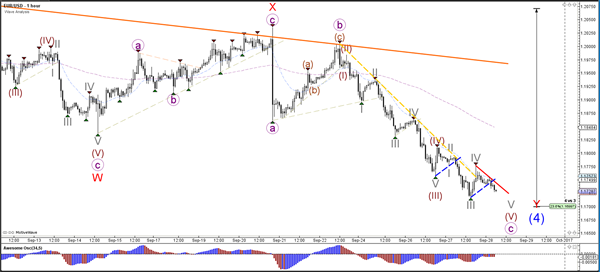
The EUR/USD bearish price action could be part of a potential wave 4 (blue) which makes the 23.6% Fibonacci level a potential support and bouncing spot.
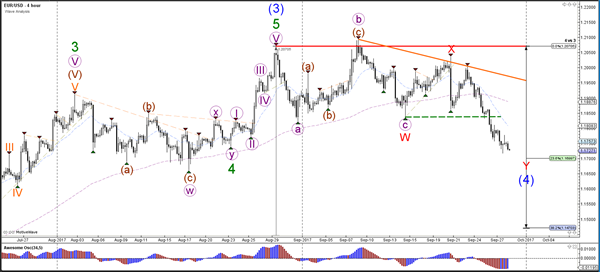
The EUR/USD seems to be making a final wave 5 (grey). Price might not complete the wave 4 (blue) at the 23.6% Fibonacci. A 38.2% Fibonacci level is also a common turning spot for a wave 4.
Currency pair GBP/USD
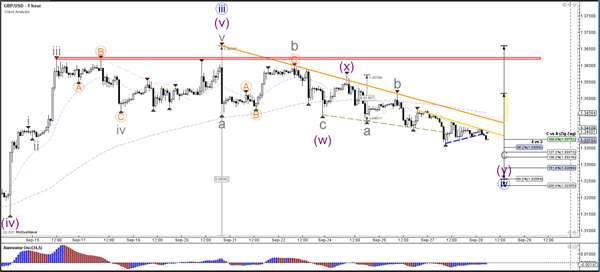
The GBP/USD could soon test the 38.2% Fibonacci level of the potential wave 4 (blue). The Fibonacci levels could act as potential support for a continuation of the uptrend via wave 5
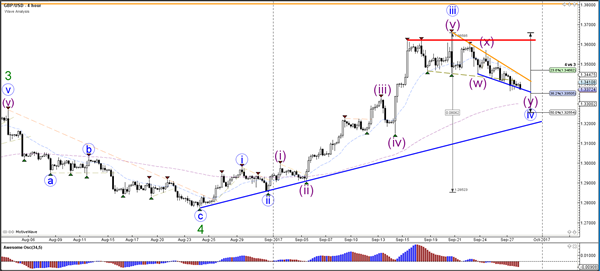
The GBP/USD is breaking support trend lines but the 38.2% Fib could be a potential support level. A break of resistance (orange/red) could indicate the continuation of the uptrend whereas a break below the 38.2% Fib could price test the 50% of wave 4 vs 3.
Currency pair USD/JPY
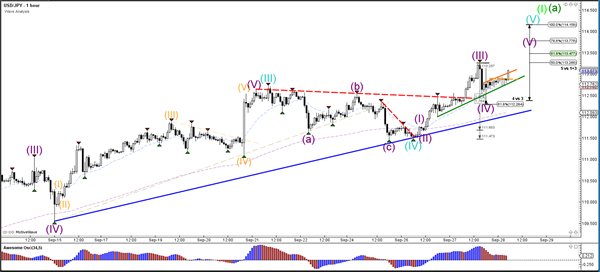
The USD/JPY has broken above the resistance trend line (dotted red) which is indicating an uptrend continuation.
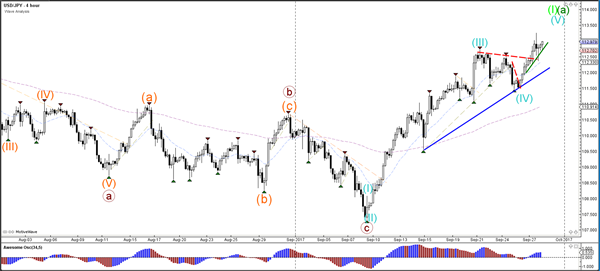
The USD/JPY break of resistance levels (dotted red) indicates a larger 5th wave (blue).
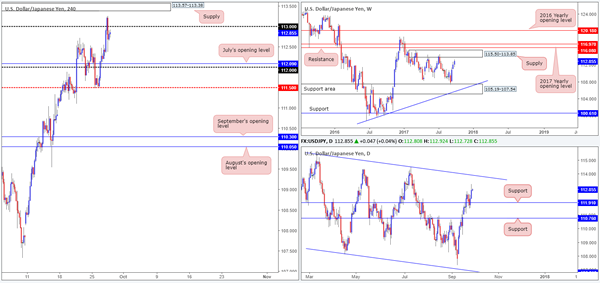
USD/JPY Daily Outlook
Daily Pivots: (S1) 112.25; (P) 112.75; (R1) 113.30; More...
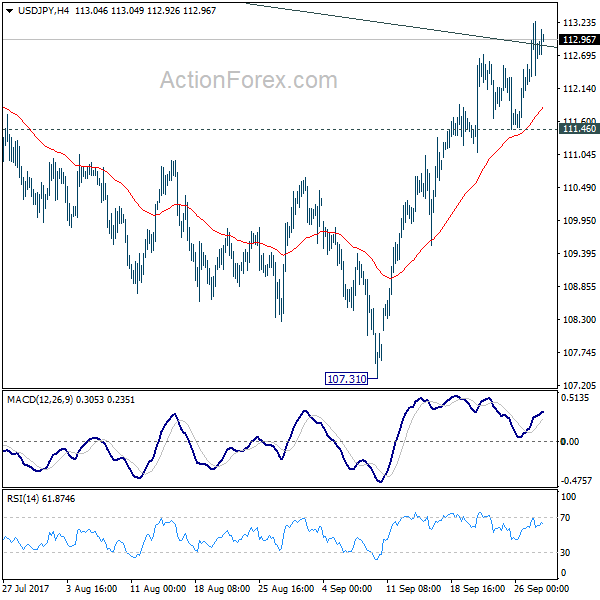
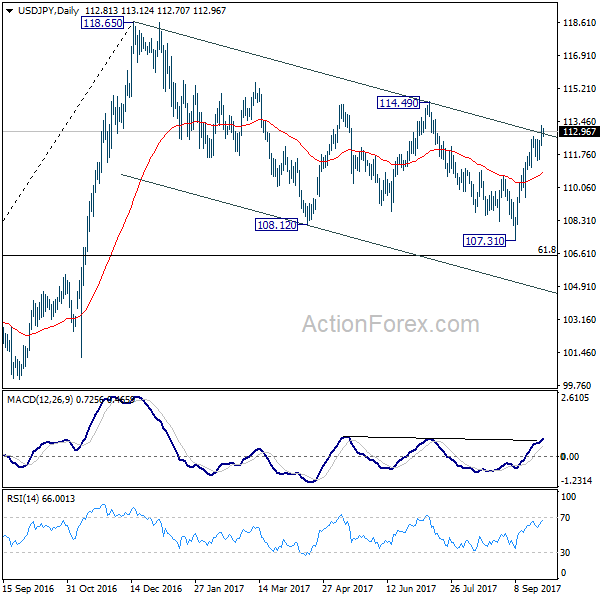
Intraday bias in USD/JPY remains on the upside as rise from 107.31 is in progress. Sustained break of medium term channel resistance argues that correction from 118.65 is already completed with three waves down to 107.31. Break of 114.49 will confirm this bullish case and target a test on 118.65 next. On the downside, break of 111.46 support is needed to indicate short term topping. Otherwise, near term outlook will remain cautiously bullish in case of retreat.
In the bigger picture, rise from 98.97 (2016 low) is seen as the second leg of the corrective pattern from 125.85 (2015 high). It's unclear whether this this second leg has completed at 118.65 or not. But medium term outlook will be mildly bearish as long as 114.49 resistance holds. And, there is prospect of breaking 98.97 ahead. Meanwhile, break of 114.49 will bring retest of 125.85 high. But even in that case, we don't expect a break there on first attempt.
Daily Technical Outlook And Review: EUR/USD, GBP/USD, AUD/USD, USD/JPY, USD/CAD, USD/CHF, DOW 30, GOLD
A note on lower timeframe confirming price action...
Waiting for lower timeframe confirmation is our main tool to confirm strength within higher timeframe zones, and has really been the key to our trading success. It takes a little time to understand the subtle nuances, however, as each trade is never the same, but once you master the rhythm so to speak, you will be saved from countless unnecessary losing trades. The following is a list of what we look for:
- A break/retest of supply or demand dependent on which way you're trading.
- A trendline break/retest.
- Buying/selling tails ... essentially we look for a cluster of very obvious spikes off of lower timeframe support and resistance levels within the higher timeframe zone.
- Candlestick patterns. We tend to only stick with pin bars and engulfing bars as these have proven to be the most effective.
We typically search for lower-timeframe confirmation between the M15 and H1 timeframes, since most of our higher-timeframe areas begin with the H4. Stops are usually placed 1-3 pips beyond confirming structures.
EUR/USD
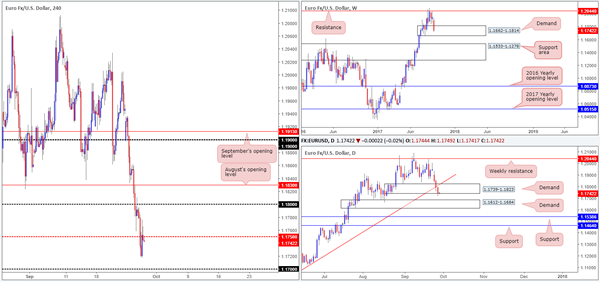
The single currency sustained further losses on Wednesday, consequently forcing price through the H4 mid-level support at 1.1750 and on to a session low of 1.1717. As of current price, the H4 candles have established resistance around the underside of 1.1750 and may look to approach the 1.17 handle today, followed closely by a Quasimodo support registered at 1.1681 (not seen on the screen).
Sweeping over to the weekly timeframe, we can see that recent selling has brought the unit deep into demand planted at 1.1662-1.1814. Meanwhile, down on the daily timeframe price concluded yesterday’s segment marginally breaching demand pegged at 1.1739-1.1823. By and of itself, this move has likely filled a truckload of stop-loss orders and potentially cleared the pathway south down to another demand penciled in at 1.1612-1.1684.
Suggestions: In view of the above notes, we have our eye on the H4 Quasimodo support level mentioned above at 1.1681 for longs today. Here’s why:
Stop-loss orders below the 1.17 handle will help provide liquidity for bigger traders to buy.
The H4 Quasimodo aligns beautifully with the top edge of oncoming daily demand at 1.1684.
The H4 level is also seen lurking within the lower limits of the aforesaid weekly demand.
The desk has a placed a pending buy order at 1.1681 with a stop positioned below the lower edge of the said weekly demand at 1.1660.
Data points to consider: German Prelim CPI m/m; Spanish Flash CPI y/y at 8am. US GDP q/q and US Unemployment claims at 1.30pm, followed by FOMC member Fischer speaking at 3.15pm GMT+1.
Levels to watch/live orders:
- Buys: 1.1681 ([pending order] stop loss: 1.1660).
- Sells: Flat (stop loss: N/A).
GBP/USD
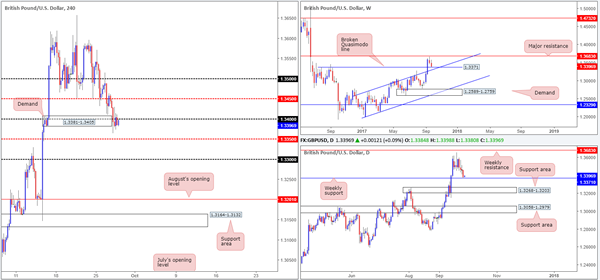
For those who read Wednesday’s report on the British pound you may recall our desk highlighting the possibility of a fakeout being seen through H4 demand at 1.3381-1.3405/1.34 handle. Our rationale behind this move was due to a weekly broken Quasimodo line seen lurking just below the noted demand at 1.3371/channel resistance-turned support extended from the high 1.2706. The stop-loss orders plotted below the current H4 demand, as far as we’re aware, will help provide liquidity for the bigger traders to get involved.
As you can see, on this occasion our analysis proved to be correct. With that said, the bulls are struggling to muster enough strength to break above 1.34 at the moment. Should 1.34 give way, which we believe it eventually will, we feel a strong push up to at least the H4 mid-level resistance at 1.3450/1.35 handle will be seen.
Suggestions: Wait for H4 price to close above 1.34. From this point, one could either buy at market (effectively buying the breakout), or conservatively wait to see if price retests 1.34 as support and buy with lower-timeframe confirmation (see the top of this report).
Data points to consider: BoE Gov. Carney speaks at 9.15am. US GDP q/q and US Unemployment claims at 1.30pm, followed by FOMC member Fischer speaking at 3.15pm GMT+1.
Levels to watch/live orders:
- Buys: A H4 close above 1.34 is, in our technical view, a strong indication that the unit wants 1.3450/1.35.
- Sells: Flat (stop loss: N/A).
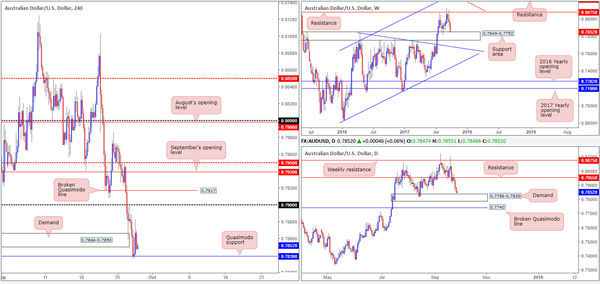
AUD/USD
In Wednesday’s analysis, our team’s focus was primarily on a potential fakeout being seen below H4 demand at 0.7866-0.7850 into a H4 Quasimodo support level at 0.7839. On this occasion, our analysis proved to be correct.
Not only did 0.7839 align nicely with the top edge of daily demand at 0.7838 and nearby the top edge of the weekly support area at 0.7849, there were also likely a huge amount of stop-loss orders planted below the current H4 demand. Remember, when a buyer’s stop is triggered it becomes a sell order, which is ideal liquidity to buy!
Our pending buy order at 0.7839 was filled and price rallied to a high of 0.7882. By this point, considering the stop-loss order was positioned at 0.7805, we had more than one times our risk in profits so we reduced risk to breakeven. And just as we did that, the unit began to turn red! Should we have taken partial profits when we had the chance? Maybe! However, our plan was, and still is, to wait for price to tap 0.79 before taking profits.
Suggestions: Despite price trading near our breakeven point, we still believe that this market is headed higher. Therefore, we’ll continue to hold our current position and see how price action unfolds going into London.
Data points to consider: RBA Assist Gov. Debelle speaks at 10am. US GDP q/q and US Unemployment claims at 1.30pm, followed by FOMC member Fischer speaking at 3.15pm GMT+1.
Levels to watch/live orders:
- Buys: 0.7839 ([live] stop loss: breakeven).
- Sells: Flat (stop loss: N/A).
USD/JPY
Sizing up the weekly timeframe this morning, we can clearly see price is currently heading for a supply zone coming in at 115.50-113.85. This area, as you can see, has held price lower on two previous occasions so there’s a fair chance that we may see history repeat itself here! In conjunction with weekly flow, daily action is also seen holding ground at support drawn from 111.91. Should price continue to push higher from here, the next upside target is seen at a channel resistance extended from the high 115.50, which happens to intersect with the noted weekly supply.
Across on the H4 timeframe, price strongly broke above the 113 handle going into the early hours of US trading on Wednesday. With the piece failing to generate much follow-through action above this number, the pair ended the day closing back below the 113 vicinity.
Suggestions: Neither a long nor short seems attractive at this time. A long at current price may be in-line with higher-timeframe direction, but given the 113 handle and nearby H4 supply at 113.57-113.38, we will pass. As for selling, we will not look to become sellers in this market until we see H4 price tap the 114 handle. At this point, price will be trading within the aforesaid weekly supply and also around the daily channel resistance.
Data points to consider: BoJ Gov. Kuroda speaks at 7.35am. US GDP q/q and US Unemployment claims at 1.30pm, followed by FOMC member Fischer speaking at 3.15pm GMT+1.
Levels to watch/live orders:
- Buys: Flat (stop loss: N/A).
- Sells: 114 region.
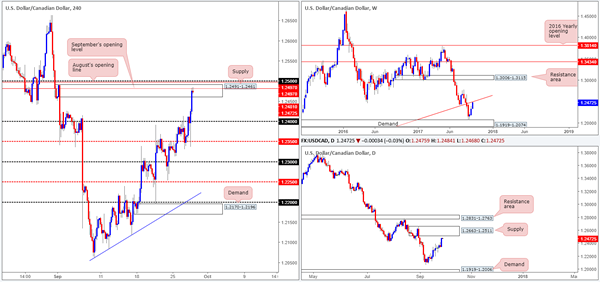
USD/CAD
The USD/CAD, as you can see, aggressively pushed to the upside on Wednesday following BoC’s Gov. Poloz’s comments regarding a cautious stance after raising rates twice this year. The impact saw the 1.24 handle taken out and H4 price drive into the walls of a supply zone at 1.2491-1.2461. Not only is this a nice-looking supply zone, it is also surrounded by both September/August’s opening levels at 1.2497/1.2481/the 1.25 handle and is positioned nearby a weekly trendline resistance extended from the low 0.9633/daily supply at 1.2663-1.2511.
Suggestions: Seeing as how H4 price could potentially fake above the current H4 structures to tap the higher-timeframe areas, the team is wary of shorting at market. In light of this, we would advise waiting for a reasonably sized H4 bear candle to take shape from here (preferably a full, or near-full-bodied candle), before pulling the trigger.
Data points to consider: US GDP q/q and US Unemployment claims at 1.30pm, followed by FOMC member Fischer speaking at 3.15pm GMT+1.
Levels to watch/live orders:
- Buys: Flat (stop loss: N/A).
- Sells: 1.2491-1.2461 area ([waiting for a reasonably sized H4 bearish candle to form – preferably a full, or near-full-bodied candle – is advised] stop loss: ideally beyond the candle’s wick).
USD/CHF
In Wednesday’s report, we stated that instead of looking to long the market above 0.97, a better approach might have been to wait and sell the H4 Quasimodo resistance line at 0.9759. Our rationale behind this approach stemmed from higher-timeframe structure. Weekly price, at the time, was trading within striking distance of a trendline resistance extended from the low 0.9257. Alongside this, we also saw that daily price was trading from a resistance area pegged at 0.9770/0.9726 and showed room to decline down to at least demand located at 0.9565-0.9611.
As you can see, price did exactly as expected. Well done to any of our readers who took shorts from 0.9759! Even if you closed out the full position at 0.97, you’d have netted good returns. Not bad for a few hours work!
Suggestions: Apart from our short call on Wednesday, we do not see much else to hang our hat on at the moment. A break below 0.97, although both the weekly and daily timeframes indicate further selling could be on the cards, is unfortunately a challenging sell. This is because of August’s opening level plotted just below at 0.9672, followed closely by a H4 support area at 0.9647-0.9633.
Data points to consider: US GDP q/q and US Unemployment claims at 1.30pm, followed by FOMC member Fischer speaking at 3.15pm GMT+1.
Levels to watch/live orders:
- Buys: Flat (stop loss: N/A).
- Sells: Flat (stop loss: N/A).
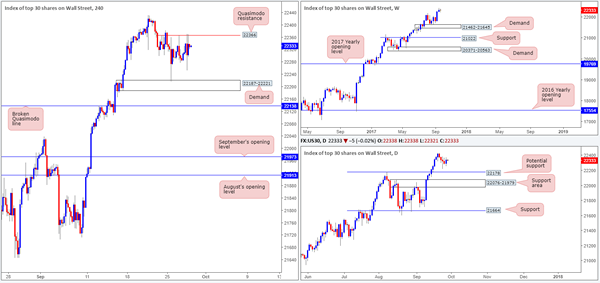
DOW 30
Despite the solid bounce seen from H4 demand at 22187-22221, the index is seen struggling to trade beyond the minor H4 Quasimodo resistance line at 22366. In spite of this, the technicals over on the daily timeframe printed a bullish engulfing candle yesterday which could, given the underlying trend, be a strong indication that US equities may be ready to push higher.
Suggestions: The key thing to remember here is this market remains entrenched within a strong uptrend, and is trading from record highs as we write. Therefore, a decisive H4 push above the aforesaid H4 Quasimodo resistance would, for us at least, be a cue to begin looking to buy. However, before pulling the trigger, a retest, followed by a reasonably strong H4 bull candle in the shape of a full or near-full-bodied candle, would need to be seen.
Data points to consider: US GDP q/q and US Unemployment claims at 1.30pm, followed by FOMC member Fischer speaking at 3.15pm GMT+1.
Levels to watch/live orders:
- Buys: Watch for H4 price to close beyond 22366 and then look to trade any retest seen thereafter ([waiting for a H4 bullish rotation candle to form following the retest is advised] stop loss: ideally beyond the candle’s tail).
- Sells: Flat (stop loss: N/A).
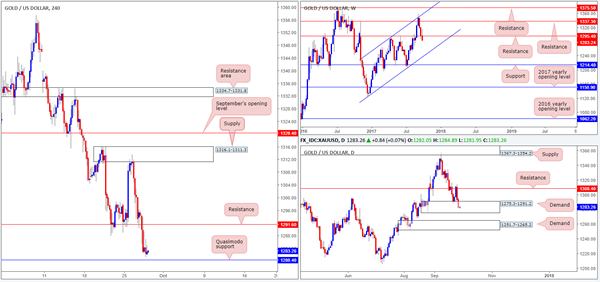
GOLD:
The yellow metal extended losses on Wednesday, forcing H4 price to consume bids around support at 1291.6 and clock a low of 1281.2 on the day. What this move also did was push weekly price further below resistance at 1295.4, further confirming downside to the channel support extended from the low 1282.1. Meanwhile, the daily candles, despite the recent downside move, remains within the walls of demand pegged at 1275.3-1291.2. A violation of this zone would likely lead to gold challenging demand plotted below at 1251.7-1265.2.
Suggestions: While weekly action indicates further selling may be upon us, it would just be too much of a risk shorting into both the current daily demand and nearby H4 Quasimodo support at 1280.4. Likewise, a long, although daily/H4 structure is in play, would be a chancy move as you’d effectively be buying into potential weekly flow!
Therefore, at least for the time being, the desk will remain flat.
Levels to watch/live orders:
- Buys: Flat (stop loss: N/A).
- Sells: Flat (stop loss: N/A).
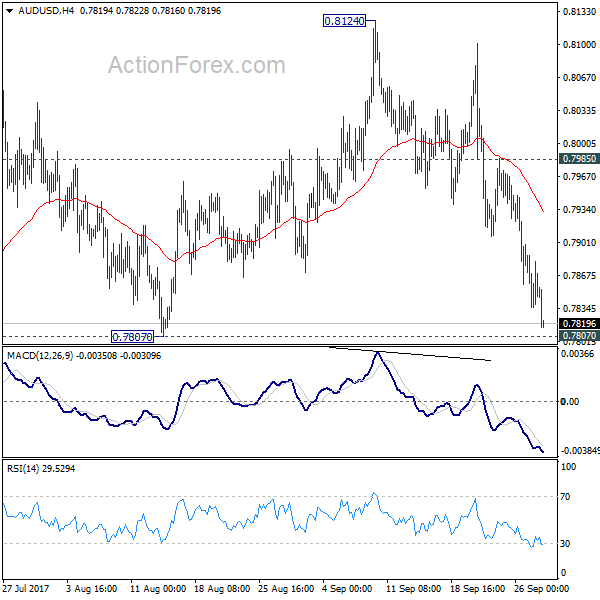
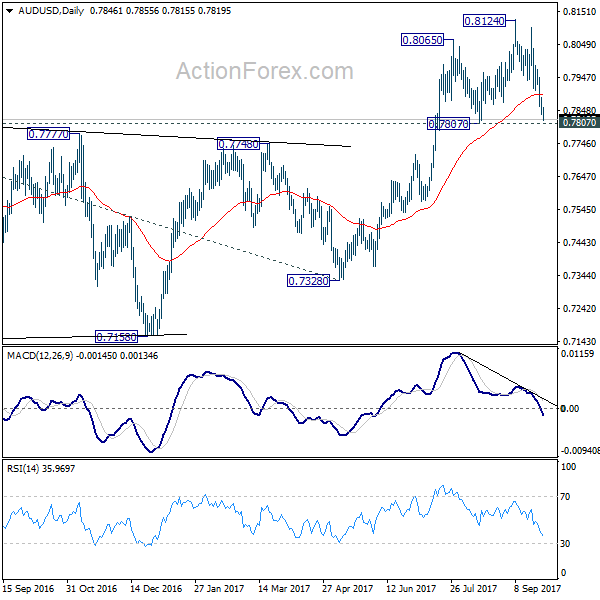
AUD/USD Daily Outlook
Daily Pivots: (S1) 0.7826; (P) 0.7857; (R1) 0.7879; More...
AUD/USD's fall from 0.8124 extended lower today and focus is now on 0.7807 key support level. Considering bearish divergence condition in daily MACD, firm break of 0.7807 will indicate near term reversal. Outlook will then be turned bearish for 55 week EMA (now at 0.7670) first. Meanwhile, rebound from 0.7807 will retain bullishness for another rise through 0.8124 high.
In the bigger picture, rise from 0.6826 medium term bottom is still in progress. At this point, there is no confirmation of trend reversal yet and we'll continue to treat such rebound as a corrective pattern. But in any case, break of 55 month EMA (now at 0.8090) will target 38.2% retracement of 1.1079 to 0.6826 at 0.8451. Break of 0.7807 support is needed to to be the first sign of completion of the rebound. Otherwise, further rise is now in favor.
European Open Briefing: Asian Equities Were Mixed Early On Thursday
Global Markets:
- Asian stock markets: Nikkei rose 0.48 %, Shanghai Composite down 0.09 %, Hang Seng lost 0.39 %, ASX 200 rose 0.21 %
- Commodities: Gold at $1284.00 (-0.29 %), Silver at $16.77 (-0.32 %), WTI Oil at $51.98 (-0.31 %), Brent Oil at $57.34 (-0.40 %)
- Rates: US 10-year yield at 2.34, UK 10-year yield at 1.37, German 10-year yield at 0.46
News & Data:
- (NZD) Official Cash Rate 1.75 % vs 1.75 % expected
- (EUR) M3 Money Supply y/y 5.0 vs 4.6 % expected
- (USD) Core Durable Goods Orders m/m 0.2 % vs 0.2 % expected
- (USD) Durable Goods Orders m/m 1.7 % vs 1.0 % expected
- (USD) Pending Home Sales m/m -2.6 % vs -0.5 % expected
- (USD) Crude Oil Inventories -1.8 M vs 2.9 M expected
- Trump proposes U.S. tax overhaul, stirs concerns on deficit- RTRS
Markets Update:
Asian equities were mixed early on Thursday as investors began to assess the implications of the much-anticipated tax proposal. The dollar and U.S. bond yields rose after President Donald Trump proposed the biggest U.S. tax overhaul in three decades and as strong U.S. economic data added to the case for a rate hike by the Federal Reserve later this year.
USDJPY is currently seen trading around 113.07, the pair was seen ranging within a 20 pip range for most of the session earlier today with little to drive it. Japanese parliament was officially dissolved today to bring on the October 22 election. Overall the Yen continues to drop against the USD, down 0.2 percent on Thursday, continuing its 0.5 percent fall on Wednesday.
EURUSD continued to decline for the third straight day after hitting a six-week low of $1.1717 on Wednesday and is currently seen trading around 1.1733 as there were some signs of further USD strength. The dollar index, which tracks the dollar against a basket of currencies rose 0.2 percent and is currently valued at 93.57 touching the highest in a month.
AUDUSD is currently seen trading at 0.7818, as the Aussie further declined 0.4 percent against the US Dollar. Likewise, the NZDUSD is seen trading at 0.7192 as the Kiwi lost 0.2 percent against the US Dollar. The kiwi fluctuated as the Reserve Bank of New Zealand signaled it will keep rates on hold for some time on a weaker economic growth outlook and slowing inflation.
Upcoming Events:
- All Day – (EUR) German Prelim CPI m/m
- 06:35 GMT – (JPY) BOJ Gov Kuroda Speaks
- 07:00 GMT – (EUR) Spanish Flash CPI y/y
- 08:15 GMT – (GBP) BOE Gov Carney Speaks
- 09:00 GMT – (AUD) RBA Assist Gov Debelle Speaks
- 12:30 GMT – (USD) Final GDP q/q
- 12:30 GMT – (USD) Unemployment Claims
- 14:15 GMT – (USD) FOMC Member Fischer Speaks