Sample Category Title
Forex Technical Analysis: EUR/USD, USD/JPY, GBP/USD
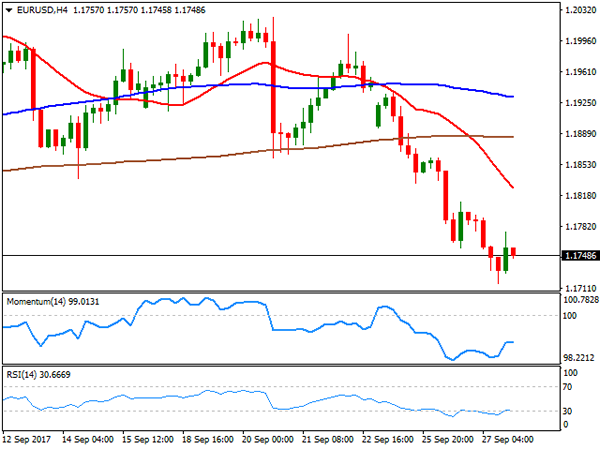
EUR/USD
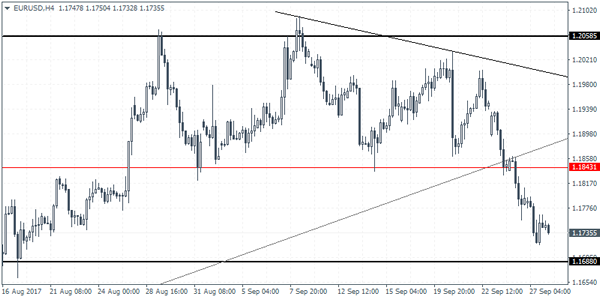
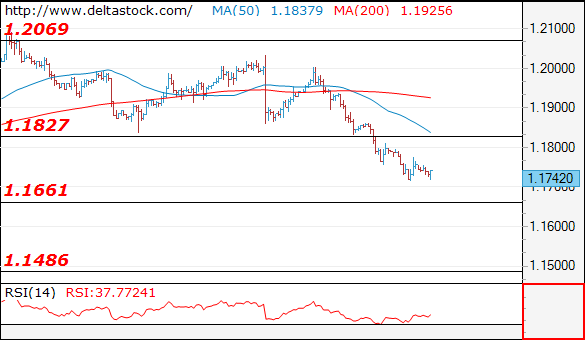
Current level - 1.1742
The outlook is bearish after the recent break through 1.1830 static support, for a test of 1.1660 area. A violation of the latter will extend the losses towards 1.1480. Key resistance lies at 1.1830.
| Resistance | Support | ||
| intraday | intraweek | intraday | intraweek |
| 1.1830 | 1.2070 | 1.1660 | 1.1660 |
| 1.2000 | 1.2240 | 1.1540 | 1.1480 |
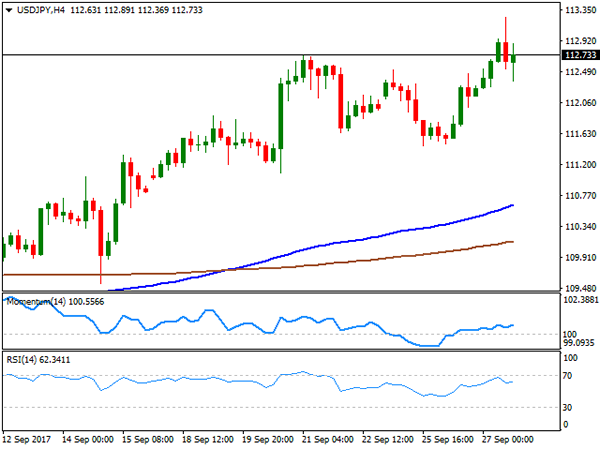
USD/JPY
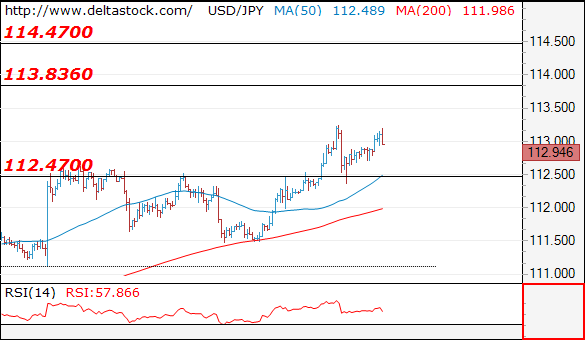
Current level - 112.94
The bias is positive above 112.45 support, for a rise towards 113.80, en route to 114.50 peak. Crucial on the downside is 111.50
| Resistance | Support | ||
| intraday | intraweek | intraday | intraweek |
| 113.30 | 113.80 | 112.45 | 111.50 |
| 113.80 | 114.50 | 111.50 | 107.30 |
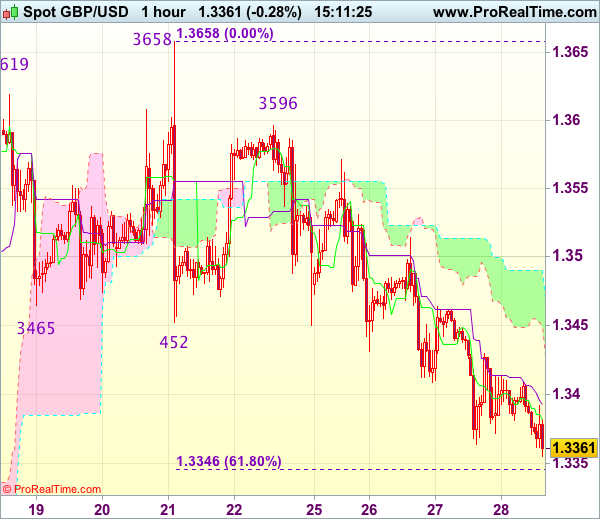
GBP/USD
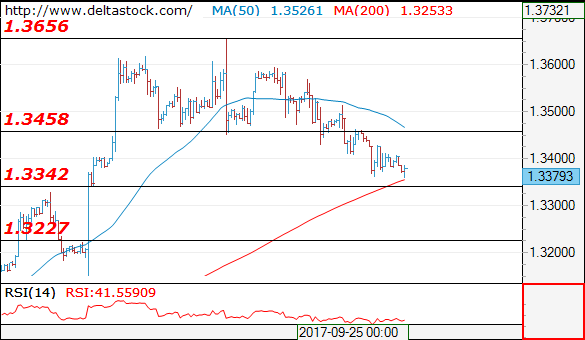
Current level - 1.3379
The bias is negative and a break through 1.3340 static support will challenge 1.3220 area. Crucial resistance lies at 1.3460.
| Resistance | Support | ||
| intraday | intraweek | intraday | intraweek |
| 1.3460 | 1.3650 | 1.3340 | 1.3340 |
| 1.3650 | 1.3830 | 1.3220 | 1.3150 |
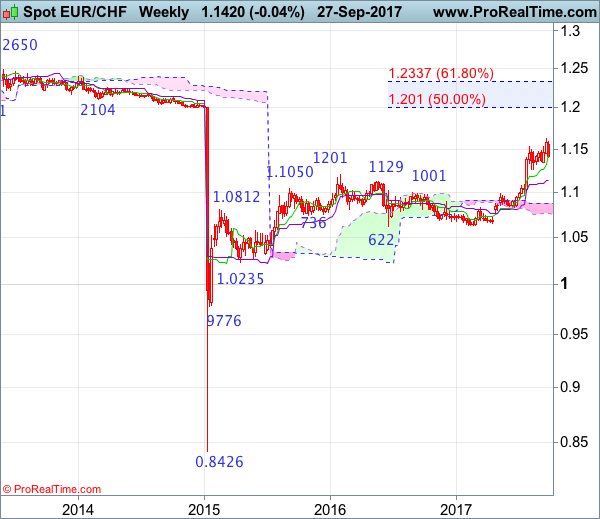
EUR/CHF Candlesticks and Ichimoku Analysis
Weekly
• Last Candlesticks pattern: Long white candlestick
• Time of formation: 24 Jul 2017
• Trend bias: Up
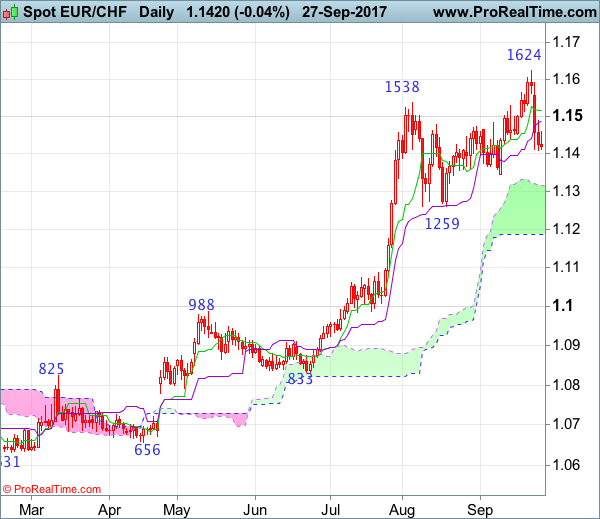
Daily
• Last Candlesticks pattern: Morning doji
• Time of formation: 25 Jul 2017
• Trend bias: Up
EUR/CHF – 1.1450
Although the single currency rose to as high as 1.1624 late last week, the subsequent retreat suggests a temporary top is possibly formed there and consolidation with mild downside bias is seen for test of previous support at 1.1345 but break there is needed to add credence to this view, bring retracement of recent rise to the upper Kumo (now at 1.1316), then towards previous support at 1.1259 which is likely to hold on first testing.
On the upside, whilst recovery to the Kijun-Sen (now at 1.1485) cannot be ruled out, reckon the Tenkan-Sen (now at 1.1516) would limit upside and bring another decline later. Above 1.1590-95 would bring retest of said last week’s high at 1.1624 but only break there would abort and revive bullishness, then recent upmove shall extend gain towards 1.1695-00 (61.8% projection of 1.0833-1.1538 measuring from 1.1260), however, loss of upward momentum should prevent sharp move beyond 1.1770-80 and reckon 1.1800-10 would hold from here, risk from there is seen for a retreat to take place later.
Recommendation: Exit long entered at 1.1475 and sell at 1.1520 for 1.1320 with stop above 1.1620.
On the weekly chart, although euro rose briefly to 1.1624 late last week, the single currency opened lower this week and has retreated, a black candlestick looks set to be formed this week, suggesting a temporary top has possibly been formed at 1.1624, hence consolidation with mild downside bias is seen for weakness to 1.1390-00 but break of support at 1.1345 is needed to add credence to this view, bring subsequent fall to 1.1259 support, break there would provide confirmation, bring retracement of recent rise towards the Kijun-Sen (now at 1.1140) which is likely to hold from here.
On the upside, expect recovery to be limited to 1.1515-20 and price should falter below this week’s high at 1.1591, bring another retreat later. Only break of said last week’s high at 1.1624 would signal the major rise from 0.8426 low has once again resumed and extend headway to 1.1695-00 (61.8% projection of 1.0833-1.1538 measuring from 1.1260), then towards 1.1760-70 but overbought condition should prevent sharp move beyond 1.1840-50 and reckon 1.1900-10 would hold from here, risk from there has increased for a retreat to take place later.
Foreign Exchange Market Commentary: EUR/USD, USD/JPY, GBP/USD, GOLD, WTI CRUDE, DJIA, FTSE100, DAX
EUR/USD
EUR/USD's decline continued this Wednesday, with the pair falling down to 1.1716 during US trading hours, to recover partially later, on the back of mixed US data. According to official releases, Durable Goods Orders bounced from July's slump, up in August by 1.7% against market's expectations of 1.0%, and indicating an acceleration in orders for business equipment at the beginning of the third quarter. Pending home sales, however, fell sharply in the same month with the headline index down 2.6%, and for the fifth time in six months, as slower activity in the areas hit by hurricanes will likely pull existing sales for the year below the pace set in 2016, according to the National Association of Realtors.
The dollar maintained the strong footing set at the beginning of the week, after US Yellen said on Tuesday that, while a gradual approach to hikes is appropriate in the light of subdued inflation, she also added that the Central Bank should be wary of moving too gradually.
Speaking on the tax reform at the end of the US session, US President Trump pledged for making "the tax code simple, and easy to understand," and deliver a "historic tax relief" to the American people. He also talked about the Obamacare bill reform, and trade deals, but his speech was more of a show than an official announcement. The highest note of his speech was the promise to cut corporate rates to 20% from the current 35%-39%, in attempt to attract investors that moved abroad.
The greenback showed little reaction to trumps words, with the EUR/USD pair ending the day at 1.1748. Technically, the pair is still poised to extend its downward move as the intraday attempt to recover ground was contained by selling interest around former support in the 1.1770 region, now the immediate resistance, while in the 4 hours chart, the 20 SMA heads lower almost vertically after crossing below the 100 and 200 SMAs, anyway far above the current level. Also, technical indicators in the mentioned chart have barely corrected extreme oversold conditions before losing upward strength, still deep in negative territory. A break below the mentioned daily low, should result in a test of 1.1661, August monthly low, while beyond this last, the pair could continue falling towards a major long term support at 1.1460.
Support levels: 1.1715 1.1690 1.1660
Resistance levels: 1.1775 1.1810 1.1850
USD/JPY
The USD/JPY pair advanced up to 113.25 this Wednesday, its highest since mid July, fueled by a strong advance in US Treasury yields which reached fresh multi-week highs right ahead of Wall Street's opening and following the release of better-than-expected US Durable Goods Orders for August. A disappointing US housing report for the same month, however, dragged the pair lower afterwards, holding within positive territory at the end of the day anyway. During the upcoming Asian session, BOJ's Kuroda is set to speak at the National Securities Industry Convention, in Tokyo, but given that the Central Bank has maintained the status quo, seems unlikely he could affect the yen. Equities and yields, therefore, will remain as the main market motors for yen crosses. Up for a second consecutive day, the pair maintains a positive tone short-term, although the upward momentum remains limited, as in the 4 hours chart, the price continues developing well above its 100 and 200 SMAs, while the Momentum indicator aims modestly higher within neutral territory, as the RSI indicator aims to recover ground, but remains below its daily low, currently at 62.
Support levels: 112.30 111.90 111.60
Resistance levels: 112.90 113.25 113.60
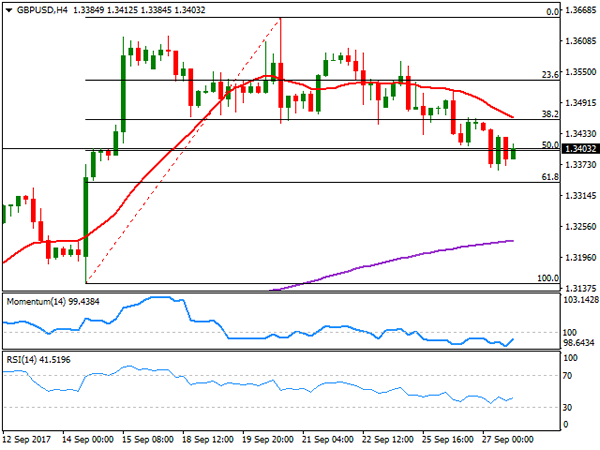
GBP/USD
Pound's decline gained momentum this Wednesday, with the GBP/USD pair down to 1.3363, its lowest since September 14th. The UK released the September CBI retail sales survey of retailers and wholesaler, which revealed that retail sales in the month grew at the fastest pace since September 2015. The index resulted at 42% as 55% of the retailers said that sales volumes were up, whilst 15% said they were down. For this Thursday, the most relevant UK event is a scheduled speech from BOE's Governor Carney, but he is due to deliver the opening remarks at the Bank of England's conference celebrating 20 years of independence, in London, so chances of a monetary policy-related comments are limited. Despite strong local sales data, the pair remained under selling pressure, having spent most of the US session stuck around 1.3400. The level stands for the 50% retracement of the latest bullish run between 1.3146 and 1.3653. From a technical point of view, the pair is biased lower, as the 20 SMA in the 4 hours chart gained downward strength above the current level, now near the 38.2% retracement of the mentioned rally around 1.3460 and reinforcing the static resistance, while technical indicators hover within negative territory, lacking directional clues. The main support comes now at 1.3340, the next Fibonacci support and the level to break to confirm additional declines ahead.
Support levels: 1.3340 1.3300 1.3260
Resistance levels: 1.346 1.3510 1.3550
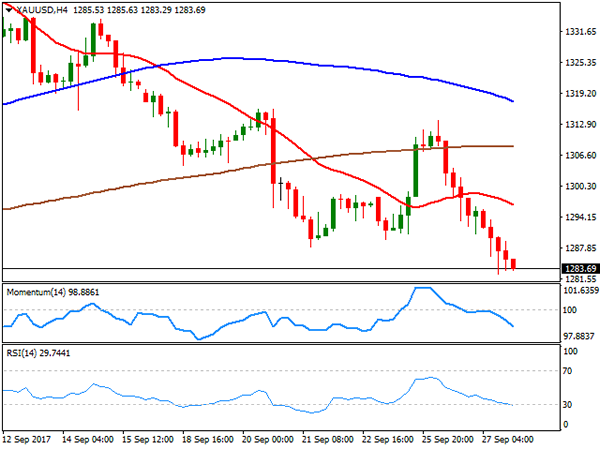
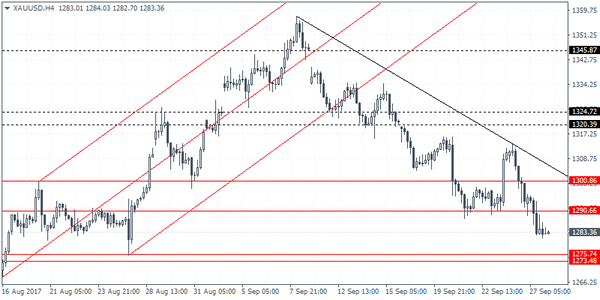
GOLD
Gold prices continued falling, with spot reaching a fresh September low of $1,282.49 a troy ounce, to settle at 1,283.71 by the end of the US session. The bright metal was hit strongly by a hawkish Fed, and the latest slide seems far from over, now that the commodity sits comfortably below the 1,300.00 threshold. From a technical perspective, the downward momentum persists in the daily chart, with technical indicators resuming their slides and particularly the RSI that heads strongly south at 39 a fresh 2-month low. The 100 DMA is now a probable bearish target, at 1,274.50. Shorter term, and according to the 4 hours chart, the metal is also biased lower, as the price settled well below all of its moving averages, with the 20 SMA gaining downward strength around 1,296.30, and technical indicators also heading sharply lower within bearish territory, and nearing oversold levels, with no signs of changing course.
Support levels: 1,288.10 1,280.45 1,272.20
Resistance levels: 1,303.95 1,311.60 1,321.45
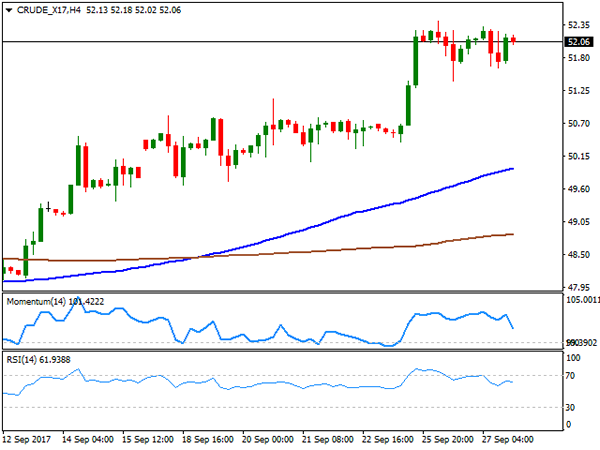
WTI CRUDE OIL
Crude oil prices were little changed for a second consecutive day, as despite the EIA report showed that US crude supplies fell by 1.84M in the week ended September 22nd, much better than the 2.29M build expected, gasoline stockpiles rose by more than expected. Gasoline stockpiles were up by 1.1 million barrels, after falling in the previous three weeks. The decline in crude stockpiles was due to refinery runs and exports being up last week, according to the official report. West Texas Intermediate crude oil futures ended at $52.06 a barrel, and the daily chart shows that the index remains well above its 100 and 200 SMAs, while technical indicators have lost upward strength, turning marginally lower, but still within overbought readings. Shorter term, and according to the 4 hours chart, technical indicators keep retreating within bullish territory, but the price remains far above its 100 and 200 SMAs. The commodity is having a hard time extending gains beyond the 52.00 level, as advances beyond it have been limited, and quickly reverted ever since mid 2015. The risk of a downward move, however, remains limited in the short term, amid hopes of a rebalancing oil market.
Support levels: 51.20 50.50 49.80
Resistance levels: 52.45 53.10 53.70
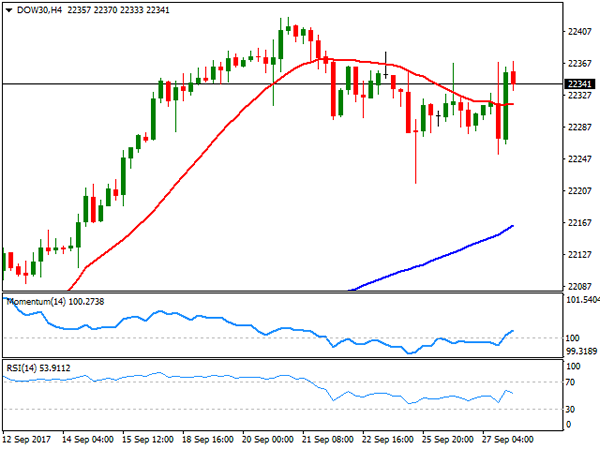
DJIA
Hopes for a US tax reform pushed US indexes into the green this Wednesday, with the Dow Jones Industrial Average adding 56 points, to end at 22,340.71. The Nasdaq Composite added 1.15%, to 6,453.26, backed by a rally in tech stocks, while the S&P closed at 2,597.04, 10 points higher on the day. US President Trump presented the tax reform in Indiana by the end of the US session, but the speech was leaked ahead of the event, triggering little action at the end of the day. Nevertheless, the financial sector was the best performer on the news, and within the Dow, the best performer was United Technologies, which added 2.13%, followed by Goldman Sachs that closed 2.07% higher. JP Morgan Chase comes next, with a 1.63% gain. General Electric, on the other hand, led decliners, down by 2.23%. The Dow trimmed its previous days' losses, flat for the week and up for the day. Technically, the daily chart shows that the 20 DMA maintains a strong upward momentum below the current level, while the RSI indicator resumed its advance currently at 65. The Momentum indicator lags, heading south, but well above its mid-line overall maintaining the positive bias. Shorter term, and according to the 4 hours chart, the index presents a neutral-to-bullish stance, having settled a few points above a flat 20 SMA, and with technical indicators aim higher above their mid-lines.
Support levels: 22,318 22,258 22,216
Resistance levels: 22,370 22,424 22,460
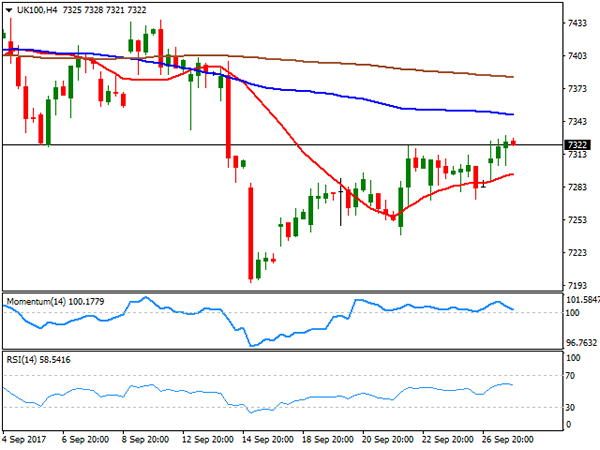
FTSE100
The FTSE 100 gained 27 points on Wednesday, to end the day at 7,313.51, its highest settlement in two-weeks, helped by persistent Pound weakness, and a rally in financial-related equities. Also, news that publisher Pearson's recovery strategy got a positive note from Exane BNP Paribas, led it to the first place, as the share added 3.86%, followed by Royal Bank of Scotland that added 3.44%. Leading decliners, on the other hand, was Randgold Resources, down 2.34%, as gold prices extended their declines on broad dollar's strength. Footsie's recovery is still not enough to take the index out of a bearish market, as technical readings in the daily chart keep favoring the downside, given that the index remains below a bearish 20 DMA, whilst technical indicators keep consolidating within negative territory. In the 4 hours chart, the index remained above a marginally bullish 20 SMA, but below the larger ones, while technical indicators have turned lower within positive territory, overall neutral.
Support levels : 7,287 7,236 7,195
Resistance levels: 7,344 7,381 7,422
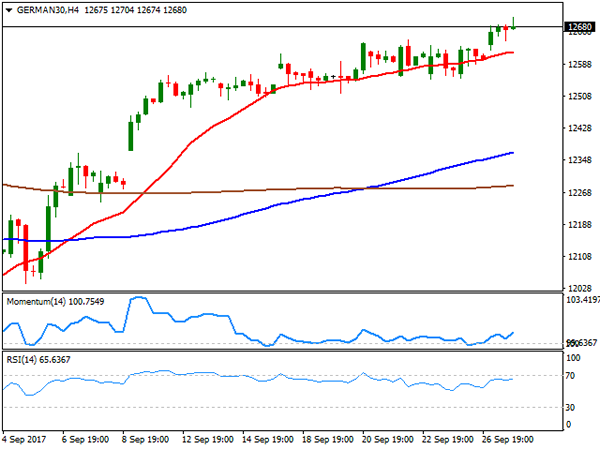
DAX
European equities closed in the green, helped by a recovery in financials, resulting in the German DAX ending the day at 12,657.41, up 52 points. Ahead of US Trump's speech, financial related equities advanced on hopes of fiscal stimulus in the US, in the form of tax cuts. Within the DAX, Deutsche Bank and Commerzbank where the best performers, up 3.47% and 2.38% respectively. Only eight members closed down, led by Vonovia that shed 1.08%. The index surpassed by a few points July's high of 12,677, further advancing in after-hours trading, following the lead of Wall Street. From a technical point of view, the daily chart indicates that the index could extend its advance, as technical indicators resumed their advances within positive territory, whilst the 20 DMA is about to surpass the 100 DMA. In the 4 hours chart, the index maintains a neutral-to-bullish bias, as the index holds firmly above an anyway horizontal 20 SMA, while the Momentum indicator aims barely higher above its mid-line, and the RSI indicator consolidates around 65.
Support levels: 12,686 12,642 12,596
Resistance levels: 12,704 12,732 12,774
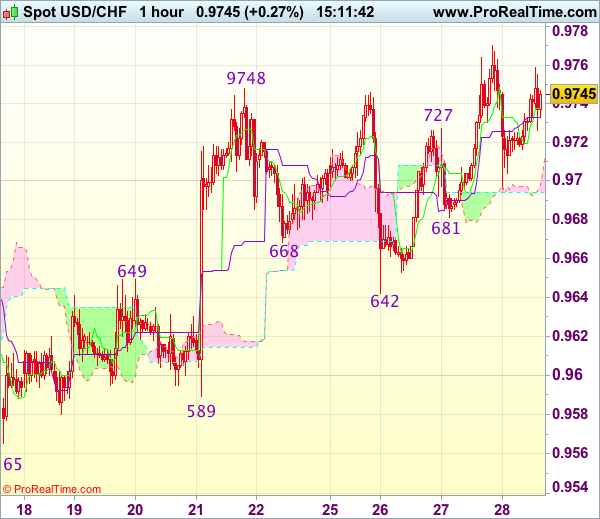
Trade Idea : USD/CHF – Stopped profit and stand aside
USD/CHF - 0.9736
Most recent candlesticks pattern : N/A
Trend : Near term up
Tenkan-Sen level : 0.9738
Kijun-Sen level : 0.9733
Ichimoku cloud top : 0.9698
Ichimoku cloud bottom : 0.9694
Original strategy :
Bought at 0.9685, stopped profit at 0.9710
Position : - Long at 0.9685
Target : -
Stop : - 0.9710
New strategy :
Stand aside
Position : -
Target : -
Stop : -
Although the greenback retreated to 0.9696 yesterday, as dollar found support there and has rebounded, suggesting another test of resistance at 0.9770-73 cannot be ruled out, however, break there is needed to signal recent upmove has resumed and revive bullishness for the move from 0.9421 low to to extend gain to 0.9800-10 but overbought condition should limit upside to 0.9840-50.
In view of this, would not chase this rise here and would be prudent to stand aside in the meantime. Below said support at 0.9696 would suggest top is possibly formed, bring test of 0.9681 support, break there would add credence to this view, bring correction of recent rise towards support at 0.9642 which is likely to hold on first testing.
Tax Reform Expectations Provide A Boost To U.S. Equities And Dollar
The S&P 500 hit a new record high on Wednesday, while treasuries continued to sell off after President Trump announced the tax plan framework, giving the dollar another boost against its major counterparts.
The proposal to slash the corporate tax rate from 35% to 20% is probably less ambitious than previously thought, but given the fact that markets were recently underestimating the likelihood of significant tax cuts after failing to repeal Obamacare, there’s still more room for U.S. stocks to move to the upside. Meanwhile, the dollar may see further short-term gains on expectations that U.S. companies will repatriate profits from overseas.
Similar to Obamacare repeal, slashing tax rates will likely be very challenging. There is a huge debate on whether cutting taxes will increase the deficit in the long run, or whether economic growth compensate for the lost revenue. Another political fight is about to begin, and investors will remain in wait-and-see mode, but this will definitely create some noise in financial markets in the weeks to come.
In currency markets, monetary policies and interest rate differentials will remain the primary influencer. Comments on Tuesday from Janet Yellen refueled rising interest rates expectations, despite some monetary policymakers expressing a cautious stance. Expectations for a 25-basis point rate hike has increased to 77% from 33% last month. Fixed income investors also seem to agree that rates will go higher with U.S. 2-year bond yields trading above 1.49%, for the first time since 2008.
So far, the greenback strength seems to be doing more of a correction than a U-turn. The dollar index is still 9.9% lower from January’s peak, and the major trend remains to the downside. It requires a big political surprise, such as fiscal reforms legislations passing before year end, or deterioration in economic data in Europe and elsewhere, to prove that the U.S. currency will reverse its trend.
Commodity currencies were hit the most, with the Canadian dollar falling 150 pips followingGovernor Poloz’s comments. Investors were pricing in another rate hike from the Bank of Canada in 2017, but instead of confirming this to investors, Poloz said: “there is no predetermined path for interest rates from here and monetary policy will be particularly data dependent in these circumstances and, as always, we could still be surprised in either direction.” Investors now must focus on fundamentals rather than depending solely on the belief that interest rates can only go higher from here.
Given that central bankers are shaking currency markets, it is worth listening to what Mark Carney has to say when he speaks at the Bank of England’s 20th anniversary independence conference. Fed’s Stanley Fischer is also speaking at the same conference and it would be interesting to know his final thoughts before he departs from the Federal Reserve.
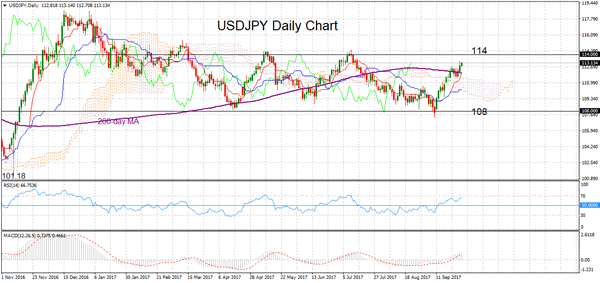
USDJPY In Bullish Phase In Short-Term, Medium-Term Remains Neutral In 108-114 Range
USDJPY is still in a bullish phase in the short term after rebounding off the key 108-area which was the bottom of the medium-term range in which the pair has been trading in since April. Prices are now approaching the top of the range at 114.
The short-term bias remains bullish. The rising momentum oscillators (RSI and MACD) give room for more upside. Meanwhile, USDJPY broke above the 200-day moving average, giving a bullish signal.
Resistance is likely to be strong at 114. A push above the July 11 high of 114.49 is needed to see increased momentum to the upside to target the next peak at 115.50 from March 10. From here, the next peak at 118.66 comes into view, the highest since January 16.
Should USDJPY fail to break resistance at 114 and turn back down, then support is expected to be provided by the 200-day moving average and by the top of the cloud (currently at 112 and 111.50 respectively) before targeting major support at 108. A break below this level would push the price out of the range and would shift the medium-term bias from neutral to bearish.
The Ichimoku cloud has been moving sideways since February, highlighting the neutral medium-term picture. In the short term, a bullish signal was given when the market rose above the cloud. The Tenkan-sen is above the Kijun-sen line, which is also a bullish signal.
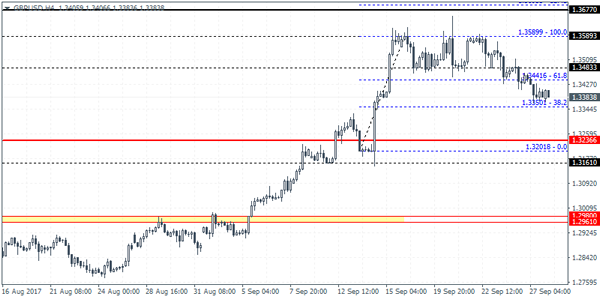
Trade Idea : GBP/USD – Sell at 1.3500
GBP/USD - 1.3394
Most recent candlesticks pattern : N/A
Trend : Up
Tenkan-Sen level : 1.3379
Kijun-Sen level : 1.3390
Ichimoku cloud top : 1.3490
Ichimoku cloud bottom : 1.3450
Original strategy :
Sell at 1.3500, Target: 1.3380, Stop: 1.3535
Position : -
Target : -
Stop : -
New strategy :
Sell at 1.3500, Target: 1.3380, Stop: 1.3535
Position : -
Target : -
Stop : -
As cable has recovered after intra-day brief fall to 1.3349 in London morning, suggesting consolidation above this level would be seen and recovery to 1.3435-40 is likely, however, reckon upside would be limited to 1.3470 and renewed selling interest should emerge around 1.3500-10, bring another decline later. A break of said support at 1.3349 would signal recent decline is still in progress and may extend weakness to previous resistance at 1.3329, then towards 1.3300.
In view of this, would not chase this fall here and would be prudent to sell cable on further subsequent recovery as 1.3500 should hold. Above resistance at 1.3514 would defer and risk a stronger rebound to 1.3535-40 but resistance at 1.3571 should remain intact.
XAUUSD Intraday Analysis
XAUUSD (1283.36): Gold prices broke down below the support zone at 1290 and the current declines could see price testing the next main support that is at 1275 - 1273. The falling trend also shows the possible upside bias that could shift in the event of a breakout above 1290 and the falling trend line. Gold prices are likely to remain subdued in the near term with the resistance level at 1290 and the support level at 1275 likely to be the short term range in prices. A breakout off these levels will only then suggest a further continuation to the momentum.
GBPUSD Intraday Analysis
GBPUSD (1.3383): The British pound close at an eight day low yesterday with the bearish close suggesting further decline in prices. The bullish flag pattern remains invalidated with price action closing below the support at 1.1348 - 1.1344. A modest rebound could be expected with the breached support level likely to turn to resistance. This puts further downside pressure in GBPUSD with the next main support at 1.3236 likely to be tested. The decline to this support level will mark a correction in the GBPUSD rally but could also mean that a new bullish leg could be forming at this support.
EURUSD Intraday Analysis
EURUSD (1.1735): The EURUSD broke past the 1.1822 support level and continued to decline lower, extending the losses. The next support level at 1.1672 is now under focus as price could be seen testing this support level. On the 4-hour chart, the downside price action in EURUSD confirms the descending triangle pattern which puts the lower target towards 1.1688 - 1.1672 level of support. The completion of the descending triangle pattern will potentially see price action likely to post a rebound off this lower support. The new range that could be established will be at 1.1840 - 1.1822 level of resistance and the new support level. Further declines in the common currency could push EURUSD lower towards 1.1440 support.