Sample Category Title
NZDUSD Stalls Decline, Sees Increased Downside Risk In Short-Term
NZDUSD is in a bearish phase after the decline from the 0.7434 peak of September 20. Studies on the 4-hour chart show that a bearish signal was given by the crossover of the 20-period moving average below 50-period MA on September 26. The sharp slope downwards of the 20-period MA is indicating increased downside risk for the pair.
NZDUSD was not able to sustain gains at 0.7434 despite breaking above what was a strong resistance level at 0.7340. The pair fell back below this level on September 21 and despite an attempt to breach it again on September 22, prices fell back down and below the two moving averages.
RSI is in bearish territory below 50 although the indicator is not showing any clear direction at the moment, suggesting a consolidation phase in the near term for NZDUSD. The pair is expected to move sideways for now and remain supported ahead of 0.7180. However, the risk is to the downside and there is scope for a further extension lower to target the August 31 trough of 0.7131.
Looking at the bigger picture, the market is in a neutral bias after the downtrend from the July top of 0.7557
Dollar Surges On Trump’s Tax Proposals, Kiwi Down After RBNZ Releases Monetary Statement
In a data-quiet session, the dollar managed to extend yesterday's gains in Asia after the US President, Donald Trump, revealed his plans on tax reforms a day before. Meanwhile, markets were scanning the RBNZ statement released after the central bank decided to hold rates steady, with the kiwi dipping into losses after the new RBNZ Governor signaled that a weaker currency was needed.
Trump unveiled late on Wednesday in Indianapolis the tax plan outline prepared by White House members and his Republican counterparts that is dubbed as the biggest US tax reform in three decades. The plan aims to reduce corporate and small-business income taxes as well as to cut taxes on high-income earners, with Trump saying that he would not negotiate the Republicans proposal to lower corporate taxes to 20%. However, details on how these tax cuts would be funded were lacking, with markets concerned that the tax proposals, if turned into law, would add to the nation's $20 trillion debt. Though, Congress will only debate the plan when it decides on the 2018 fiscal budget, probably in October.
The dollar index touched a fresh 5-week high of 93.46 as markets were more optimistic of fiscal stimulus to be delivered in the US. Euro/dollar edged down to 1.1733, while pound/dollar fell by 0.12% on the day to 1.3368 ahead of the BOE Governor Mark Carney's speech later today.
In Tokyo, the Parliament announced the dissolution of the lower house on Thursday as the Japanese Prime Minister, Shinzo Abe, called for a snap election on October 22.
Dollar/yen jumped by 0.20% to 113.03.
With political uncertainties remaining in the background, the kiwi weakened in Asia after the RBNZ talked down the currency and decreased its growth rate forecasts following its decision to keep rates unchanged at a record low of 1.75%. The RBNZ Acting Governor, Grant Spencer, who replaced the previous Governor Graeme Wheler whose five-year term ended, said in his statement that “a lower New Zealand dollar would help to increase tradeable inflation and deliver a more balanced growth”, while he also supported that “monetary policy will remain accommodative for a considerable period”.
The kiwi fell from $0.7232 prior the statement to a session low of $0.7170, before climbing to $0.7189. Its Australian cousin touched a six-week low of $0.7804, weighed mainly by the stronger dollar.
The BOC Governor, Stephen Poloz, dampened hopes for another rate hike on Wednesday, saying that there is “no predetermined path for rate hikes from here”. Consequently, the loonie fell sharply by 1%, with dollar/loonie rising to a one-month high of 1.2504.
Regarding commodities, oil prices were down during the session while gold was moving sideways, trading at $1,280.50 per ounce. WTI crude declined by 0.44% to $51.91 per barrel and Brent sank by 0.66% to $57.52.
Euro Pauses After Downhill Ride, German CPI Next
The euro has steadied on Thursday, after three straight losing concessions. Currently, EUR/USD is trading at 1.1755, up 0.15% on the day. On the release front, German GfK Consumer Climate edged lower to 10.8, shy of the estimate of 11.0 points. Later in the day, Germany releases Preliminary CPI, which is expected to remain unchanged at 0.1%. In the US, all eyes will be on Final GDP, with a forecast of 3.0%. As well, unemployment claims are forecast to jump to 269 thousand. On Friday, Germany releases Retail Sales, while the eurozone will publish CPI Flash Estimate. The US will release Personal Spending and UoM Consumer Sentiment.
German President Angela Merkel finds herself with a weaker hand following last week's election, and she will likely have to make major concessions in order to form a coalition government. The most likely coalition is Merkel's CDU, the pro-business FDP and the Greens. This is uncharted political territory, as Germany hasn't had a 3-party coalition since the 1950s. However, Merkel, an experienced and astute politician, hasn't wasted any time, and has already appointed her former finance minister, Wolfgang Schaeuble to president of parliament. This move clears the path for the FDP to join, as the party has insisted on the finance portfolio. The FDP is fiscally hawkish and against Germany continuing to finance weaker eurozone members, such as Greece. If the FDP does take part in the government, Merkel may have to shift away from her plans to further integrate the European Union.
What can we expect from the Federal Reserve with regard to interest rate policy? Fed policymakers remain divided on the hot issue of a third and final rate hike in 2017. Fed Chair Janet Yellen waded into the rate debate on Tuesday, as she sent out a surprisingly hawkish message to the markets. Yellen said that she favored gradual rate increases, and voiced confidence that inflation levels would move higher. She added that if the Federal Reserve did not continue to raise rates, the red-hot labor market could become overheated, potentially causing a recession. Yellen appeared to echo sentiments voiced by New York Fed President William Dudley, who made a strong case for raising rates on Monday. Dudley cited a soft US dollar and strong global growth as reasons why inflation would increase and also translate into stronger wage growth. Dudley said he expects inflation to reach the Fed's target of 2 percent in the “medium term”, and predicted that the Fed would continue to gradually remove monetary accommodation. However, Chicago Fed President Charles Evans sent out a very different message, calling on the Fed to avoid another rate hike until wage and inflation levels moved higher. Evans said that inflation, which is running at around 1.4 percent, is too low, and wants to see “clear signs” that prices are moving higher before the Fed presses the rate trigger. For their part, the markets are more confident in a December move – the CME Group has pegged the odds of a December raise at 81%, while the odds were mired below 50% just a few weeks ago.
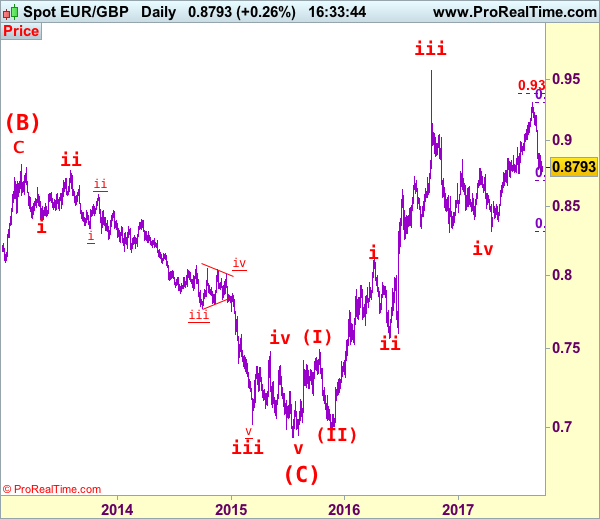
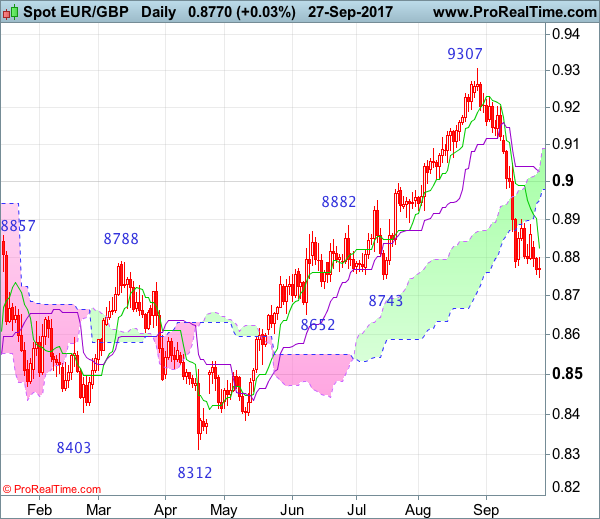
EUR/GBP Elliott Wave Analysis
EUR/GBP – 0.8793
As the single currency has remained under pressure after breaking support at 0.8774, suggesting the decline from 0.9307 top is still in progress and mild downside bias remains for this move to bring correction of recent upmove to 0.8690-95 (61.8% Fibonacci retracement of 0.8312-0.9307), however, loss of near term downward momentum should prevent sharp fall below previous support at 0.8652 and 0.8600 should hold from here, price should stay above 0.8530-35 (previous resistance) and bring rebound later.
Our latest preferred count is that the wave V of a 5-wave series from 0.5682 ended at 0.9805 earlier and major from there has possibly ended at 0.8067 as A-B-C-X-A-B-C. We are keeping our view that the entire correction from 0.9805 has possibly ended at 0.7756 and as labeled as the attached daily chart and impulsive move from 0.9084 has ended at 0.6938 as a 5-waver which marked as the (C) wave, recent impulsive rise is labeled as (I) (II), (i) (ii) series, indicated upside target at 0.9084 had been met, the retreat from 0.9576 suggest wave iii ended there and next upside target for wave v of (III) should head towards 0.9700 but price should falter well below parity .
On the upside, whilst initial recovery to 0.8800-10 and 0.8840 cannot be ruled out, reckon upside would be limited to resistance at 0.8899 and bring another decline. A daily close above 0.8899 would risk rebound to 0.8950-60 but only break of previous support at 0.8982 would defer and suggest low is formed instead, bring retracement of the aforesaid decline from 0.9307 to resistance at 0.9048 first.
Recommendation: Sell at 0.8895 for 0.8700 with stop above 0.8995
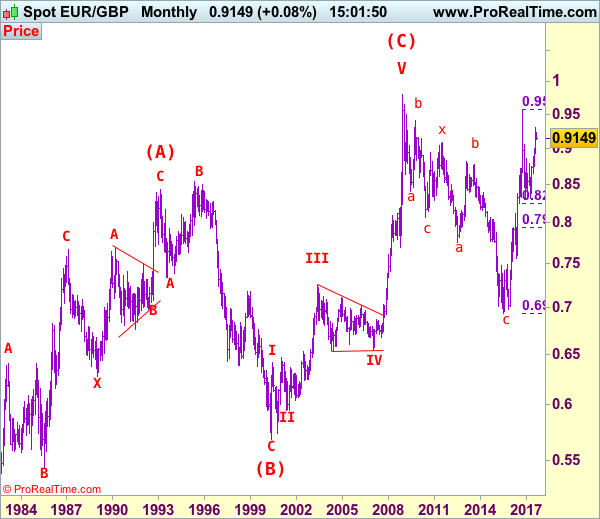
Euro's long term uptrend started in Feb 1981 at 0.5039 and is unfolding as a (A)-(B)-(C) move with (A): 0.8433 (Feb 1993), (B): 0.5682 (May 2000) and impulsive wave (C) should have ended at 0.9805 with wave III ended at 0.7254 (May 2003), triangle wave IV at 0.6536 (23 Jan 2007) and wave V as well as wave (C) has ended at 0.9805.
We are keeping an alternate count that only wave III ended at 0.9805 and the correction from there is the wave IV and has possibly ended at 0.6936, however, it is necessary to see a daily close above resistance at 0.9576 in order to change this to be the preferred count.
USD/CAD Elliott Wave Analysis
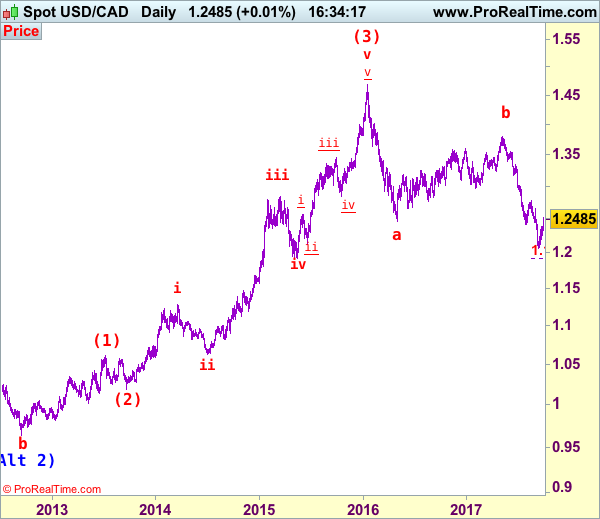
USD/CAD – 1.2485
Although the greenback retreated late last week to 1.2254, renewed buying interest did emerge there and has rebounded (we recommended in our previous update to buy at 1.2260 and a long position was entered), retaining our near term bullishness for the rebound from 1.2061 temporary low to bring retracement of recent decline (indicated upside target at 1.2460 had been met with 200 points profit) towards 1.2500-10, however, near term bought condition should prevent sharp move beyond 1.2550 and price should falter well below resistance at 1.2663, bring retreat later.
We are keeping our view that the wave b from 1.0657 (a leg top) has possibly ended at 0.9633 with (a): 0.9800, wave (b): 1.0447 and wave c at 0.9633, the subsequent rise from there is now treated as wave c exceeded indicated upside target at 1.3770-80 and 1.4000 and wave (3) has possibly ended at 1.4690 and wave (4) correction has commenced for retracement back towards 1.2000.
On the daily chart, our latest preferred count remains that the A of (B) rally from 0.9059 low (7 Nov 2007) unfolded into an impulsive wave with i: 0.9059-1.0380, ii ended at 0.9819, iii at 1.3019 followed by triangle wave iv at 1.2026 , then wave v formed a top at 1.3066 and also ended the wave A. The wave B is unfolding as an double three a-b-c-x-a-b-c and is sub-divided as a: 1.2192, b: 1.2716 and wave c at 1.0784, followed by wave x at 1.1725, another set of a-b-c unfolded with 2nd a at 0.9931, 2nd b at 1.0674. the 2nd c has possibly ended at 0.9407, therefore, consolidation with upside bias is seen for major correction, indicated target at 1.3900 had been met and gain to 1.4700 would follow.
On the downside, expect pullback to be limited to 1.2310-15 and bring another rebound. Below said support at 1.2254 would defer and suggest top is possibly formed, risk weakness to 1.2197, however, a daily close below there is needed to signal the rebound from 1.2061 has ended, bring test of support at 1.2121. Looking ahead, only break there would confirm and indicate recent decline has resumed for retest of said recent low at 1.2061, break there would extend medium term downtrend towards psychological support at 1.2000 but reckon downside would be limited to 1.1925 (61.8% projection of 1.3794-1.2414 measuring from 1.2778). We are keeping our bearish count that wave b ended at 1.3794 and wave c has commenced for further fall towards psychological support at 1.2000.
Recommendation: Long entered at 1.2260 met target at 1.2460 with 200 points profit and would stand aside for this week.
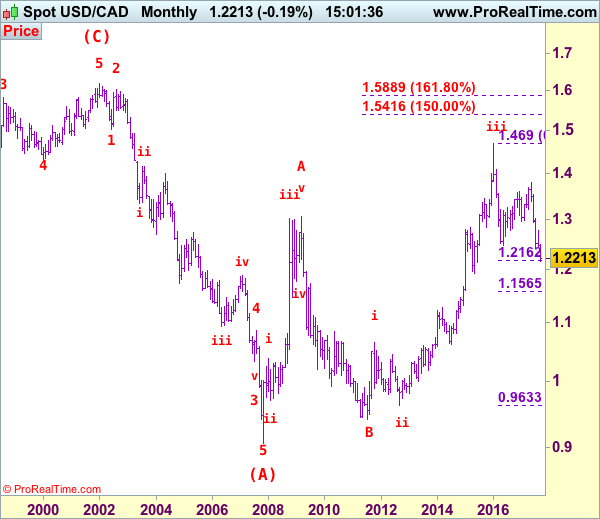
Longer term - The selloff from 1.6194 (21 Jan 2002) to 0.9059 (07 Nov 2007) is viewed as (A) wave which is a 5-waver as labeled on the monthly chart as below, the subsequently rally is labeled as (B) with impulsive A leg of (B) ended at 1.3066, wave B of (B) is unfolding which has either ended at 0.9407 or would extend one more fall but downside should be limited to 0.9200 and 0.9000 should hold.
Trade Idea: GBP/USD – Sell at 1.3460
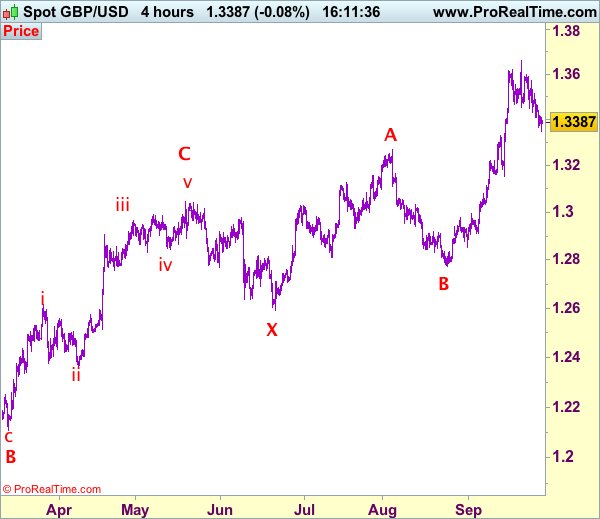
GBP/USD – 1.3365
Original strategy :
Sell at 1.3535, Target:1.3335, Stop: 1.3595
Position: -
Target: -
Stop: -
New strategy :
Sell at 1.3460, Target:1.3300, Stop: 1.3520
Position: -
Target: -
Stop:-
As cable has remained under pressure, suggesting the erratic decline from 1.3658 is still in progress and mild downside bias remains for this move to bring retracement of recent rise, hence further weakness to 1.3300-10 would be seen, however, near term oversold condition should limit downside to 1.3250 and reckon 1.3215-20 (50% Fibonacci retracement of 1.2774-1.3658) would hold from here, price should stay well above previous support at 1.3153, bring rebound later.
In view of this, we are looking to sell cable on recovery as 1.3450-60 should limit upside. Above resistance at 1.3514 would abort and signal the retreat from 1.3658 top has ended, risk a stronger rebound to resistance at 1.3571 but upside should still be limited to 1.3600 and price should falter well below recent high at 1.3658, bring another retreat later. Our preferred count is that (pls see the attached chart) the wave IV is unfolding as a complex double three (ABC-X-ABC) correction with 2nd wave B ended at 1.2774, hence 2nd wave C is unfolding and may extend further gain to 1.3650, then 1.3700, however, overbought condition should limit upside to 1.3770-75 and reckon 1.3800-10 would hold from here, bring retreat later.
Our preferred count on the daily chart is that cable's rebound from 1.3500 (wave (A) trough) is unfolding as a wave (B) with A ended at 1.7043, followed by triangle wave B and wave C as well as wave (B) has ended at 1.7192, the subsequent selloff is the larger degree wave (C) which is still unfolding with minor wave (III) of larger degree wave 3 ended at 1.1986, hence wave (IV) correction is in progress which could either be a triangle wave (IV) of a complex formation but upside should be limited to 1.3500 and price should falter well below 1.4000, bring another decline in wave (V) of 3 for weakness to 1.1500, then 1.1200.
Trade Idea: GBP/JPY – Sell at 151.00
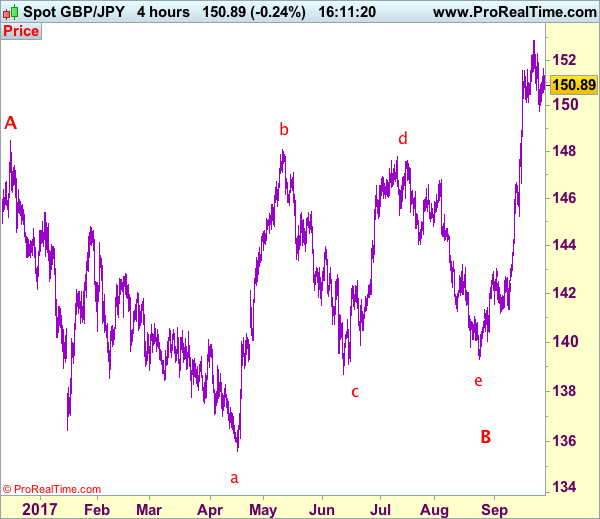
GBP/JPY - 150.75
Original strategy:
Sell at 152.20, Target: 150.20, Stop: 152.80
Position: -
Target: -
Stop: -
New strategy :
Sell at 151.00, Target: 149.00, Stop: 151.60
Position: -
Target: -
Stop:-
As sterling has retreated after meeting resistance at 151.60, suggesting consolidation with mild downside bias would be seen and weakness to 150.15-20 is likely, break there would signal another leg of corrective decline from 152.85 top is underway, bring test of support at 149.75 but break there is needed to retain bearishness and bring retracement of recent rise to 148.90-00, however, only a drop below there would bring further fall to 148.50 and then 148.00 later.
In view of this, we are looking to sell sterling on minor recovery as 151.00 should limit upside. Above said resistance at 151.60 would risk a stronger rebound to 152.00, however, still reckon upside would be limited to 152.25-30 and bring further consolidation. Above 152.50 would risk retest of said last week’s high at 152.85 but break there is needed to signal recent upmove has once again resumed and extend headway to 153.00-10 and possibly towards 153.50-60.
Our preferred count is that larger degree wave V with circle is unfolding from 251.12 with wave (I) 219.34, (II): 241.38 and wave (III) is subdivided into 1: 192.60, 2: 215.89 (23 Jul 2008) and wave 3 ended at 118.87 earlier in 2009. The correction from there to 162.60 is wave 4 which itself is a double three and is labeled as first a-b-c ended at 151.53, followed by wave x at 139.03, 2nd a ended at 162.60, 2nd b at 146.75 and 2nd c leg of wave 4 ended at 163.00. Therefore, the decline from 163.00 to 116.85 is now treated as wave 5 which also marked the end of larger degree wave (III), hence wave (IV) major correction has commenced for retracement of the wave (III) from 241.38 and upside target at 183.95-00 (50% Fibonacci retracement of the wave (II) from 241.38) had been met, a drop below 160.00 would suggest wave (IV) has ended at 195.85, bring decline in wave (V) for initial weakness to 130 (already met) and 120.
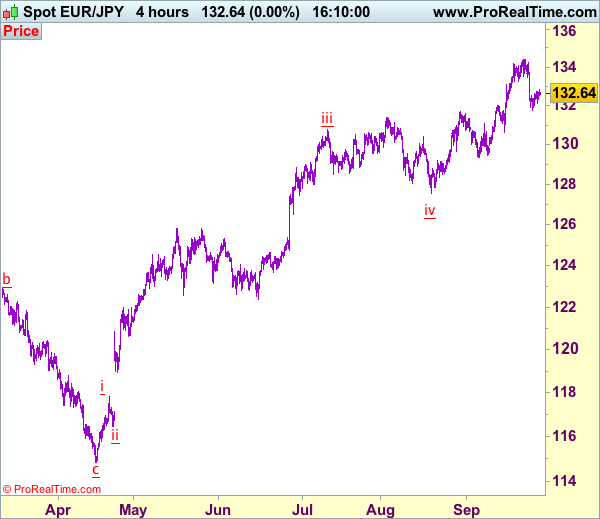
Trade Idea: EUR/JPY – Sell at 133.25
EUR/JPY - 132.66
Original strategy:
Sell at 133.25, Target: 131.75, Stop: 133.85
Position: -
Target: -
Stop: -
New strategy :
Sell at 133.25, Target: 131.75, Stop: 133.85
Position: -
Target: -
Stop:-
Euro’s recovery after marginal fall to 131.75 earlier this week suggests consolidation above this level would be seen and corrective bounce to 133.00 cannot be ruled out, however, if our view that top has been formed at 134.41 is correct, upside would be limited to 133.25-35 and bring another decline later, below said support at 131.75 would extend the fall from 134.41 to 131.50, then 131.00-05, break there would bring retracement of recent upmove towards support at 130.62 which is likely to hold from here.
In view of this, we are looking to sell euro on further subsequent recovery as 133.25-35 should limit upside. Above previous support at 133.43 would abort and suggest at least first leg of decline from 134.41 has ended, bring a stronger rebound to 133.90-00 but still reckon said resistance at 134.41 would remain intact, bring further consolidation.
Our latest preferred count is that wave (ii) is ABC-X-ABC which ended at 123.33 and wave (iii) is unfolding with wave iii ended at 100.77, followed by wave iv at 111.57 and wave v as well as the wave (iii) has ended at 97.04, followed by wave (iv) at 111.43 and wave (v) has ended at 94.12 which is also the end of the larger degree v, this also implied the major wave (C) has also ended there, hence major correction has commenced from there with (A) leg unfolding in its lower degree wave c which has possibly ended at 145.69. Under this count, A-B-C wave (B) has commenced with A leg ended at 136.23, wave B at 143.79 and wave C has possibly ended at 149.79.
Our larger degree count is that the decline from 139.26 is wave (C) and is sub-divided into a diagonal triangle i-ii-iii-iv-v with wave i - 105.44, wave ii- 123.33, wave iii - 97.03, wave iv - 111.43, followed by the final wave v as well as the end of wave (C) at 94.12, this also mark the bottom of larger degree wave B. Under this count, major rise in wave C has commenced as an impulsive wave with minor wave III ended at 145.69, wave V is still in progress for further gain to 150.00. Having said that, this so-called wave V could well be the first leg of larger degree 5-waver wave C and this wave C should bring at least a retest of wave A top at 169.97 (July 2008).
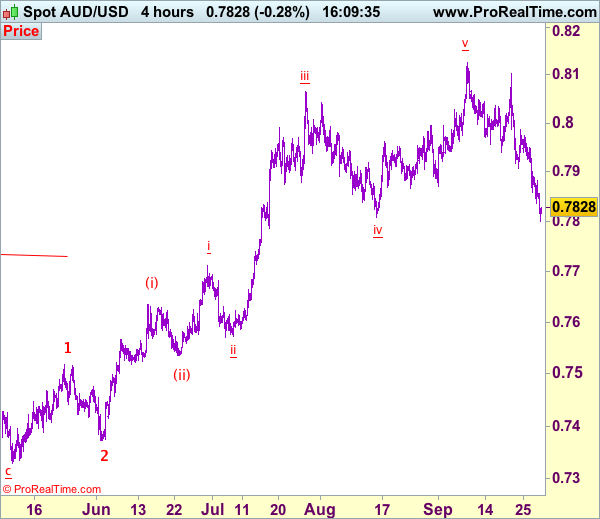
Trade Idea: AUD/USD – Sell at 0.7940
AUD/USD – 0.7827
Original strategy:
Sell at 0.7940, Target: 0.7740, Stop: 0.8000
Position: -
Target: -
Stop:-
New strategy :
Sell at 0.7940, Target: 0.7740, Stop: 0.8000
Position: -
Target: -
Stop:-
As aussie has dropped again today after brief recovery and broke below previous support at 0.7808, adding credence to our bearish view that the decline from 0.8125 top is still in progress and bearishness remains for this fall to bring retracement of early upmove towards 0.7740-50, however, near term oversold condition should limit downside and reckon 0.7700 would hold, bring rebound later.
In view of this, we are looking to sell aussie again on recovery as 0.7940-50 should limit upside and bring another decline. Above resistance at 0.7986 would defer and suggest a temporary low is formed instead, bring a stronger rebound to 0.8000 but price should falter below 0.8040-50, bring another decline later.
On the 4-hour chart, recent upmove from 0.7329 is unfolding as an impulsive rise with wave 3 as well as smaller degree wave (iii) extending, only minor wave v of (iii) has ended at 0.8125, hence bullishness remains for this move to extend headway to 0.8200, then towards 0.8300, however, reckon upside would be limited to 0.8400 and the final wave 5 should falter below 0.8500, bring correction later.
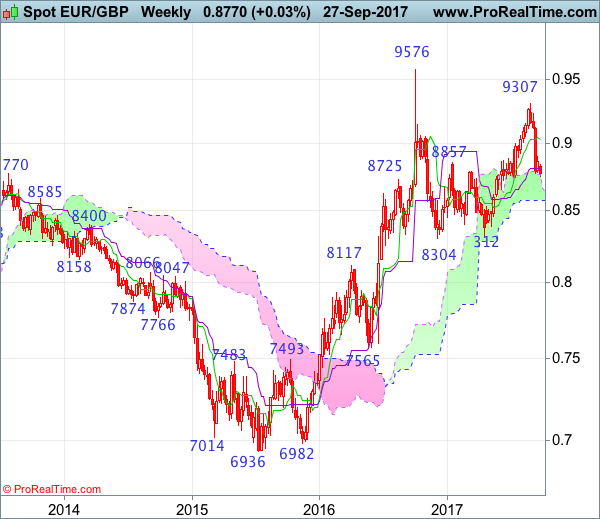
EUR/GBP Candlesticks and Ichimoku Analysis
Weekly
• Last Candlesticks pattern: N/A
• ime of formation: N/A
• Trend bias: Near term up
Daily
• Last Candlesticks pattern: Shooting star
• Time of formation: 29 Aug 2017
• Trend bias: Down
EURGBP – 0.8760
Although the single currency has resumed recent reversal from 0.9703 and initial downside bias remains for weakness to 0.8690-95 (61.8% Fibonacci retracement of 0.8312-0.9307), loss of near term downward momentum should prevent sharp fall below previous support at 0.8652 and reckon 0.8600-05 would hold from here, price should stay above 0.8550-55, risk from there remains for a much-needed corrective rebound to take place later.
On the upside, whilst initial recovery to the Tenkan-Sen (now at 0.8824) and then 0.8840 cannot be ruled out, reckon resistance at 0.8899 would limit upside and bring another decline later. Above 0.8899 resistance would bring test of the lower Kumo (now at 0.8948) but a daily close above there is needed to suggest a temporary low is possibly formed, bring retracement of recent decline to 0.8970-75, then 0.9000 but reckon the Kijun-Sen (now at 0.9027) would limit upside and resistance at 0.9048 would remain intact.
Recommendation: Stand aside for this week.
On the weekly chart, as the single currency has remained under near term pressure after retreating sharply from 0.9307 and near term downside risk remains for this fall to bring retracement of recent rise, hence weakness to 0.8690-95 (61.8% Fibonacci retracement of 0.8312-0.9307) and possibly support at 0.8562 cannot be ruled out, however, reckon downside would be limited to the lower Kumo (now at 0.8571) and previous resistance at 0.8531 should turn into support and contain euro’s downside.
On the upside, expect recovery to be limited to 0.8840 and resistance at 0.8899 should hold, bring another decline later. A weekly close above said resistance at 0.8899 would bring corrective bounce to 0.8950-60 and possibly towards 0.9000 but reckon upside would be limited to the Tenkan-Sen (now at 0.9027) and bring another decline. Above 0.9105-10 would abort and risk a stronger rebound towards 0.9190-00, having said that, further strong rise above 0.9225-30 should not be repeated and price should falter well below recent high at 0.9307.