
Sample Category Title
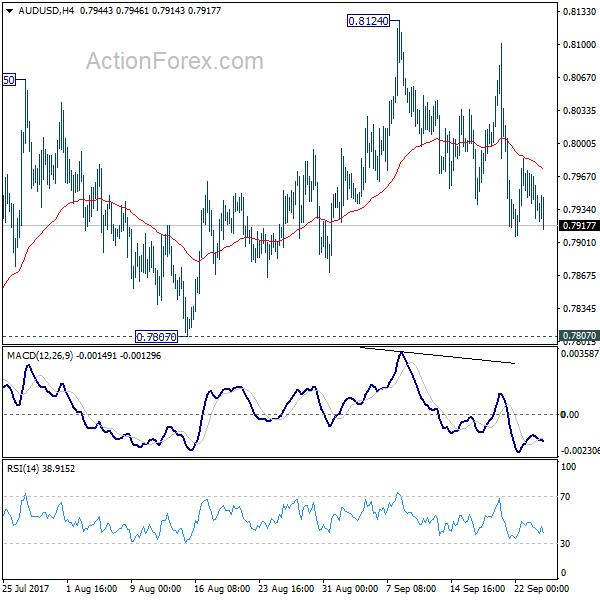
AUD/USD Daily Outlook
Daily Pivots: (S1) 0.7917; (P) 0.7945; (R1) 0.7964; More...
Intraday bias in AUD/USD remains neutral for the moment as consolidation from 0.8124 continues. With 0.7807 support intact, outlook stays bullish for another rally. Above 0.8124 will target 100% projection of 0.6826 to 0.7833 from 0.7328 at 0.8335 next. However, considering bearish divergence condition in daily MACD, firm break of 0.7807 will indicate near term reversal and turn bias back to the downside for 0.7328 key support.
In the bigger picture, rise from 0.6826 medium term bottom is still in progress. At this point, there is no confirmation of trend reversal yet and we'll continue to treat such rebound as a corrective pattern. But in any case, break of 55 month EMA (now at 0.8090) will target 38.2% retracement of 1.1079 to 0.6826 at 0.8451. Break of 0.7807 support is needed to to be the first sign of completion of the rebound. Otherwise, further rise is now in favor.
XAUUSD Analysis: Breaks Descending Channel
In result of the previous trading session, the yellow metal managed to recover not less than 1.26% against the buck. Such rapid advance pushed the pair not only through the psychological 1,300.00 level but also through the upper boundary of a descending channel as well as the 200-hour SMA. Most likely this sudden interest in gold was attributed to very hostile rhetoric between the US and North Korea. On the other hand, such movement could also have a technical rationale, as by the moment, the pair has reached the 1,313.61 mark that represents a point from which it entered into a downfall six days ago. This fact as well as the additional resistance set up by the weekly R1 at 1,315.94 suggests that the rate is likely cool down and eventually resume the fall.
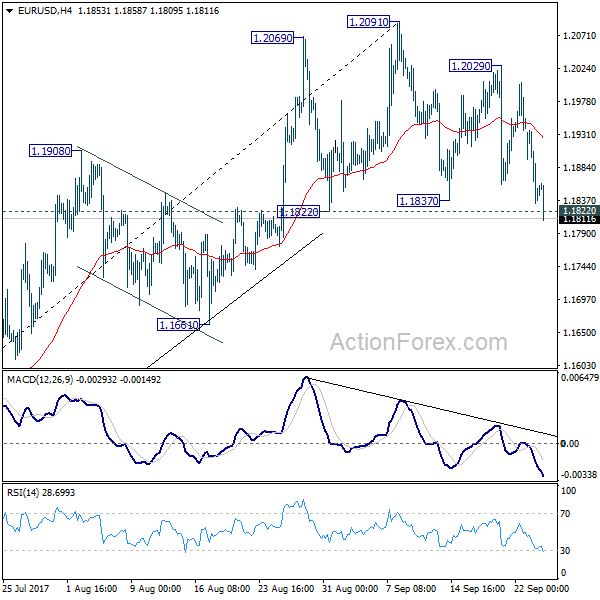
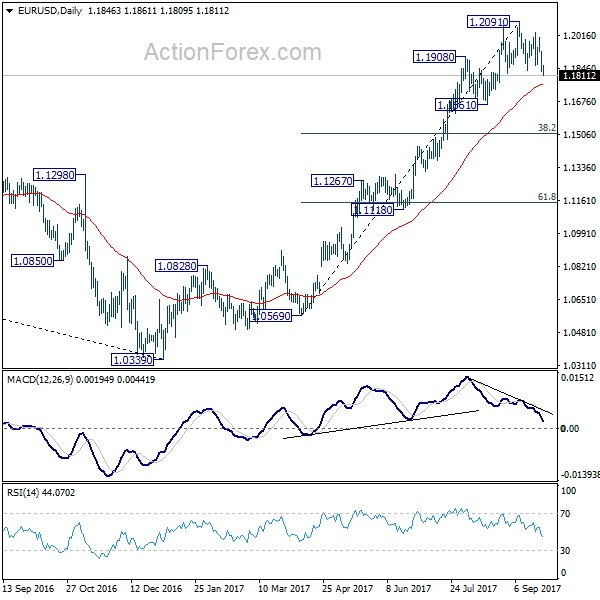
EUR/USD Daily Outlook
Daily Pivots: (S1) 1.1808; (P) 1.1872 (R1) 1.1913; More...
EUR/USD's decline from 1.2091 continues today. Break of 1.1822 support indicates near term reversal. That is, fall from 1.2091 is now correcting whole rally from 1.0569. Intraday bias is turned to the downside for 1.1661 support first. Break will target 38.2% retracement of 1.0569 to 1.2091 at 1.1510, where we're expecting support to bring rebound. On the upside, break of 1.2029 resistance is needed to confirm completion of the pull back. Otherwise, deeper fall will remain in favor as the correction develops.
In the bigger picture, rise from medium term bottom at 1.0339 is still in progress for 38.2% retracement of 1.6039 (2008 high) to 1.0339 (2017 low) at 1.2516. However, it should be noted that there is no confirmation of trend reversal yet. That is, such rebound from 1.0399 could be a correction. And the long term fall from 1.6039 (2008 high) could resume. Hence, we'd be cautious on strong resistance from 1.2516 to limit upside. But after all, break of 1.1661 is needed to indicate medium term topping. Otherwise, outlook will remain bullish in case of pull back.
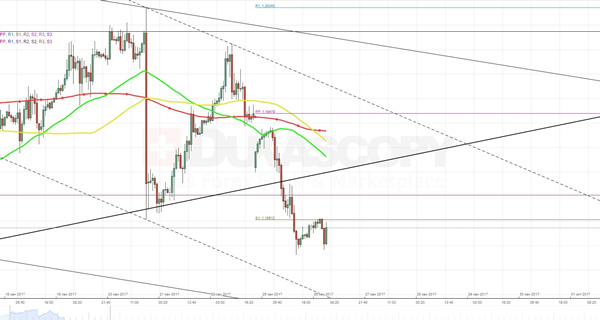
USDJPY Analysis: Falls Amid Kim-Trump Hostile Rhetoric
An increasing hawkish rhetoric between the United States and North Korea led to appreciation of the Yen by 63 basis points just in three hours. As a result, the pair broke through the 100-hour SMA as well as the weekly PP and ended up near the 200-hour SMA. Accordingly, today the currency rate might try using this downside momentum to slip to the area between the 111.38 and 111.26 levels. On the other hand, a number of factors indicate on presence of a new junior descending channel. If this assumption is true, then the rate should not fall below the 111.40 mark. In contrast, the buck might use the above 200-hour SMA as a springboard to try to return at least to the weekly PP at 111.90.
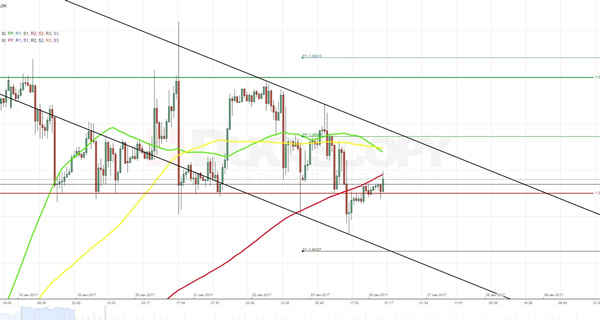
GBPUSD Analysis: Sneaks Below Monthly R2 At 1.3485
Although initially the currency pair managed to climb above the weekly PP at 1.3536 that was backed up by the 55- and 100-hour SMAs, but later it failed to strengthen this position and continue the surge. In result of the two hour downfall, the Pound lost 67 basis points against the Greenback, thus breaking the previously active rectangle pattern whose lower trend-line was represented by the monthly R2 at 1.3485. During this trading session the Sterling might try to restore some of the lost positions, but this attempt is likely to be neutralized by the 200-hour SMA, which is located near the 1.3494 level. In additional to that, the northern direction also contains the previously mentioned 55- and 100-hour SMAs, which are lying along the upper edge of a supposed new descending channel.
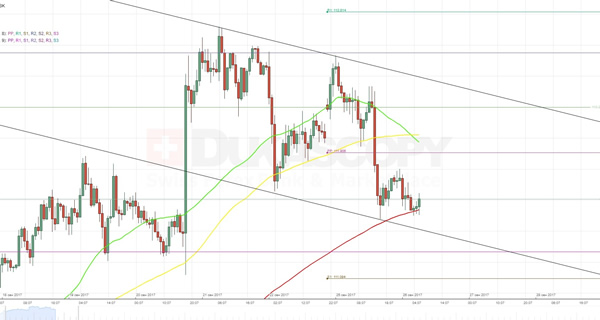
EURUSD Analysis: Falls From Symmetrical Triangle
As it was expected, a combination of the 55-, 100- and 200-hour SMAs around the weekly PP, which is located at the 1.1948 level, did not allow the rate to surge any further. Because of the rebound, most of the previous trading session movement of the pair was guided by bears, which pushed it out of a symmetrical triangle. In other words, a long-term dominant ascending channel was broken. Such outcome indicates that today the currency rate is likely to continue to slip to the bottom, trying to reach the lower trend-line of a three week long descending channel. And the fact that it located below the monthly PP at 1.1881 and the weekly S1 at 1.1861 as well as the above moving averages, only supports this scenario.
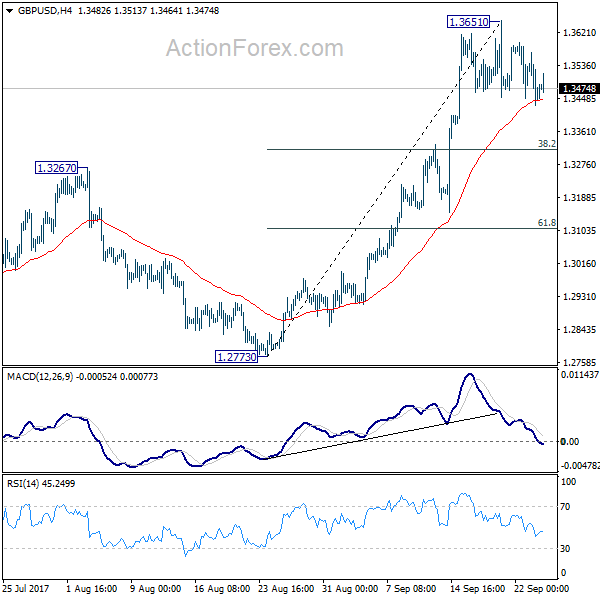
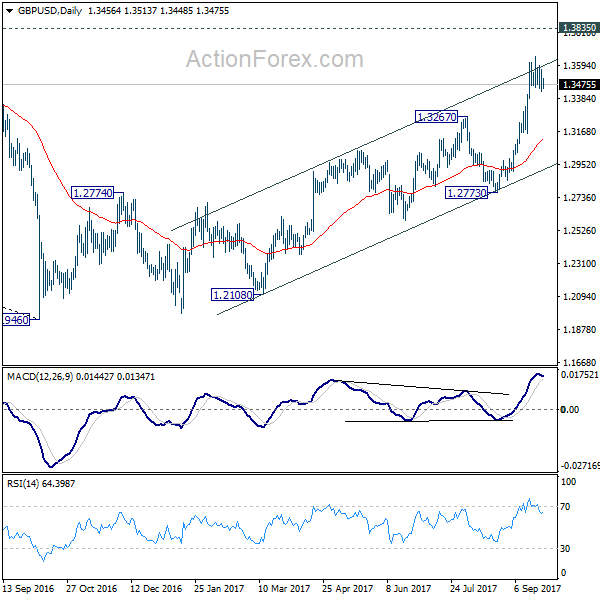
GBP/USD Daily Outlook
Daily Pivots: (S1) 1.3410; (P) 1.3490; (R1) 1.3549; More....
GBP/USD is staying in consolidation from 1.3651 and intraday bias remains neutral. In case of deeper fall, downside should be contained by 38.2% retracement of 1.2773 to 1.3651 at 1.3316 and bring rise resumption. Above 1.3651 will turn bias back to the upside for 1.3835 support turned resistance next. Break there will target 55 month EMA (now at 1.4405).
In the bigger picture, current development argues that the long term trend in GBP/USD has reversed. That is, a key bottom was formed back in 1.1946 on bullish convergence condition in monthly MACD. Current rise from 1.1946 will target 38.2% retracement of 2.1161 (2007 high) to 1.1946 (2016 low) at 1.5466 next. In any case, medium term outlook will now stay bullish as long as 1.2773 support holds.
Safe Havens Gain Ground As Pyongyang Threatens To Shoot Down US Jets, Oil Hits Fresh Highs
Geopolitical uncertainties became dangerous late on Monday giving a boost to safe havens during Tuesday's Asian session. The North Korean Foreign Minister Ri Yong Ho used a stronger language against the US, saying that Trump's recent comments were a declaration of war on the Korean peninsula and the regime has the right to shoot down US bombers even if they fly outside the regime's airspace. A few hours later the White House spokeswoman Sarah Sanders denied that the US has declared war on North Korea, while the National Security Adviser H.R McMaster argued that the US is playing out four or five scenarios on how to deal with North Korean tensions admitting that warnings from the peninsula are “much further advanced” than anticipated.
Dollar/yen tumbled to 111.64 from 112.20 prior to the exchange of threatening words.
Dollar/swissie bottomed at 0.9641 on late Monday but managed to bounce up to 0.9697 afterwards due to the rising dollar.
Gold rose to $1,308.39 per ounce.
The dollar index climbed higher to 92.51 in Asia despite escalating geopolitical tensions after the New York Fed President William Dudley claimed on Monday that the Fed sees interest rates rising gradually given factors driving inflation lower are fading and US economic conditions are supportive. However, the Minneapolis Fed President Neel Kashkari who is a voting member this year commented early today that there is no need to hike rates as there is still no evidence of “inflation taking off”.
Next up today, Fed Chair Yellen is expected to give a speech before the FOMC members, Lael Brainard and Loretta Mester make public appearances later on. Moreover, new homes sales and Conference Board consumer confidence figures are anticipated to be released during the European trading hours.
The euro was hovering close to one-month low levels reached yesterday following ECB's Draghi remarks which stated that currency volatility is a source of uncertainty which needs monitoring while he also added that “ample” ECB accommodation was still required. The German election outcome kept pressuring the currency with far-right AfD party entering the parliament for the first time and Merkel's party seeking for new coalition partners after its current partner SPD decided to go to the opposition. Euro/dollar was last at 1.1853.
Sterling recovered from its ten-day low of 1.3430 touched yesterday, climbing to 1.3490 during the Asian session.
In other currencies, the kiwi stretched its downtrend, falling by 0.30% on the day to a two-week low of $0.7231 weighed mainly by uncertainties in the political environment as New Zealand's Prime Minister who was the winner of the elections for the second time on Saturday must negotiate with other parties to build a coalition government. Moreover, worse than expected trade data for the month of August and disappointing ANZ business readings released early today pressured the kiwi even further. Thursday sees the decision by the Reserve Bank of New Zealand.
Its Australian cousin was slightly up at $0.7941.
The loonie continued weakening for the third week on the back of a stronger dollar despite increasing oil prices. Dollar/loonie was last trading at 1.2370 ahead of the BOC's Governor Stephen Poloz speech on Wednesday.
Looking at energy markets, WTI crude oil and Brent touched fresh highs amid stronger joint compliance from OPEC and non-OPEC producers in order to reduce supply as well as the threat by Turkey's President, Tayyip Erdogan, to cut oil flows from Kurdistan to the rest of the world. The warning came as a response to Kurdistan's independence referendum held on Monday which passed off peacefully across the region. WTI crude rose to a five-month high of $52.40 per barrel while Brent reached a two-year high of $59.47. The API weekly crude report released later in the day is also expected to bring some volatility to oil prices.
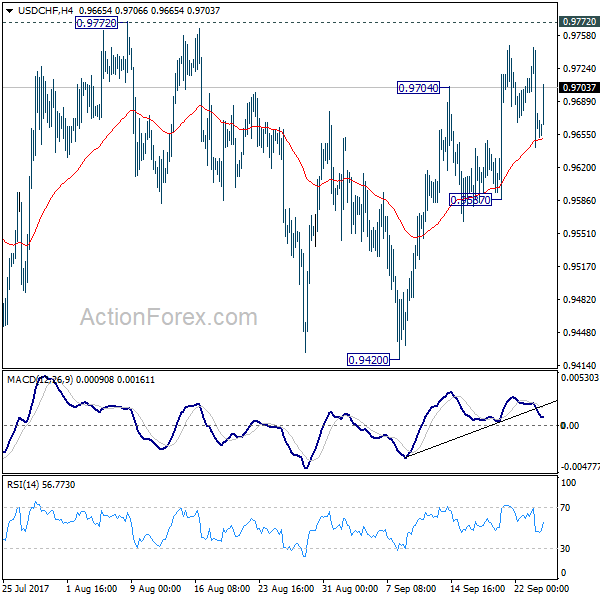
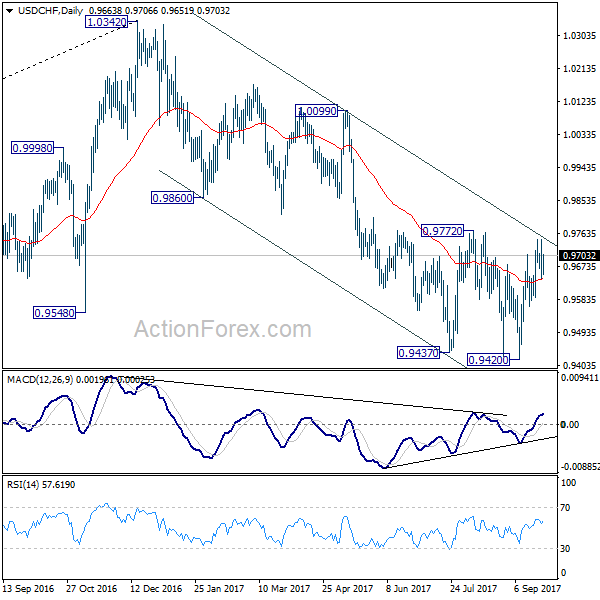
USD/CHF Daily Outlook
Daily Pivots: (S1) 0.9622; (P) 0.9683; (R1) 0.9725; More....
Intraday bias in USD/CHF remains neutral for the moment. On the upside decisive break of 0.9772 resistance will suggest that whole down trend form 1.0342 has completed. In that case, near term outlook will be turned bullish for 0.9860/1.0099 resistance zone. Nonetheless, with 0.9772 resistance intact, outlook remains bearish. Below 0.9587 minor support will turn bias back to the downside for retesting 0.9420 low.
In the bigger picture, current development suggests that 0.9443 key support (2016 low) could be taken out firmly as down trend form 1.0342 extends. There are various interpretation of the price actions. But in any case, medium term outlook will stay bearish as long as 0.9772 resistance holds. Current down trend could extend to 38.2% retracement of 0.7065 (2011 low) to 1.0342 (2016 high) at 0.9090. However, break of 0.9772 will indicate that USD/CHF has successfully defended 0.9443 again and turn outlook bullish for 1.0099 resistance.
USDJPY Falls On North Korean Tensions
The USDJPY pair has fallen below the 112 level, to test its 200-day moving average, at 111.44, after North Korea’s foreign minister said on Monday, President Donald Trump had declared war on North Korea.
Tensions have also risen, after Pyongyang threatened to test another nuclear capable hydrogen-bomb over the Pacific Ocean, sending investors into safe-haven assets such as the Japanese Yen and gold.
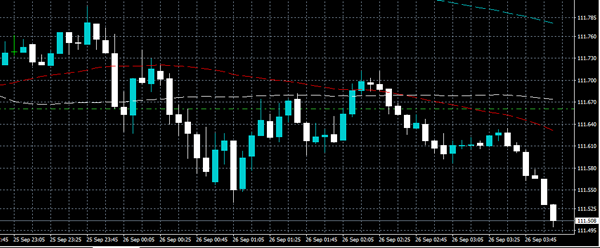
At present, the USDJPY trades below its 200-week moving average, at 111.64, however, sellers yesterday failed to close the daily time-frame price candle below the 111.64 level.
Key intraday USDJPY technical support is found at the 200-day moving average at 111.44 and the pairs 100-week moving average, at 111.04. Below 111.04 further support is found at 110.86 and 110.68.
To the upside, key technical resistance above the 111.65 level is found at the pairs daily pivot point, at 111.84 and the key 112 handle.
Above 112, further resistance is found at 112.30 and 112.57, with the 112.71 and 113.20 levels offering strong weekly resistance.
.