Sample Category Title
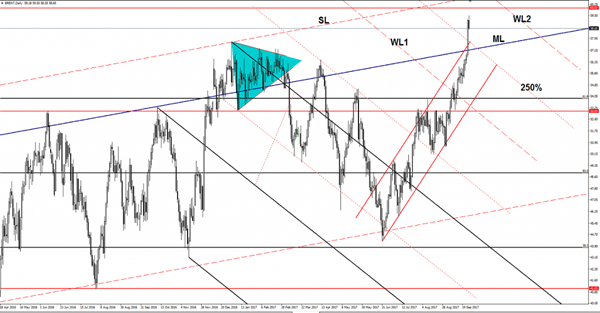
Brent Oil Slips Lower
Brent Oil drops after the impressive rally failing to stabilize above the $59.00 per barrel. The minor correction is natural, it could come to retest the 250% Fibonacci line and the median line (ML) of the major ascending pitchfork before will resume the upside journey.
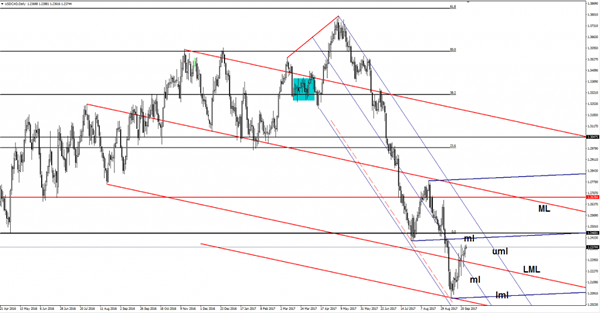
USD/CAD Little Changed
Price increased today, but it seems like is losing the bullish momentum. USD/CAD is still trading below the 1.2389 Wednesday’s high. The next upside target will be at the median line (ml) of the blue ascending pitchfork. USD/CAD is still under pressure as long a is trading within the descending pitchfork’s body.
We’ll have a broader increase only after a valid breakout from the minor descending pitchfork’s body.
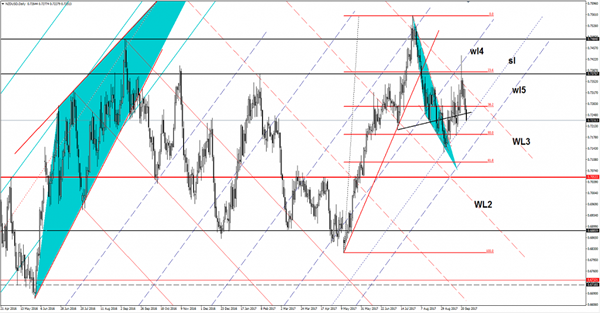
NZD/USD Edges Lower
The currency pair has dropped sharply today and resumes the bearish momentum. It seems too heavy to be stopped right now even if the USDX is bloodless. The USDX drags the pair down, but remains to see what will happen because has reached a dynamic support. Technically, it should take out the downside obstacle after the false breakout above a strong dynamic resistance.
Price is trading in the red and seems unstoppable, a further USDX’s increase will force the pair to hit fresh new lows in the upcoming period.
The USDX has managed to jump above the 92.49 static resistance, but we still need a confirmation that will really climb towards fresh new highs. USDX move sideways on the short term, this could be an accumulation and could bring us a larger rebound.
Price is pressuring the sliding parallel line (sl), which represents an important dynamic support. NZD/USD is trading in the red and is expected to ignore the mentioned support level and to approach and reach the 50% retracement level. We have an important downside target at the fifth warning line (wl5) as well.
Actually, it could be attracted by the confluence area formed between the 50% Fibonacci line with the fifth warning line (wl5).
Now is trapped within an ascending channel, but a breakdown below the sliding line (sl) will confirm a further drop in the upcoming period.
Euro Trades Below Key SUpport After German Elections
The euro continues to slip lower against the U.S dollar, hitting 1.1832 in late Monday trading, with the pair now closing price-action under major weekly support and trading at its lowest level, since August 31st.
Technically, the EURUSD is set for a deeper correction lower, as the pair performed a higher time-frame and daily price-close below 1.1885, and also broke beneath important former weekly price lows.
The euro currency hates uncertainty, and the EURUSD may be further pressured lower as the German CDU party seeks a coalition, and tensions remain in Spain over Catalonia's bid for independence.
Key technical intraday support for the EURUSD is found at 1.1823 and 1.1773, with the pairs 200-week moving average critical monthly support, at 1.1716.
Key intraday resistance comes from the pairs 50-day moving average at 1.1870, and the key 1.1885 level. Should the euro trade above 1.1885, further resistance is found at the 50-hour moving average, at 1.1913 and the weekly pivot point, at 1.1948.
.
Foreign Exchange Market Commentary: EUR/USD, USD/JPY, GBP/USD, GOLD, WTI CRUDE, DJIA, FTSE100, DAX
EUR/USD
The common currency had a rough day, falling down to 1.1832 against the greenback, to end the day not far above the level. The EUR was hit at the beginning of the week by the outcome of German's election, as Merkel's party got a minor victory, with 33% of the votes, while the far-right AfD got 12.6%, making it to the Parliament for the first time since WWII. Merkel, will now to have to form a coalition to govern Germany, particularly after the SPD leader, Martin Schulz who came in second with a 20.5%, ruled out the possibility of a coalition with Merkel's CDU party. Also, the German IFO survey showed that German manufacturers ramped up their investment in September, but not to the extent originally planned. Business climate was down to 115.2 in September, from a previously revised 115.7 and against the 116.00 expected. There were no big headlines coming from the US, but escalating tensions between the country and North Korea triggered demand for safe-haven assets in the US afternoon, dragging the pair further lower, after North Korean foreign minister Ri Yong Ho said that US Trump's comments over the weekend were clearly a declaration of war.
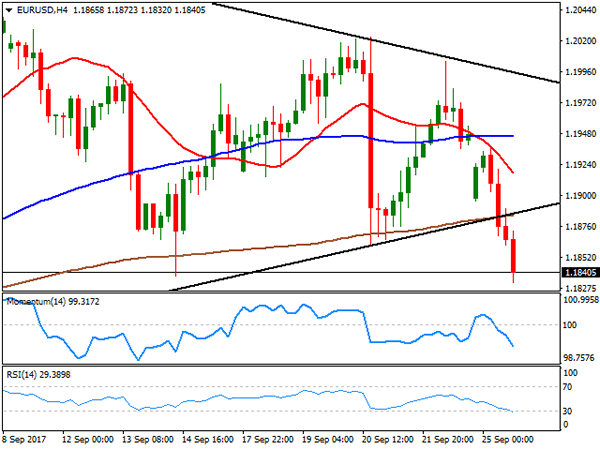
This Tuesday, US Fed Yellen is due to deliver a speech titled "Inflation, Uncertainty, and Monetary Policy" at the National Association for Business Economics Annual Meeting, in Cleveland, but seems unlikely she would offer something that can surprise market players, after last week's statement. Technically, the pair is poised to extend its decline, back near the key support around 1.1820/30, where the pair bottomed these last few weeks. The 4 hours chart shows that the price broke below a daily ascendant trend line coming from mid August, which converges with the 200 SMA around 1.1885, making of the level a strong intraday resistance for the upcoming sessions, whilst in the same chart, technical indicators maintain a strong bearish momentum near oversold territory, supporting a bearish breakout of the August/September range.
Support levels: 1.1820 1.1775 1.1730
Resistance levels: 1.1885 1.1930 1.1965
USD/JPY
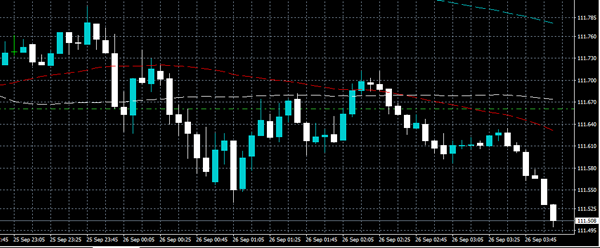
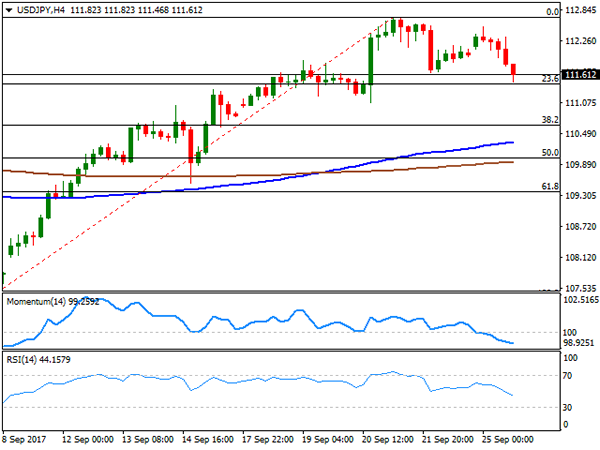
The Japanese yen retakes the upside against its American rival during the last session, following comments coming from North Korean foreign minister, Ri Yong Ho, who said that US President Donald Trump's comments over the weekend were clearly a declaration of war and therefore, they have every right to take countermeasures, including the right to shoot down strategic US bombers even if they are not in North Korean airspace. US equities, which were off to a soft start, fell further, whilst US Treasury yields trimmed most of last week's gains. The 10-year note benchmark is down to 2.22%, after closing last Friday at 2.26%. The pair fell down to 111.46 before bouncing modestly, holding into the red for the day, and close to trim all of the Fed-related gains triggered last week. The 4 hours chart indicates that the pair bounced from near a critical support, the 23.6% retracement of the 107.31/112.71 rally around 111.40, now the immediate support. The same chart shows that technical indicators gained downward momentum within bearish territory, but also that the price remains well above its 100 and 200 SMAs. In the 111.40 area, the pair also has its 200 DMA, reinforcing the strength of the level, and giving stronger implications to a bearish breakout of such level.
Support levels: 111.75 111.40 111.00
Resistance levels: 112.10 112.40 112.85
GBP/USD
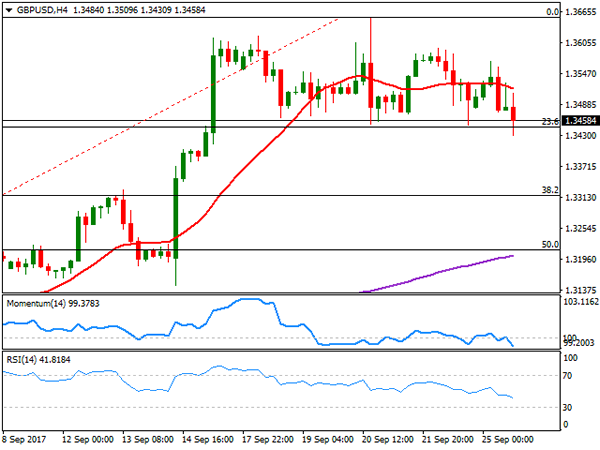
The GBP/USD pair ended the day marginally lower, undermined by broad dollar's strength. The pair extended last week's slide by a couple of pips, printing 1.3430 before recovering to settle above a major Fibonacci support at 1.3450, the 23.6% retracement of 1.2773/1.3553 rally. The UK had nothing to offer from the macroeconomic front, although the fourth round of Brexit negotiations began in Brussels. UK's Brexit minister, David Davis, said that there could be "no excuses" to progress within negotiations, but once again insisted that the divorce-bill should be linked to a deal on future ties, against EU's negotiators stance, which want to settle the bill before moving forward. The pair is slowly gaining downward traction according to intraday readings, although a clear break of the mentioned support is still required, to anticipate further slides towards the 1.3320 region, where the pair has the 38.2% retracement of the same rally. In the hours chart, the price has now extended below its 20 SMA that slowly turned lower, whilst technical indicators accelerated south within bearish territory, in line with a bearish extension during the upcoming sessions.
Support levels: 1.3450 1.3410 1.3370
Resistance levels: 1.3490 1.3535 1.3560
GOLD
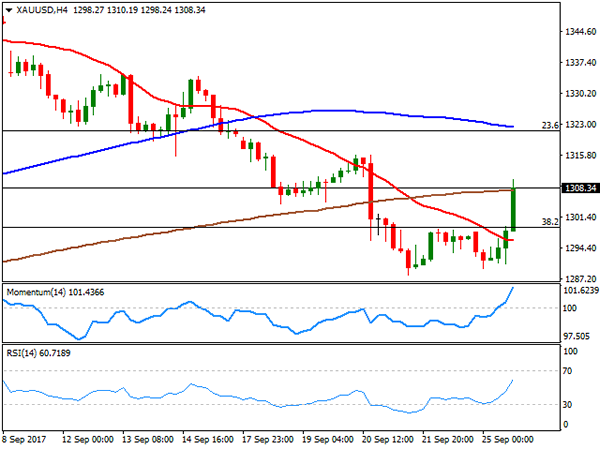
Gold prices skyrocketed through the 1,300.00 level, with spot trading as high as $1310.19 a troy ounce, its highest since last Wednesday, when Fed's monetary policy announcement sent it sharply lower. The commodity settled a few cents above 1,308.00, rallying as a result of renewed geopolitical jitters between the US and North Korea, after the N. Korean foreign minister said that the latest US Trump comments were a declaration of war. The commodity started the day with a soft tone, following EUR's lead which plunged following German's election outcome, trading as low as $1,289.49 a troy ounce before turning sharply up on risk aversion. Technically, the daily chart shows that the current recovery is not enough to revert the bearish tone, but at least took off some of the downward pressure, and left doors open for further recoveries, as technical indicators are recovering from oversold levels, whilst the price recovered above the 38.2% retracement of its latest bullish run at 1,299.00. Nevertheless and in the same chart, the price remains well below a still bearish 20 SMA, now converging with the 23.6% retracement of the same rally at 1,321.44. Shorter term, and according to the 4 hours chart, the commodity is poised to recover further, now trading above its 20 and 200 SMAs, and with technical indicators heading sharply higher above their mid-lines.
Support levels: 1,299.00 1,288.10 1,280.45
Resistance levels: 1,311.60 1,321.45 1,334.20
WTI CRUDE OIL
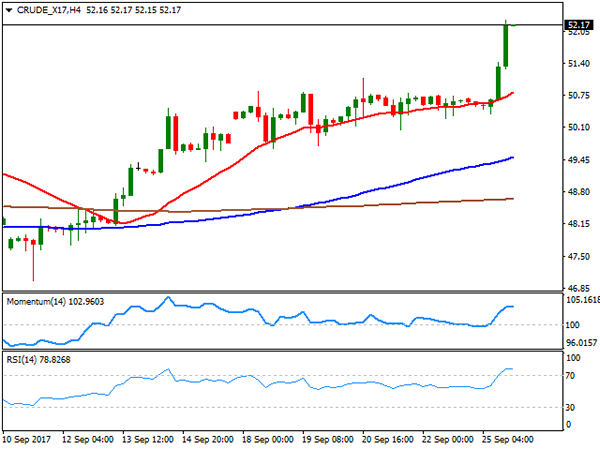
Crude oil prices rallied to fresh multi-month highs, with WTI futures ending the US session around $52.20 a barrel, adding roughly 3% on the day. The commodity found support on speculation the OPEC and non-OPEC producers who signed a pact to cut output last November, will extend its past its expiration date in March next year, alongside with hopes of increased demand, which will help the market rebalance. The US benchmark trades at its highest since last April, when it topped at 53.74, and technical readings in the daily chart support some further gains ahead, as the 20 SMA has overcome the 200 SMA, while technical indicators entered overbought territory with almost vertical bullish slopes. In the shorter term, and according to the 4 hours chart, the risk is also towards the upside, as technical indicators hold within overbought territory, losing upward strength amid decreasing volume at this time of the day, rather than signaling upward exhaustion. Also, the price has accelerated far above all of its moving averages, further supporting additional gains ahead for oil, moreover on an extension above52.26, the daily high and the immediate resistance.
Support levels: 51.65 50.90 50.40
Resistance levels: 52.25 52.90 53.70
DJIA
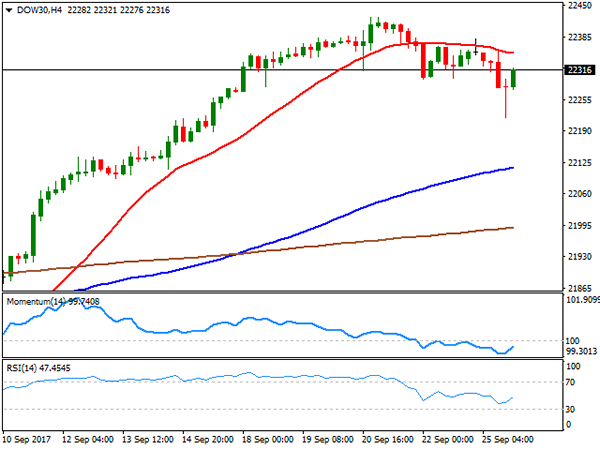
Wall Street closed in the red at the beginning of the week, as risk aversion, alongside with falling tech equities, undermined US indexes. The DJIA lost 53 points, to end at 22,296.09, while the Nasdaq composite shed 0.88% to end at 6,370.59. The S&P closed at 2,496.66 down 0.22%. Within the Dow, Exxon Mobil was the best performer, adding 1.34% amid a sharp advance in oil prices, followed by General Electric that gained 1.05%. Visa led decliners shedding 2.44%, followed by McDonald's that closed 1.64% lower. The Dow, however, ended the day well -off its daily low of 22,217, and the daily chart shows that the downward potential remains limited, given that technical indicators are barely retreating from overbought levels, as the price remains well above all of its moving averages. Shorter term, and according to the 4 hours chart, the index is still below its 20 SMA, while technical indicators have managed to recover partially within negative territory, reflecting the latest intraday bounce rather than suggesting further gains ahead.
Support levels: 22,297 22,258 22,216
Resistance levels: 22,370 22,424 22,475
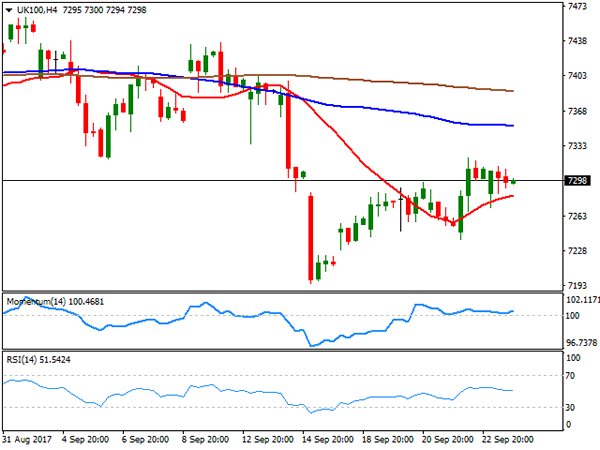
FTSE100
The FTSE 100 shed some ground this Monday, down 9 points or 0.13% to close at 7,301.29, affected by Pound's strength, early London and falling metal prices, weighing on mining-related currencies. Also, a report from the BOE warning about risks for credit growth hurt banking-related equities. Mediclinic International was the worst performer, down 5.14%, followed by Antofagasta and Anglo American, down over 3% each. ConvaTec led gainers, up 1.50%, followed by BT Group, which added 1.47%. The technical outlook for the index is little changed from Friday's view, as the index remains well below a bearish 20 SMA, also below the 100 SMA, while technical indicators remain within bearish territory, and particularly the RSI gains favors the downside, currently around 45. Shorter term, and according to the 4 hours chart, the index continues consolidating above a bullish 20 SMA, whilst technical indicators keep hovering above their mid-lines, with limited upward strength.
Support levels :7,280 7,236 7,195
Resistance levels: 7,344 7,381 7,422
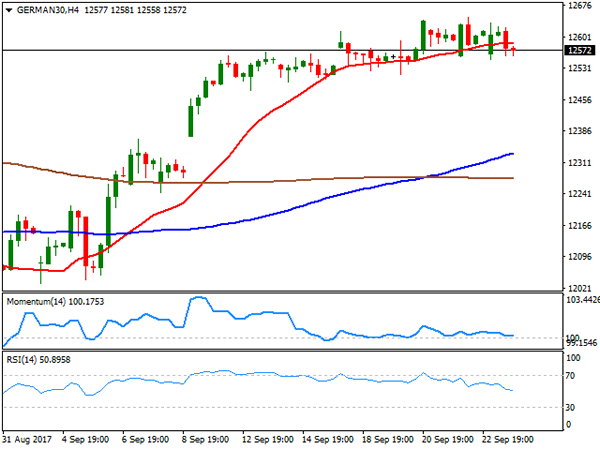
DAX
The German DAX added 2 points, to end the day at 12,594.81, as despite the EUR plunged, a decline in banking and mining-related equities dragged European indexes lower. Most members were down within the DAX, with RWE AG leading decliners, down 5.65%, followed by Commerzbank that lost 2.79%. The best performer was Merck, which added 1.97%, followed by Bayer up at the end of the day by 1.14%. The index remains within a consolidative stage, with no upward strength but with the downside potential limited, as the index holds far above all of its moving averages, whilst technical indicators are barely losing upward momentum holding near overbought levels. In the 4 hours chart, the index is neutral, but with an increased bearish potential, as the index closed below a horizontal 20 SMA, while the Momentum indicator holds flat around its 100 level, and the RSI indicator gains bearish traction, but currently at 49.
Support levels: 12,537 12,489 12,439
Resistance levels: 12,584 12,630 12,677
Technical Outlook: EURUSD Breaks Below Key Supports As Politics Continues To Produce Negative Impact
The Euro holds in red for the second day and broke below important supports at 1.1848/26 ( daily H&S pattern neckline / Fibo 61.8% of 1.1662/1.2092 upleg), signaling further downside.
Fresh weakness was triggered by politics with completion of reversal pattern, seen as strong bearish signal.
Bears are gaining momentum for test of immediate support at 1.1798 (rising 55SMA) and could stretch towards key short-term support at 1.1722/20 (top of thick daily cloud / Fibo 38.2% of 1.1118/1.2092 ascend) where bears are expected to face strong headwinds.
Near-term action favors selling upticks for extension towards daily cloud top, however, overall bullish picture sees current pullback as correction of broader uptrend which should ideally reverse at 1.1720.
From the fundamental side, negative impact from the politics is expected to fade and focus to turn towards the ECB as recent talks of rate hike and reduction of the QE program, expected to remain the key driver of the Euro.
Alternatively, loss of 1.1722/20 pivots would signal deeper correction and expose supports at 1.1662 (17 Aug trough) and 1.1605 (50% of 1.1118/1.2092).
Res: 1.1861, 1.1893, 1.1913, 1.1936
Sup: 1.1798, 1.1720, 1.1662, 1.1605
Geopolitical Risks In The Driving Seat Again
Demand for safe havens returned on Monday, as a new war of words between North Korea and the U.S. triggered a flight to safety amongst investors. The latest comments came from North Korea's foreign minister, Ri Yong-Ho, who accused the U.S. of ‘declaring war' and said that they have ‘every right to take countermeasures', including the right to shoot down U.S. strategic bombers, even when they are not inside the airspace border of their country. His comments sent gold above $1,310, while U.S. 10-year treasury yields declined four basis points. In currency markets, the classic safe havens, JPY and CHF, made sharp gains against their major counterparts, while equities in Asia followed Wall Street lower early Tuesday.
So far, every aggressive selloff in equities and move to safe havens on geopolitical risks, has proven to be short-lived. The best-case scenario is for the U.S. to add more pressure on China and Russia, to increase sanctions against Pyongyang and pressure Kim Jong-un to sit around a negotiation table. However, as an investor, you should keep all options on the table.
An exciting development was seen in options market, where the trading volume in CBOE's Volatility Index "VIX" surged yesterday to a new high. The price action was not significant, as the index peaked at 11.21, only to drop back 9% four hours later. This activity may be an early sign of anxiety among investors, who started to consider hedging their positions against a market correction. However, I suggest that you do not jump to conclusions from a single day of increased activity, as it may have been a speculative move. If trading volumes remain high in the next couple of days, then markets are seriously expecting a considerable correction in equity markets.
Tensions between the U.S. and North Korea were not the only reason for the drop in U.S. treasury yields. The Federal Reserve's well-known dove Charles Evans, sounded less hawkish in his remarks in to the Economic Club of Grand Rapids. He said the Fed should wait until there are clear signs that American paychecks and prices are rising, before raising rates again. So far, there are no signs that inflation or wages will pick up in the next couple of months. The comments made by Evans may be overshadowed by speeches from Neel Kashkari and Janet Yellen later today, which will most likely have a stronger impact on the shape of the yield curve.
Oil prices were also making headlines, as Brent hit its highest levels in over two years yesterday, closing above $59. Tighter supplies and growing demand contributed heavily to the recent 33% surge from July lows. However, the 3.8% move on Monday was driven by threats from Turkey to cut crude flows from the Kurdistan region, as they seek their independence from Iraq. The Kurdistan region of Iraq currently produces around 650,000 barrels per day, of which 85% goes through the Turkish pipelines. If the Turks decided to cut crude flows, it would create a shock which markets are currently pricing in. However, I think this is going to be only a temporary threat, given that independence will not happen overnight and OPEC members will quickly cover the shortage. In my opinion, the spread between Brent and WTI has gone too far and should shrink back towards $4-5.
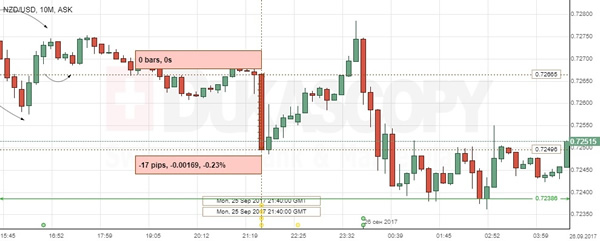
NZD/USD: NZ Trade Balance
The NZD/USD exchange rate dropped markedly on the New Zealand's trade balance data late Monday. The Kiwi lost against the US Dollar 17 base points or 0.23% to touch the 0.7249 mark and to rebound gradually, though the trading session continued in the weaker area of 0.7240-0.7250, where the post-election uncertainties kept supporting the bearish sentiment in the pair.
Statistics New Zealand reported that the country's trade balance marked a NZ$1235M deficit for the month of August, compared with expectations for a fewer deficit of NZ$825M. The Market also remained watching any sings from the Reserve Bank of New Zealand, as its hawkish tone could strengthen the Kiwi.
USD/CAD Daily Outlook
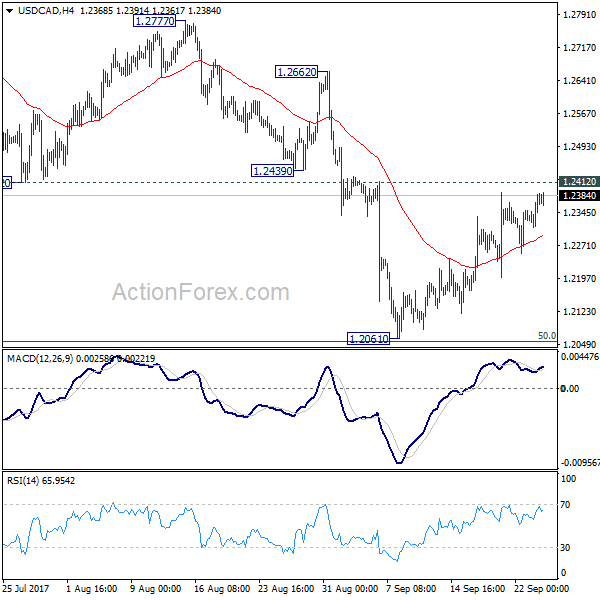
Daily Pivots: (S1) 1.2326; (P) 1.2355; (R1) 1.2399; More....
Intraday bias in USD/CAD remains neutral as consolidation from 1.2061 is still in progress. At this point, we'd remain cautious on strong support from 1.2048 to bring sustainable rebound. But still, break of 1.2439 support turned resistance is needed to be the first sign of trend reversal. Otherwise, outlook will remain bearish. Firm break of 1.2048 will pave the way to next fibonacci level at 1.1424. Break of 1.2412 will bring stronger rise back to 55 day EMA (now at 1.2531) and above.
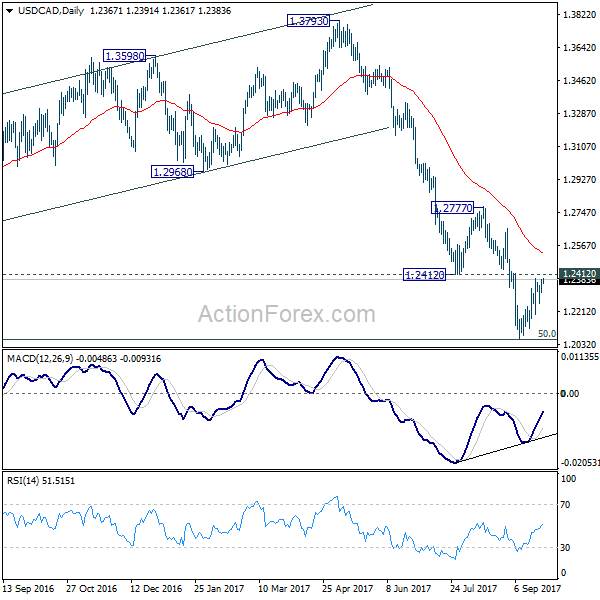
In the bigger picture, focus remains on 50% retracement of 0.9406 to 1.4869 at 1.2048. As long as this level holds, we'd still favor that case that fall from 1.4689 is a correction. Rebound from 1.2048 could extend the larger up trend from 0.9406. However, firm break of 1.2048 will indicate that fall from 1.4689 is at least a medium term down trend and should target 61.8% retracement at 1.1424 and below.
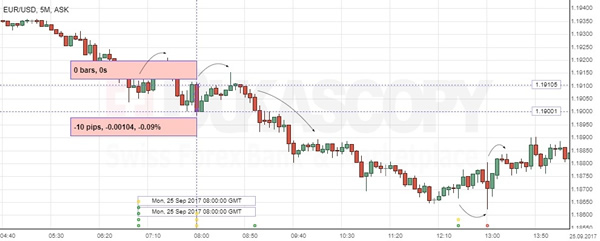
EUR/USD: German Ifo Business Climate
EUR/USD attempted to rebound from the 1.1860 mark after a lingering downmove, which was additionally fuelled by the weak Ifo economic report. Following the publication, the Euro lost against the Greenback 10 base points or 0.09%, while the bearish sentiment was sustained putting the pair to the monthly low.
The Ifo Institute for Economic Research reported on Monday that its Business Climate Index dropped to 115.2 in September, reflecting unclarities surrounding the German Federal Election, which left Angela Merkel in front of tricky coalition negotiations. Statement showed that firms were less satisfied with both current situation and near-term outlook, as the country's economy entered the period of new legislation.