
Sample Category Title
EUR/USD – Euro Slips To 4-Week Low, US Consumer Confidence, Housing Reports Next
The euro has posted losses on Tuesday, continuing the downward trend which marked the Monday session. Currently, EUR/USD is trading at 1.1803, down 0.33% on the day. On the release front, the sole eurozone event, German Import Prices, came in at 0.0%, shy of the forecast of 0.1%. Still, the reading ended a streak of five straight declines. In the US, today's key indicators are CB Consumer Confidence and New Home Sales. Later in the day, Fed Chair Janet Yellen will speak at an event in Cleveland. On Wednesday, the US will release Core Durable Goods Orders and Pending Home Sales.
Angela Merkel easily won the German election on Sunday, but her win has been described as a “nightmare victory”. This sentiment has pushed the euro downwards, as EUR/USD is currently trading at its lowest level since August 25. Merkel's CDU won 33 percent of the vote and will be the largest party in parliament, but arduous negotiations await as Merkel will have to cobble together a coalition in order to form a government. The center-left SFD, which won 20 percent of the vote, announced that it will not join the CDU, so Merkel will have to negotiate with smaller parties. The far-right AFD ran on a far-right, anti-immigrant platform, and the party's surge in support has sent shock waves in Germany and across Europe. The AFD can be ruled out as a coalition partner, which leaves the Greens and the pro-business FDP party as the most likely configuration. However, the FDP has insisted on the powerful finance portfolio and will likely try to reduce German transfer payments to the European Union. These views run counter to Merkel's vision of taking steps to more closely integrate the European Union, particularly as Britain is on its way out of the club.
Federal Reserve policymakers have been divided over a rate hike in December, which would mark a third rate increase in 2017. With no clear message from the Fed, the markets really don't know what to expect, and fed futures have priced in a December hike at 55%. On Monday, New York Fed President William Dudley made a strong case to raise rates. Dudley cited a soft US dollar and strong global growth as reasons why inflation would increase and also translate into stronger wage growth. Dudley said he expects inflation to reach the Fed's target of 2 percent in the “medium term”, and predicted that the Fed would continue to gradually remove monetary accommodation. In last week's rate statement, the Fed announced that it would reduce its $4.2 trillion balance sheet by $50 billion/mth, starting in October.
Technical Outlook: WTI Oil Hit 5-Month High On Turkey’s Threats To Cut Kurdish Exports
WTI Oil is consolidating under fresh five-month high at $52.41, after the price was boosted by threats from Turkey to cut oil exports from Iraq's Kurdistan region.
Threats come as intensified pressure on the Kurdish autonomous region over its independence referendum which is expected to show a comfortable majority in favor of independence.
This provide strong support to oil prices, as reduced supply, combined with production cut from top oil producers, could raise concerns about tighter crude supply and further boost oil price.
WTI oil price rose strongly on Monday, marking the biggest one-day gains since 18 Aug.
The price is riding on the third wave of five-wave sequence from $45.57, which met its FE 138.2% at $52.30 and could extend to $53.21 (FE 161.8%).
Meanwhile, bulls may take a breather on overbought daily conditions. Rising 10SMA underpins the action (currently at $50.51) should ideally contain dips.
Res: 52.41, 53.00, 53.21, 53.77
Sup: 51.63, 51.09, 50.77, 50.51
Technical Outlook: AUDUSD – Bears Pressure Daily Cloud Top
The Aussie dollar extends weakness from the previous day and approaches key support at 0.7905 (daily cloud top) pressured by fresh concerns over North Korea. Fresh bears are on track to fully retrace last Friday's recovery which was capped at 0.7986, as the price returned below cracked Fibo support at 0.7929 (Fibo 61.8% of 0.7807/0.8124 upleg) Pressure on cloud top which underpinned the action in past few weeks is rising and eventual penetration into daily cloud (spanned between 0.7905 and 0.7794) would signal further easing. Bearish setup of daily MA's and Momentum studies in the negative territory are supportive, however, bears may show hesitation at cloud top as slow stochastic is oversold on daily chart. Corrective upticks are expected to be limited and offer selling opportunities while key barriers at 0.8000 zone (converged daily Kijun-sen/Tenkan-sen) stay intact. Only sustained break here would neutralize and provide fresh bullish signal.
Res: 0.7948; 0.7973; 0.7986; 0.8005
Sup: 0.7905; 0.7882; 0.7865; 0.7807
Trade Idea: GBP/USD – Sell at 1.3535
GBP/USD – 1.3472
Original strategy :
Sell at 1.3620, Target:1.3420, Stop: 1.3680
Position: -
Target: -
Stop: -
New strategy :
Sell at 1.3535, Target:1.3335, Stop: 1.3595
Position: -
Target: -
Stop:-
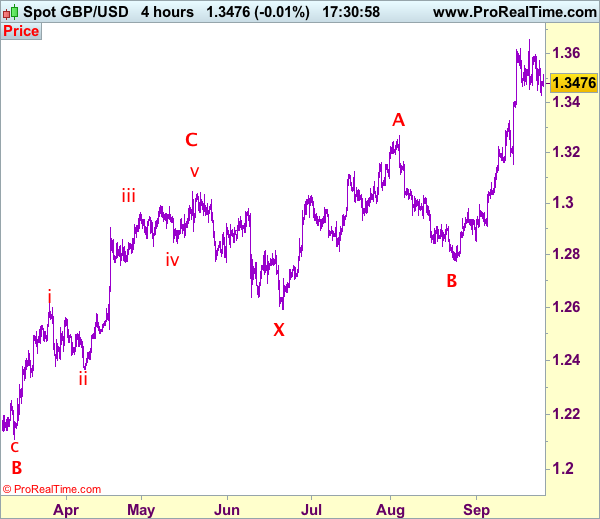
As cable met renewed selling interest at 1.3571 yesterday and slipped again, retaining our view that further consolidation below last week’s high at 1.3658 would be seen and mild downside bias remains for the fall from 1.3658 to bring retracement of recent rally to 1.3380-85, then 1.3350 but reckon 1.3300-10 would hold from here.
In view of this, we are looking to turn short on recovery as 1.3540-50 should limit upside. Above said resistance at 1.3571 would risk test of 1.3600 but break of latter level is needed to signal pullback from 13658 (last week’s post-Fed high) has ended, bring retest of this level later. break there would signal recent upmove has resumed for headway to 1.3700-10 first. Our preferred count is that (pls see the attached chart) the wave IV is unfolding as a complex double three (ABC-X-ABC) correction with 2nd wave B ended at 1.2774, hence 2nd wave C is unfolding and may extend further gain to 1.3650, then 1.3700, however, overbought condition should limit upside to 1.3770-75 and reckon 1.3800-10 would hold from here, bring retreat later.
Our preferred count on the daily chart is that cable's rebound from 1.3500 (wave (A) trough) is unfolding as a wave (B) with A ended at 1.7043, followed by triangle wave B and wave C as well as wave (B) has ended at 1.7192, the subsequent selloff is the larger degree wave (C) which is still unfolding with minor wave (III) of larger degree wave 3 ended at 1.1986, hence wave (IV) correction is in progress which could either be a triangle wave (IV) of a complex formation but upside should be limited to 1.3500 and price should falter well below 1.4000, bring another decline in wave (V) of 3 for weakness to 1.1500, then 1.1200.
Trade Idea: GBP/JPY – Sell at 151.80
GBP/JPY - 150.55
Original strategy:
Sell at 152.00, Target: 150.00, Stop: 152.50
Position: -
Target: -
Stop: -
New strategy :
Sell at 151.80, Target: 149.80, Stop: 152.40
Position: -
Target: -
Stop:-
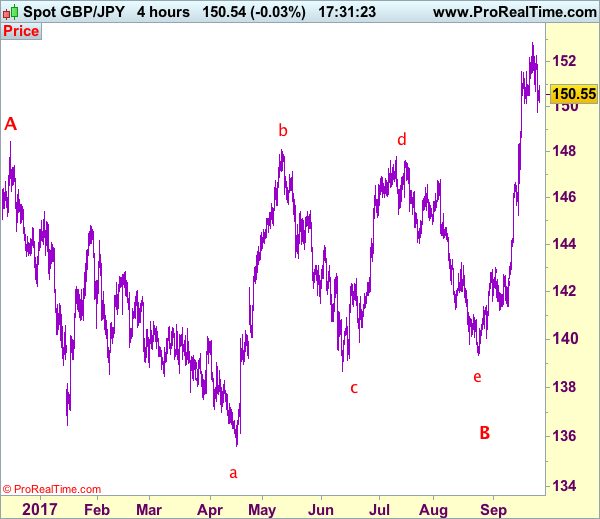
Although sterling recovered after finding support at 149.75, if our view that a temporary top form at 152.85 is correct, upside should be limited to 151.80-90 and bring another decline, below said support at 149.75 would add credence to this view, bring retracement of recent rise to 148.90-00, however, only a drop below there would retain bearishness and bring retracement of recent rise to 148.50 and then 148.00 later.
In view of this, we are looking to sell sterling on recovery as 151.80-90 should limit upside. Above 152.25-30 would risk retest of said last week’s high at 152.85 but break there is needed to signal recent upmove has once again resumed and extend headway to 153.00-10 and possibly towards 153.50-60, however, 154.00 should hold, risk from there has increased for a retreat to take place later.
Our preferred count is that larger degree wave V with circle is unfolding from 251.12 with wave (I) 219.34, (II): 241.38 and wave (III) is subdivided into 1: 192.60, 2: 215.89 (23 Jul 2008) and wave 3 ended at 118.87 earlier in 2009. The correction from there to 162.60 is wave 4 which itself is a double three and is labeled as first a-b-c ended at 151.53, followed by wave x at 139.03, 2nd a ended at 162.60, 2nd b at 146.75 and 2nd c leg of wave 4 ended at 163.00. Therefore, the decline from 163.00 to 116.85 is now treated as wave 5 which also marked the end of larger degree wave (III), hence wave (IV) major correction has commenced for retracement of the wave (III) from 241.38 and upside target at 183.95-00 (50% Fibonacci retracement of the wave (II) from 241.38) had been met, a drop below 160.00 would suggest wave (IV) has ended at 195.85, bring decline in wave (V) for initial weakness to 130 (already met) and 120.
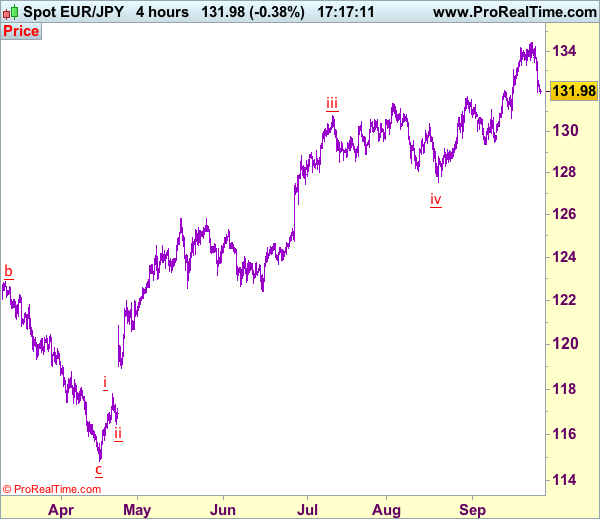
Trade Idea: EUR/JPY – Sell at 132.90
EUR/JPY - 132.08
Original strategy:
Sell at 133.90, Target: 132.30, Stop: 134.50
Position: -
Target: -
Stop: -
New strategy :
Sell at 132.90, Target: 131.30, Stop: 133.50
Position: -
Target: -
Stop:-
As the single currency has dropped quite sharply yesterday and has remained under pressure, adding credence to our view that a temporary top has been formed at 134.41 last week, hence consolidation below this level would be seen with mild downside bias for weakness to 131.50, then 131.00-05 break there would bring retracement of recent upmove towards support at 130.62 which is likely to hold from here due to near term oversold condition.
In view of this, we are looking to sell euro on recovery but at a lower level as 132.90-00 should limit upside. Above previous support at 133.43 would abort and suggest at least first leg of decline from 134.41 has ended, bring a stronger rebound to 133.90-00 but still reckon said resistance at 134.41 would remain intact, bring further consolidation.
Our latest preferred count is that wave (ii) is ABC-X-ABC which ended at 123.33 and wave (iii) is unfolding with wave iii ended at 100.77, followed by wave iv at 111.57 and wave v as well as the wave (iii) has ended at 97.04, followed by wave (iv) at 111.43 and wave (v) has ended at 94.12 which is also the end of the larger degree v, this also implied the major wave (C) has also ended there, hence major correction has commenced from there with (A) leg unfolding in its lower degree wave c which has possibly ended at 145.69. Under this count, A-B-C wave (B) has commenced with A leg ended at 136.23, wave B at 143.79 and wave C has possibly ended at 149.79.
Our larger degree count is that the decline from 139.26 is wave (C) and is sub-divided into a diagonal triangle i-ii-iii-iv-v with wave i - 105.44, wave ii- 123.33, wave iii - 97.03, wave iv - 111.43, followed by the final wave v as well as the end of wave (C) at 94.12, this also mark the bottom of larger degree wave B. Under this count, major rise in wave C has commenced as an impulsive wave with minor wave III ended at 145.69, wave V is still in progress for further gain to 150.00. Having said that, this so-called wave V could well be the first leg of larger degree 5-waver wave C and this wave C should bring at least a retest of wave A top at 169.97 (July 2008).
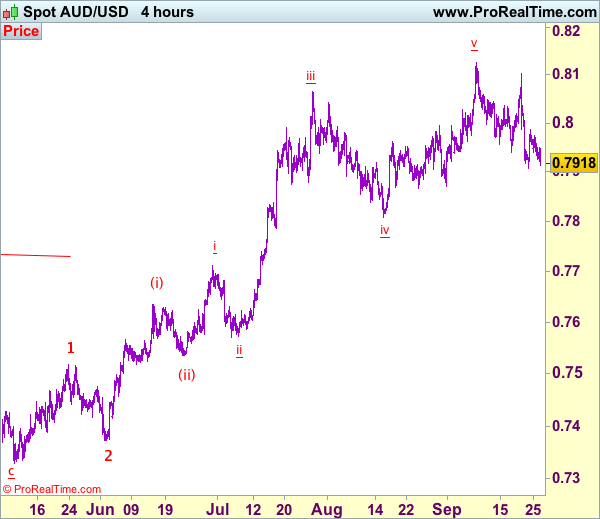
Trade Idea: AUD/USD – Sell at 0.8040
AUD/USD – 0.7925
Original strategy:
Sell at 0.8040, Target: 0.7840, Stop: 0.8100
Position: -
Target: -
Stop:-
New strategy :
Sell at 0.8040, Target: 0.7840, Stop: 0.8100
Position: -
Target: -
Stop:-
As aussie has remained under pressure after dropping sharply to 0.7908 late last week, retaining our bearishness for the corrective fall from 0l8125 top to bring retracement of recent upmove, below said support at 0.7908 would extend weakness to support at 0.7967-71, having said that, break there is needed to confirm temporary top has been formed at 0.8125 earlier this month, bring retracement of recent rise to 0.7800 first.
In view of this, we are looking to sell aussie again on recovery as 0.8040-50 should limit upside. Above said resistance at 0.8103 would abort and risk retest of 0.8125 but break of latter level is needed to confirm upmove has resumed and extend gain to 0.8150-60, then towards 0.8200 later.
On the 4-hour chart, recent upmove from 0.7329 is unfolding as an impulsive rise with wave 3 as well as smaller degree wave (iii) extending, only minor wave v of (iii) has ended at 0.8125, hence bullishness remains for this move to extend headway to 0.8200, then towards 0.8300, however, reckon upside would be limited to 0.8400 and the final wave 5 should falter below 0.8500, bring correction later.
USD Better Bid, NZD In The Doldrum Amid Drop In Business Confidence
NZD slides as business confidence falls
The New Zealand dollar extended losses on Tuesday amid a massive in business confidence. During the Asian session, the Kiwi fell 0.60% against the greenback as it reached $0.7215. Business confidence tumbled to zero, the lowest level since September 2015, compared to 18.3 in August. The drop came amid a significant deterioration of expected business conditions, especially in the manufacturing industry. In addition, the uncertainty stemming from Saturday’s election as there was no clear winner. The ruling National Party got only 46% of the vote, while the opposition (composed of the Labour party and the Green) acquired roughly 42% of the vote. The Kiwi is ahead of a difficult periods as the uncertainty will last several weeks. Indeed, both sides will try to get the support of the NZ First Party to build a coalition government.
Investors, and especially leveraged speculators, already started to reduce their long speculative positions. Net long non-commercial futures positions accounted for roughly 63% of total open interest in early August. As of last week, this number decrease to 18%, suggesting that the Kiwi is running out of steam.
From a technical standpoint, a key support can be found at $0.7146 (200-dma), while on the upside the 0.73 area will act as main short-term resistance (50-dma and 38.2% Fibonacci level on July - August retracement). On the medium-term, NZD/USD continues to trade within its downtrend channel. A return towards $0.70 cannot be ruled, especially now that the Federal Reserve in the US is set to tighten monetary policy further in December, while having already announced the beginning of its balance unwinding for October.
Fed Speakers up next
For those in the small minority that enjoys Fed speak, then today is the day for you. For the rest of us we will have to suffer through the microanalysis of language and rogue volatility. The question of the day is where US inflation is. By all accounts, inflation should be significantly higher which makes trading precarious since a reflection point could be anytime. Friday PCE read, or a year from now. A repricing of the Fed shallow curve has plenty of room to run, sending yields and therefore USD higher. In our view, there is growing superficial evidence and general improvement in consumer inflation that suggests we are near to the event. There are six fed speakers today, making expectations for market driving headlines high.
New York Fed President Dudley started the precession sounding hawkish attributing recent inflation weakness to “temporary, idiosyncratic factors” Markets focus will be on Fed Chair Yellen’s speech, which is specifically on inflation and monetary policy (“Inflation, Uncertainty, and Monetary Policy”) in Cleveland Ohio. We anticipate her to reiterate comments at the FOMC press conference last week. Yellen’s comments at the September FOMC meeting were deemed hawkish, causing market to re-price in a December rate hike at 60%.
We suspect there is stillroom for markets to push Fed pricing higher yet unlikely that any of Yellen’s comments will move the needle. With year of discounting the Fed overly, optimistic projections, markets need to see a solid inflation data trend (which makes Friday PCE read so important). Governor Brainard speaking on “Labor Market Disparities” will also have the markets attention. US front-end rally has stalled with 2yr yields stuck at 1.40% yet US/EU rate spread continue to tick higher creating headwinds from EURUSD. Should Yellen increase the hawkish amplitude or we get Core PCE at 1.5% (or higher), trader should watch out for a sudden and sharp USD recovery.
WTI Oil Futures Turn Neutral After Rally Ends Near 5-Month High
WTI oil futures turned sharply bullish in the short term after surging from the 50-handle to hit a high of 52.40, a level not seen since April 19. The upward trajectory lost steam and the market is now capped at this 5-month high.
The broader trend is bullish ever since prices bounced off the 47 area on September 11. The market entered a consolidation phase on September 15 and traded in a range between 49.65 and 51.09 until the break out yesterday. The market is neutral again after becoming overbought, as indicated by the RSI rising above 70 on the 4-hour chart.
While upside momentum has weakened, the underlying trend higher has potential to extend since momentum oscillators are in bullish territory and the short-term moving averages are positively aligned after the 20-period MA crossed above the 50-period MA.
Support is expected at yesterday’s low of 51.18 ahead of the key 50-level and range-low of 49.65. A deeper extension lower would shift the bias to the downside to target the September 14 low of 49.13 and then 48.11 (20 MA support). From here the key 47-level comes into view as major support.
Resistance at 52.40 will likely be challenging to break. If successful, there is scope to rise towards the 53 level and reach the next major peak at 53.73 (April 12 high).
In the near term, WTI oil is expected to trade in a choppy range. The bullish trend from the end of August is expected to remain intact. Only a drop below 49 would end the short-term bullish outlook.
Safe Havens Gain As The ‘War Of Words’ Escalates
The recent 'war of words' between the US and North Korea escalated further yesterday, after the regime's foreign minister said that a tweet from US President Trump over the weekend amounted to a 'declaration of war'. Given this declaration, North Korea has the right to shoot down US bombers even outside of its own airspace, the minister added. Even though this is not the first time North Korea has made war claims, the continued intensification in rhetoric may have put the prospect of military conflict back on the investors' radar.
Markets reacted in a classic risk-off manner. Safe haven assets such as the JPY, CHF, and gold, all spiked higher on the news, while equity indices tumbled. Focus now turns back to Trump. If his response is along the same 'fire and fury' wavelength, the latest price action could continue. We could see another round of risk aversion that benefits haven assets and weighs on riskier ones. On the other hand, a more diplomatic approach, such as an official statement from the White House instead of a tweet, could lower the likelihood of armed conflict and thereby reverse some of the latest market moves.
Looking at the big picture, although another round of fiery rhetoric could keep safe havens supported for a while, we maintain our view that as long as this does not translate into actual war, investors are likely to place less and less emphasis on this crisis moving forward. Rhetoric alone is unlikely to continue driving markets for long.
USD/JPY traded lower yesterday following North Korea's rhetoric. The pair fell below the support (now turned into resistance) of 111.80 (R1) and now looks to be headed for a test near the key territory of 111.00 (S1). That hurdle acted as the upper bound of the prior sideways range that's been in place from the 28th of July until the 18th of September. As such, as long as the rate is trading above that level, we consider the short-term outlook to still be cautiously positive. If the bulls manage to take charge near 111.00 (S1), we would expect them to aim for another test near 111.80 (R1). If they overcome it, then they may target our next resistance of 112.70 (R2).
As for the bigger picture, we still see a longer-term sideways range between 108.70 and 114.30. The fact that the latest recovery started from near the lower bound of the range enhances our view that the pair may rebound again and trade higher, perhaps aiming for the upper bound in the foreseeable future.
Oil prices edge higher as Erdogan threatens the Kurds
Oil surged yesterday, after Turkish President Erdogan threatened to 'close the tap' and cut oil flows from Iraq's Kurdish region to the rest of the world. These remarks followed an independence referendum by Iraqi Kurds on Monday. Given this fresh risk of supply disruptions, we see the case for oil to remain supported for a few days, especially considering that Erdogan could follow-up his threat and push prices even higher. Looking further ahead, the next major theme in the oil market will probably be the OPEC meeting in late-November. Even though there are still eight weeks left until that gathering, speculation for a potential extension or expansion of the current deal could begin well ahead of that time.
WTI surged yesterday on Erdogan's threats. The price emerged above the key resistance (now turned into support) of 51.50 (S2) and subsequently, it broke above 52.00 (S1). The price structure on the 4-hour chart suggests a short-term uptrend and thus, there is the possibility for crude oil to challenge the 53.00 (R1) territory soon. Having said that though, even if WTI continues to trade north for a while, we remain skeptical on whether a healthy long-term uptrend can be established. The price has entered the longer-term sideways range, between 51.50 (S2) and 55.30 (R3), where we believe US shale producers may be attracted to increase production. Something like that may put a lid on any future gains.
Today's highlights:
We only get second-tier indicators from the US today. The Case-Shiller house price index for July is forecast to have accelerated somewhat in yearly terms, while new home sales are expected to have risen in August. We also get the Conference Board consumer confidence index and the Richmond Fed composite index, both for September.
We have five speakers on the agenda. From the Fed, Chair Yellen, Cleveland President Mester, Atlanta President Bostic, and Board Governor Brainard, will all speak. We will also hear from ECB Executive Board member Praet. Markets may focus mainly on Yellen, but since we already heard from her last week, any reaction may be limited.
USD/JPY
Support: 111.00 (S1), 110.60 (S2), 110.00 (S3)
Resistance: 111.80 (R1), 112.70 (R2), 113.60 (R3)
WTI
Support: 52.00 (S1), 51.50 (S2), 51.00 (S3)
Resistance: 53.00 (R1), 54.00 (R2), 55.30 (R3)