
Sample Category Title
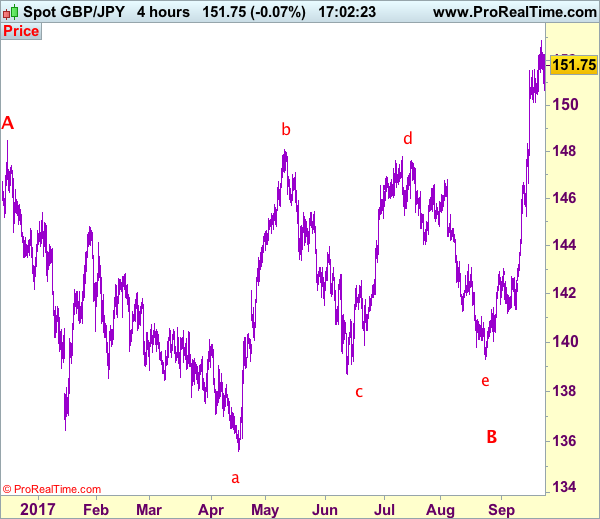
Trade Idea: GBP/JPY – Sell at 152.00
GBP/JPY - 151.70
New strategy :
Sell at 152.00, Target: 150.00, Stop: 152.50
Position: -
Target: -
Stop:-
Although sterling rebounded after finding support at 150.70, reckon upside would be limited to 152.25-30 and bring further consolidation below last week’s high at 152.85, hence mild downside bias is seen for another corrective fall, below said support at 150.70 would bring weakness towards support at 150.15, however, a firm break below there is needed to suggest a temporary top is possibly formed, bring further fall to 149.70-80, then towards 148.90-00, only a drop below there would add credence to this view, bring retracement of recent rise to 148.50 and then 148.00 later.
In view of this, we are looking to sell sterling on recovery as 152.00 should limit upside. Above 152.25-30 would risk retest of said last week’s high at 152.85 but break there is needed to signal recent upmove has once again resumed and extend headway to 153.00-10 and possibly towards 153.50-60, however, 154.00 should hold, risk from there has increased for a retreat to take place later.
Our preferred count is that larger degree wave V with circle is unfolding from 251.12 with wave (I) 219.34, (II): 241.38 and wave (III) is subdivided into 1: 192.60, 2: 215.89 (23 Jul 2008) and wave 3 ended at 118.87 earlier in 2009. The correction from there to 162.60 is wave 4 which itself is a double three and is labeled as first a-b-c ended at 151.53, followed by wave x at 139.03, 2nd a ended at 162.60, 2nd b at 146.75 and 2nd c leg of wave 4 ended at 163.00. Therefore, the decline from 163.00 to 116.85 is now treated as wave 5 which also marked the end of larger degree wave (III), hence wave (IV) major correction has commenced for retracement of the wave (III) from 241.38 and upside target at 183.95-00 (50% Fibonacci retracement of the wave (II) from 241.38) had been met, a drop below 160.00 would suggest wave (IV) has ended at 195.85, bring decline in wave (V) for initial weakness to 130 (already met) and 120.
Trade Idea: EUR/JPY – Sell at 133.90
EUR/JPY - 134.29
Original strategy:
Buy at 132.40, Target: 134.40, Stop: 131.80
Position: -
Target: -
Stop: -
New strategy :
Sell at 133.90, Target: 132.30, Stop: 134.50
Position: -
Target: -
Stop:-
As the single currency met resistance at 134.24 earlier today and has slipped again since, suggesting a temporary top has been formed at 134.41 last week, hence consolidation below this level would be seen with mild downside bias for weakness to 132.95-00, break there would add credence to this view, bring retracement of recent upmove to 132.50, then 132.25-30 but reckon previous resistance at 132.01 would turn into support and contain euro’s downside.
In view of this, we are looking to sell euro on recovery as 133.90-00 should limit upside. Only break of said intra-day resistance at 134.24 would abort and signal the retreat from 134.41 has ended, bring retest of this level, break there would extend recent upmove to 135.00-10, however, overbought condition should limit upside and reckon 135.55-60 would hold from here, price should falter below 136.00-10, risk from there is seen for a retreat to take place later.
Our latest preferred count is that wave (ii) is ABC-X-ABC which ended at 123.33 and wave (iii) is unfolding with wave iii ended at 100.77, followed by wave iv at 111.57 and wave v as well as the wave (iii) has ended at 97.04, followed by wave (iv) at 111.43 and wave (v) has ended at 94.12 which is also the end of the larger degree v, this also implied the major wave (C) has also ended there, hence major correction has commenced from there with (A) leg unfolding in its lower degree wave c which has possibly ended at 145.69. Under this count, A-B-C wave (B) has commenced with A leg ended at 136.23, wave B at 143.79 and wave C has possibly ended at 149.79.
Our larger degree count is that the decline from 139.26 is wave (C) and is sub-divided into a diagonal triangle i-ii-iii-iv-v with wave i - 105.44, wave ii- 123.33, wave iii - 97.03, wave iv - 111.43, followed by the final wave v as well as the end of wave (C) at 94.12, this also mark the bottom of larger degree wave B. Under this count, major rise in wave C has commenced as an impulsive wave with minor wave III ended at 145.69, wave V is still in progress for further gain to 150.00. Having said that, this so-called wave V could well be the first leg of larger degree 5-waver wave C and this wave C should bring at least a retest of wave A top at 169.97 (July 2008).

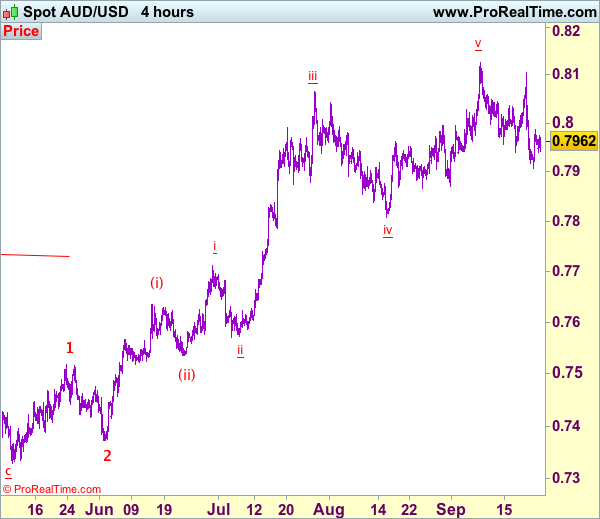
Trade Idea: AUD/USD – Sell at 0.8040
AUD/USD – 0.7965
Original strategy:
Sell at 0.8040, Target: 0.7840, Stop: 0.8100
Position: -
Target: -
Stop:-
New strategy :
Sell at 0.8040, Target: 0.7840, Stop: 0.8100
Position: -
Target: -
Stop:-
As aussie found support at 0.7908 late last week and has rebounded since, retaining our view that consolidation above this level would be seen and corrective bounce to 0.8000 cannot be ruled out, however, reckon upside would be limited to 0.8040-50 and bring another decline later, below said support at 0.7908 would extend weakness to support at 0.8967-71, having said that, break there is needed to confirm temporary top has been formed at 0.8125 earlier this month, bring retracement of recent rise to 0.7800 first.
In view of this, we are looking to sell aussie again on recovery as 0.8040-50 should limit upside. Above said resistance at 0.8103 would abort and risk retest of 0.8125 but break of latter level is needed to confirm upmove has resumed and extend gain to 0.8150-60, then towards 0.8200 later.
On the 4-hour chart, recent upmove from 0.7329 is unfolding as an impulsive rise with wave 3 as well as smaller degree wave (iii) extending, only minor wave v of (iii) has ended at 0.8125, hence bullishness remains for this move to extend headway to 0.8200, then towards 0.8300, however, reckon upside would be limited to 0.8400 and the final wave 5 should falter below 0.8500, bring correction later.
Elliott Wave Analysis: USDCAD Trading In A Temporary Correction
USDCAD is trading bearish overall, but on 4h chart we see price rising. This rising price action may only be temporary, as we see price trading within a complex correction of wave 4. Ideally a double zig-zag pattern is in the making within wave 4, which may search for resistance near the Fibonacci ratios of 23.6 or higher near the 38.2. resistance zone. Previous swing high at 1.2414 and 1.2668 level can also offer resistance and turning points.
USDCAD, 4H
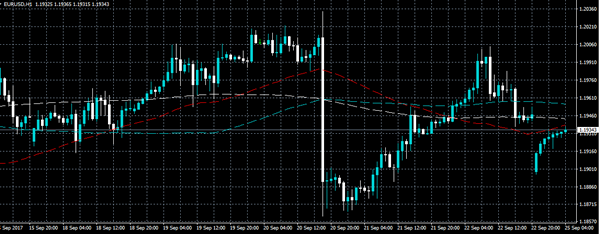
Daily Technical Analysis: EUR/USD – Common Gap After The German Election Result
Chancellor Merkel managed to win a fourth term in Germany's election on Sunday, but her victory was a bit over-shadowed by the hard-right AfD party which has won 13.3 % according to the source. The EUR/USD reacted with a common gap (head and shoulders, tradable) and I have predicted a possible gap close on Twitter, straight after the market opened. The has gap almost closed getting only 6 pips away from the Friday market close. At this point the market is still undecided as we have few possible scenarios. The main trend is still up but we might see a dip before the rally. 1.1890-1.1900 is the POC zone (W L3, D L4, channel low, ATR low) and we could see a spike towards 1.1965 and 1.1984, the projected high/ D H4. If 1.1890 is taken out, the price could drop to 1.1880 and 1.1850 W L4/ ATR projected low. Volatility is not high at all at this point so the price is a bit calm. More on the EUR/USD movement will be shown in today's webinar so don't forget to sign up.
W H3 - Weekly Camarilla Pivot (Weekly Interim Resistance)
W H4 - Weekly Camarilla Pivot (Strong Weekly Resistance)
D H4 - Daily Camarilla Pivot (Very Strong Daily Resistance)
D L3 – Daily Camarilla Pivot (Daily Support)
D L4 – Daily H4 Camarilla (Very Strong Daily Support)
POC - Point Of Confluence (The zone where we expect price to react aka entry zone)
Pound Looks Past Downgrade
The British pound has recovered well-above the 1.3500 handle against the U.S dollar, after international credit rating agency Moody's downgraded the United Kingdom's late on Friday, whilst confirming the UK's current outlook.
Following the credit downgrade, the GBPUSD pair fell to 1.3450, but has now recovered nearly 100-pips towards the 1.3550 handle, with the pair now trading above its weekly pivot point, located at 1.3535.
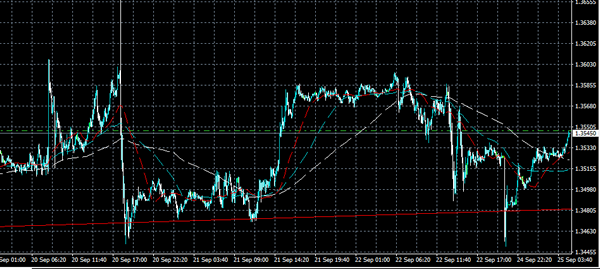
The GBPUSD pair remains bullish in the medium and long-term, but range-bound conditions persist on an intraday basis.
A higher time-frame close below the channel-top at 1.3481 should accelerate GBPUSD selling, whilst a higher time frame price close above the weekly time-frame down-slopping trendline, found at 1.3618, should further encourage GBPUSD buying.
Key intraday technical resistance is found at 1.3553, 1.3568 and 1.3585. Above 1.3585, further intraday resistance is found at 1.3595 and 1.3618.
To the downside, key intraday support is found between the daily and weekly GBPUSD pivot points, at 1.3535-38. Further intraday support comes from the M5 time-frame 200 period moving average, at 1.3517 and the recent swing low, at 1.3497.
Euro Quickly Recovers 1.1900 Handle
The EURUSD pair has reacted negatively to the weekend's German Federal Elections, which saw German Chancellor Angela Merkel regain power. However, her CDU party lost ground to other-parties, including the far-right AfD party, who won enough votes to enter German parliament.
On the market open, the EURUSD spiked lower to 1.1897, but has quickly recovered initial intraday losses, with price-action now trading around the former weekly EURUSD pivot point, at 1.1938.
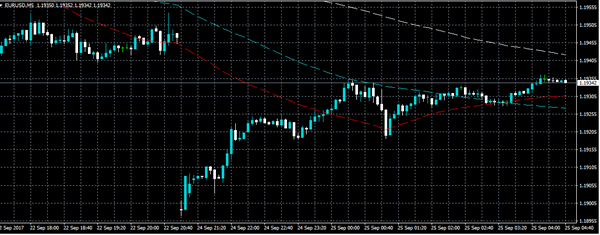
The EURUSD is currently range-bound between 1.1897-1.2006, with the pair lacking follow-through above 1.1900, with buyers also undecided above the 1.2000 level.
A definitive higher time-frame price below 1.1884 should accelerate euro selling towards 1.1815 and 1.1740, whilst a higher time frame price close above the 1.2030 level is needed, for further EURUSD upside towards 1.2130 and 1.2260.
Key intraday support is found at the daily pivot, at 1.1928, with further support at 1.1915 and 1.1884.
To the upside, intraday EURUSD resistance is found at the weekly pivot, at 1.1948 and 1.1961. Above 1.1961, further resistance is found at 1.1979 and 1.1999.
.
Monday Session To See German Election Overhang
German Chancellor Angela Merkel secured her fourth term in office on Sunday, although the victory was overshadowed by an upsurge in alt-right populism. The ‘Alternative for Germany’ or AfD, secured roughly 13% of the popular vote in the federal election to become the first overtly nationalist party to enter the Bundestag in 60 years.
On the economic calendar, investors can expect a slew of monetary policy news at the start of the week. Bank of Japan (BOJ) Governor Haruhiko Kuroda is scheduled to deliver a speech around 5:35 GMT. Later in the day, European Central Bank (ECB) President Mario Draghi will also deliver remarks.
On the US policy circuit are regional Fed Bank presidents William Dudley (New York), Charles Evans (Chicago) and Neel Kashkari (Minneapolis). Kashkari is a voting member of this year’s Federal Open Market Committee (FOMC).
In data news, the CESifo Group will release its German business sentiment index at 08:00 GMT.
Shifting gears to North America, the Chicago Fed will release its national activity index at 12:30 GMT. The monthly indicator is used to gauge the performance of the overall economy.
Later in the session, the Dallas Fed will unveil its monthly manufacturing business index for September.
Earlier in the day, the Nikkei manufacturing PMI showed a slight uptick in Japan’s factory sector this month. The preliminary index edged up 0.4 points to 52.6. Analysts in a median estimate called for a reading of 53.4. Any PMI above 50 signals expansion in economic activity, whereas a reading below that level denotes contraction.
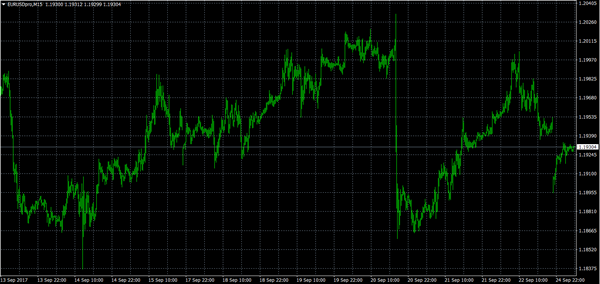
EUR/USD
All was quiet on the euro front on Monday, as investors digested the German election result. The EUR/USD was down 0.2% at 1.1929 in Asian trade, as the market continued to pull away from the all-important 1.2000 level. The pair is directionless around the 20-day moving average, but remains far above the 100-day and 200-day simple moving averages. This suggests that further upside may be in store.
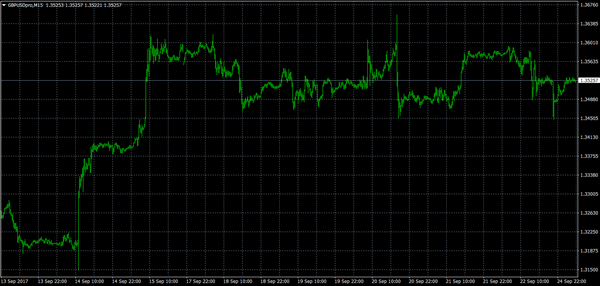
GBP/USD
Pound sterling rose in overnight trade, reaching a session high of 1.3530 US. Cable has been in a bullish uptrend since the Bank of England (BOE) sent its strongest signal yet that rates could rise later this year. The GBP/USD has gained more than 700 pips over the past month. However, near-term upside remains capped below 1.3600. On the opposite side of the ledger, immediate resistance is located at 1.3450.
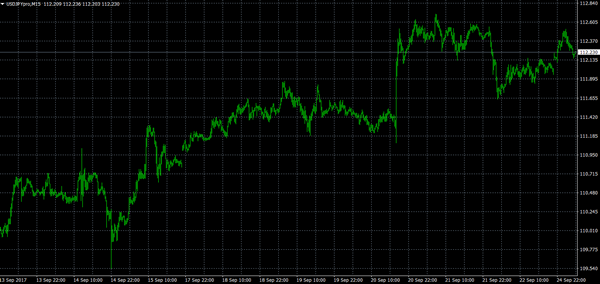
USD/JPY
The USD/JPY broke higher in early-week trade to retake the 112.00 handle. The pair touched a session high of 112.46 before paring gains later in the session. The dollar-yen cross has been supported by improved risk sentiment in the financial markets. As a result, the yen’s haven appeal has waned considerably.
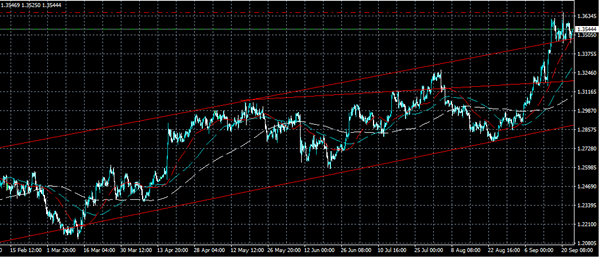
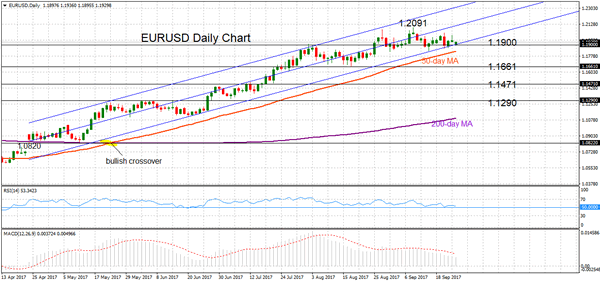
EURUSD Maintains Underlying Uptrend But Neutral Bias Expected In Near Term
EURUSD maintains a neutral bias since August 28 but the underlying bullish trend still holds firm from the April low of 1.0820.
The short-term technicals are neutral and indicating that upside momentum has weakened. RSI and MACD are both still in bullish territory although the indicators have been heading lower during the past two weeks. This could suggest that EURUSD remains at risk of weakening further especially after the pair’s inability recently to make strong headway through resistance at the September 8 high of 1.2091.
More range trading seems the most likely prospect for EURUSD in the near term but a break below the 1.1900 support would shift the focus to the downside for a move towards support at 1.1661 (August 17 low). A deeper fall would target a previous resistance-that-could-turn-support zone at 1.1471. Falling below this level would see the market retrace more than 50% of the 1.0820 – 1.2091 uptrend and likely move lower to 1.1290 and then 1.1100 before reversing the whole uptrend.
Trend indicators are painting a bullish picture, with the 50-day and 200-day moving averages being positively aligned. The underling bullish trend remains intact but upside momentum has stalled. A sustained break above 1.2091 is needed to see a resumption of the uptrend with scope to rise to the 1.2400 area. In the near term, more range trading is expected but there is risk for a move to the downside.
Politics And Central Bankers To Drive The Markets This Week
Angela Merkel has secured her fourth term as German chancellor, but politics in Europe's largest economy is becoming more complicated. When Emmanuel Macron won the French presidency by a decisive margin over Marine Le Pen, many investors thought that this was the end of the populist tide – it now seems they were wrong. The rise of a populist, far-right alternative party in Germany is getting much attention, after securing more than 13% of the votes. Not only did the AfD secure enough seats to enter the Bundestag, the results also make them the third largest party in Germany, and this will no doubt make things more complicated for the chancellor. Merkel now should form the first three-party coalition, after the SPD decided to go into opposition; this is not likely to happen overnight. Given that the election results were expected, the impact on the Euro was not very powerful. EURUSD initially fell 60 basis points, and then recovered half of its losses. However, the noise out of Germany in the next couple of weeks will likely lead to some volatility, and probably a further correction in EURUSD towards 1.17-1.18. I would see a significant correction as an opportunity to build long positions, based on continued improvement in the EZ economy and central banks' conversion.
The Kiwi was under even greater pressure early Monday, falling more than 1% against the USD. Although as expected, the National Party won the largest number of votes, similarly to Germany's position, it is not enough to gain a majority in the parliament and this may lead to some anxiety amongst investors. Forming a coalition will also take time, and will most likely keep NZD under some pressure.
The announcement from the Federal Reserve last Wednesday, that it would begin unwinding its balance sheet and that they are keeping the option of another US interest rate rise in 2017 on the table, is still encouraging buying demand for the Dollar.
Fed Chair Janet Yellen is scheduled to speak on Tuesday, at the 59th NABE Annual Meeting, to further discuss her views on inflation, uncertainty and monetary policy. She is among many Fed speakers who will share their thoughts after a hawkish statement. Given that there were no economic or fiscal policy surprises since the Fed's last decision, I think we will get more hawkish rhetoric. Thus, a shift in market sentiment is unlikely to occur. ECB's Mario Draghi, BoE's Mark Carney, and BoC's Stephen Poloz are also set to speak on different occasions this week.
Investors will be more concerned about President Trump's announcement in Indiana on Wednesday. There are high expectations that he will provide critical details on tax reforms. The only leaked information so far, is that the corporate tax may be lowered, from 35% to 20%. This is still higher than what Trump had hoped for, but if legislation is passed before year-end, it will still be good news for equity markets.