Sample Category Title
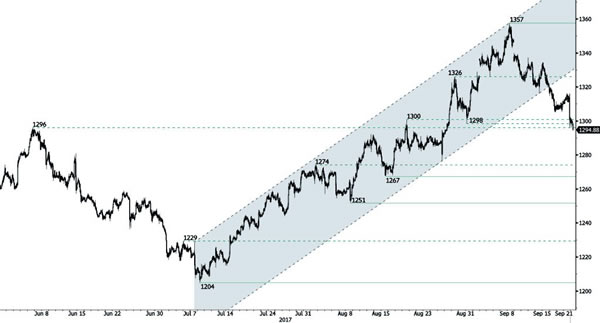
GOLD Breaking 1300
Gold is consolidating above 1300. Hourly support is given at 1298 (31/08/2017 low). Hourly resistance is located at 1357 (08/09/2016). Stronger support lies at 1204 (10/07/2017 high). Expected to show further bearish move.
In the long-term, the technical structure suggests that there is a growing upside momentum. A break of 1392 (17/03/2014) is necessary ton confirm it, A major support can be found at 1045 (05/02/2010 low)
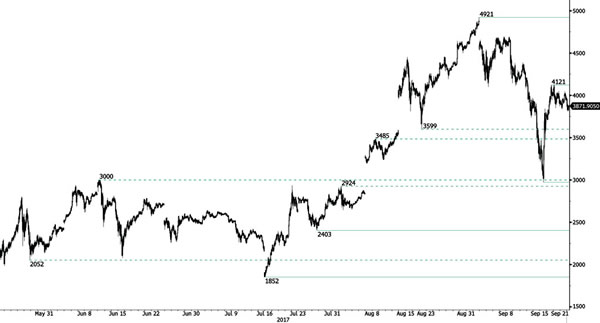
BITCOIN Downside Pressures Are Still There
Bitcoin has taken a dive after strong interest over the summer. The digital currency has set up a new support at 2975 (22/08/2017 low). Hourly resistance is given at 4121 (18/09/2017 low). Key resistance can be located at 4921 (01/09/2017 high). The road is wide open for further shortterm decline.
In the long-term, the digital currency has had an exponential growth. There are decent likelihood that the asset will reach $10'000.
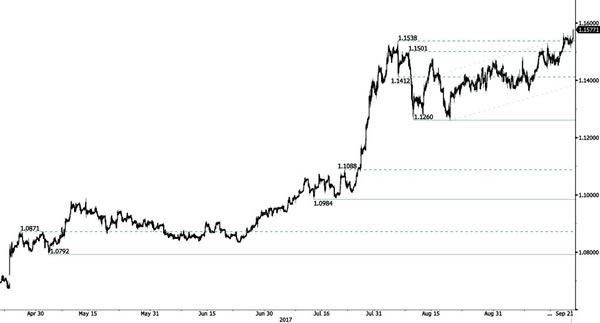
EUR/CHF Bullish Pressures Are Strong
EUR/CHF's buying pressures are going up and the pair has broken resistance area between 1.1356 and 1.1472. The pair has also broken resistance at 1.1538 (04/08/2017 high).
In the longer term, the technical structure has reversed. Strong resistance is given at 1.20 (level before the unpeg). Yet, the ECB's QE programme is likely to cause persistent selling pressures on the euro, which should weigh on EUR/CHF. Supports can be found at 1.0184 (28/01/2015 low) and 1.0082 (27/01/2015 low).
EUR/GBP Weakening
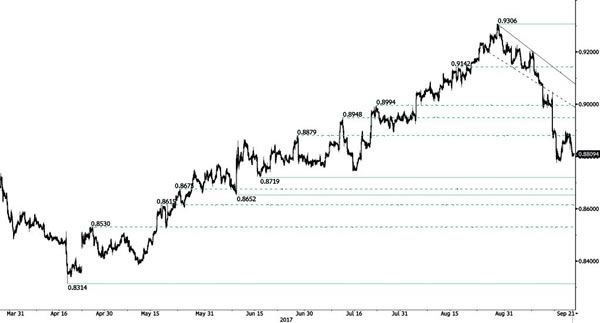
EUR/GBP is weakening. The pair is having strong selling pressures.. However, as long as prices remain below the resistance at 0.9176 (declining trendline), the short-term technical structure is biased to the downside. Hourly support is given at 0.8719 (16/06/2017). Strong resistance lies at 0.9306 (29/07/2017 high).
In the long-term, the pair has largely recovered from recent lows in 2015. The technical structure suggests a growing upside momentum. The pair is trading above from its 200 DMA. Strong resistance can be found at 0.9500 (psychological level).
EUR/GBP Daily Outlook
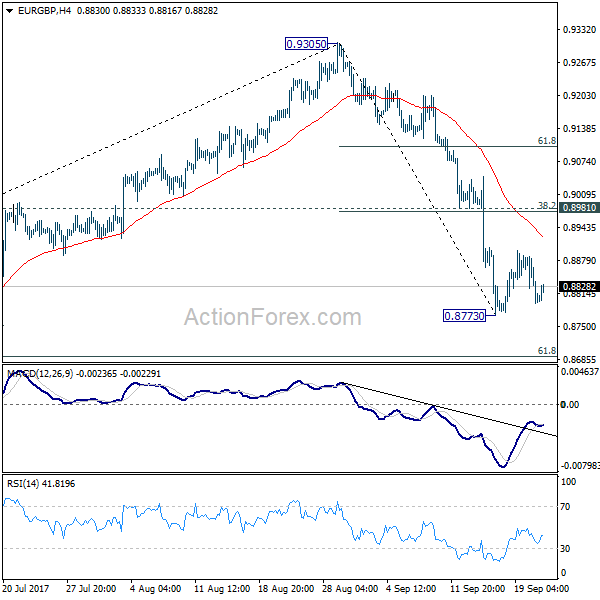
Daily Pivots: (S1) 0.8776; (P) 0.8831; (R1) 0.8868; More
Intraday bias in EUR/GBP remains neutral for the moment. Consolidation from 0.8773 could extend. But near term outlook stays bearish as long as 0.8981 cluster resistance holds (38.2% retracement of 0.9305 to 0.8773 at 0.8976). Fall from 0.9305 is seen as the third leg of consolidation pattern from 0.9304. Below 0.8773 will target 61.8% retracement of 0.8312 to 0.9305 at 0.8691 and below. We'll look for bottoming signal again at it approaches 0.8303 support.
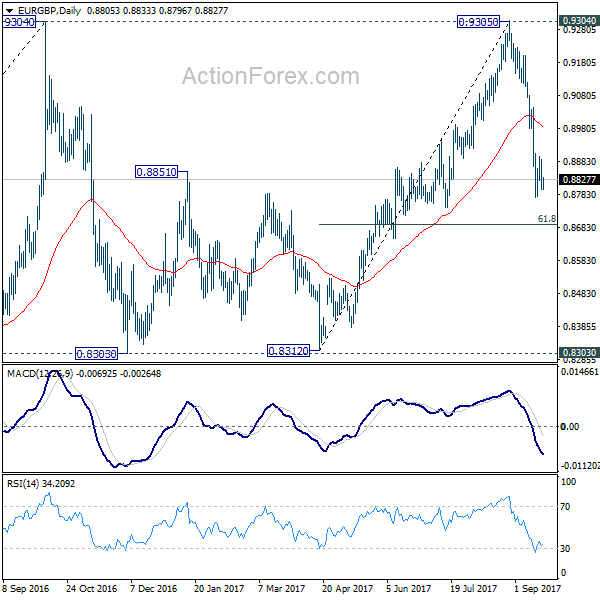
In the bigger picture, price actions from 0.9304 are viewed as a medium term corrective pattern. It's still in progress with fall from 0.9305 as the third leg. Break of 0.8303 could be seen. But we'd expect strong support from 0.8116 cluster support (50% retracement of 0.6935 to 0.9304 at 0.8120) to contain downside. Whole up trend from 0.6935 is expected to resume after consolidation from 0.9304 completes.
EUR/AUD Daily Outlook
Daily Pivots: (S1) 1.4748; (P) 1.4868; (R1) 1.4928; More....
Despite dipping to as low as 1.4791, EUR/AUD quickly recovered and intraday bias remains neutral first. On the upside, above 1.5031 will target 1.5173/5226 resistance zone first. Break will resume medium term rally from 1.3624. On the downside, below 1.4791 will turn bias to the downside and extend the fall from 1.5173 to retest 1.4421 support.
In the bigger picture, we're holding on to the view that corrective decline from 1.6587 medium term has completed at 1.3624. Rise from 1.3624 is expected to extend to retest 1.6587. The corrective structure of the price actions from 1.5226 is affirming this view. Above 1.5226 will target a test on 1.6587 key resistance. However, break of 1.4421 support will dampen our view and would drag EUR/AUD lower to retest key support zone around 1.3624.


NZDUSD Turning Neutral, September’s Bullish Run At Risk Of Deeper Pullback
NZDUSD failed to hold gains made after a rally from 0.7131 to 0.7434 that took place during August 31 until September 20. The market became overbought and reversed back down. This was indicated on the 4-hour chart where the RSI oscillator reached extreme conditions above 70. The near-term risk is clearly to the downside as RSI has a steep downward slope.
The recent move lower could be seen as a corrective move of the recent uptrend. A bounce back above resistance at 0.7340 would shift the focus to the upside for a re-test of the 0.7434 high. Clearing this level would open the way for a rise to 0.7458 and 0.7524.
But with significant loss of upside momentum, the short-term chart suggests a potential top could be developing now at 0.7434 and the market would be entering a consolidation phase. The drop below what was acting as an important support area at 0.7340 increases the risk to the downside.
A continued downward trajectory below the 50-SMA at 0.7280 would target support at 0.7247 (September 18 low). Next support at 0.7182 (September 14) would come into view. Below this, the outlook would turn more bearish for a target of 0.7131.
Overall NZDUSD retains a bullish undertone since early September but the uptrend from 0.7131 will be threatened if there is a drop below 0.7247.
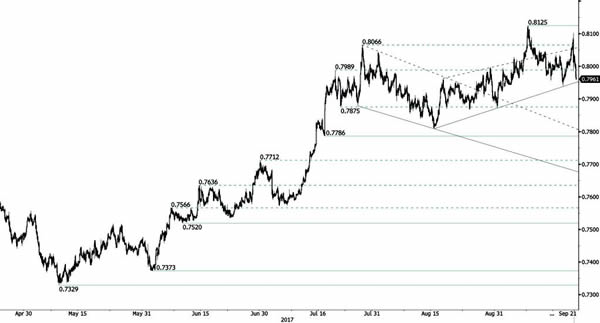
AUD/USD Monitoring Lower Bound Of Uptrend Channel
AUD/USD is bouncing lower on support implied by the lower bound of the uptrend channel. Hourly resistance is given at 0.8125 (08/09/2017 high). Hourly support below 0.7950 (former uptrend channel). Expected to further weaken.
In the long-term, the trend is largely negative since 2011. Key supports stands at 0.6009 (31/10/2008 low) . A break of the key resistance at 0.8295 (15/01/2015 high) is needed to invalidate our long-term bearish view.
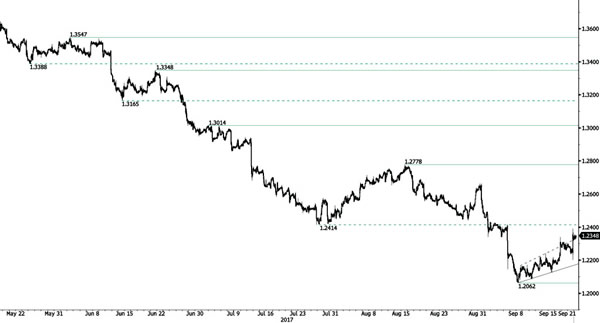
USD/CAD Slight Bullish Pressures
USD/CAD is edging higher. Hourly support is located at 1.2062 (08/09/2017 low). Resistance is now given at a distance at 1.2239 (intraday high). Expected to show continued short-term bearish pressures.
In the longer term, the pair has broken longterm support that can be found at 1.2461 (16/03/2015 low). Strong resistance is given at 1.4690 (22/01/2016 high). The pair is likely to head further lower.
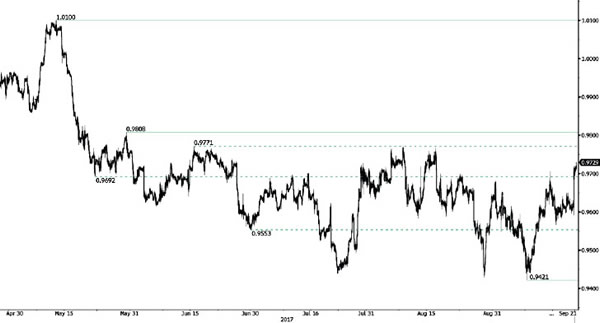
USD/CHF Strengthening
USD/CHF keeps on bouncing higher. Strong resistance is given at 0.9808 (30/05/2017 high). The technical structure shows that the the pair is likely to head further lower below 0.9421 (03/05/2017). Expected to show renewed bearish pressures.
In the long-term, the pair is still trading in range since 2011 despite some turmoil when the SNB unpegged the CHF. Key support can be found 0.8986 (30/01/2015 low). The technical structure favours nonetheless a long term bullish bias since the unpeg in January 2015.