Sample Category Title
GBPUSD Turning Lower
Sterling is turning lower, after failing to move above the pairs key 50-hour moving average, at 1.3515. The British pound is also coming in-line with the broader intraday theme of overall U.S dollar index strength.
Yesterday, the pair printed an explosive 1-hour price-candle immediately after the Federal Reserve interest decision, with price-action spiking to a new yearly high, at 1.3657, and then falling to a new weekly low, at 1.3552.
A higher time frame price-close below the 1.3473 level should accelerate technical selling, whilst a higher time-frame price close above 1.3515 should encourage buying interest.
Key intraday GBPUSD support is found at 1.3452 and 1.3420, with key intraday support from the pairs key 100-week moving average, at 1.3382.
To the upside, key intraday GBPUSD resistance is found 1.3496 and 1.3515. Once closing above 1.3515, further resistance is seen at the daily pivot, at 1.3538, and the 50 percent Fibonacci retracement of yesterday's daily range, at 1.3557.
GBPUSD – Sets Up To Weaken Further On Loss Of Upside Steam
GBPUSD - The pair saw price rejection on Wednesday leaving risk of more weakness on the cards in the days ahead. Support lies at the 1.3450 level where a break will turn attention to the 1.3400 level. Further down, support lies at the 1.3350 level. Below here will set the stage for more weakness towards the 1.3300 level. Conversely, resistance stands at the 1.3550 levels with a turn above here allowing more strength to build up towards the 1.3600 level. Further out, resistance resides at the 1.3650 level followed by the 1.3700 level. On the whole, GBPUSD continues to face further downside threats on higher price rejection.
U.S Dollar Hanging Tough For Now
September 21: Five things the markets are talking about
The Fed's decision to leave the benchmark interest rate unchanged was entirely anticipated yesterday, but their ‘hawkish' forecast for where rates will be at the end of the year caught some of the market by surprise.
As expected, the Fed announced its balance sheet runoff plan would start next month, while keeping its options open on a potential December rate hike. After the announcement the U.S Treasury curve flattened as short-end backed up faster than long rates.
Note: With the Fed biting the bullet over quantitative easing (QE), investors are now expected to turn their attention to several appearances by ECB officials for clues on the future of Europe's stimulus.
Elsewhere, the Bank of Japan (BoJ) also left policy unchanged, as expected. The one dissenter, by new BOJ policy board member Goushi Kataoka, said that the 'yield curve control is not enough to meet inflation target,' and 'sees low chance of consumer prices increasing from 2018 on.'
In the U.K, Brexit strategy continues to top the agenda as PM Theresa May prepares to outline her revised approach tomorrow, while in Germany campaigning continues before Sunday's (Sept. 24) general election. Down-under, New Zealand prepares to go to the polls Saturday.
1. Stocks mixed results
In Japan, the Nikkei share average edged up overnight (+0.2%), helped by gains on Wall Street and a weaker yen (¥112.40) after the Fed signalled it still expects to raise interest rates one more time this year. The BoJ kept monetary policy steady, while maintaining its upbeat view of the economy. The broader Topix index rallied less than +0.05% to its highest print in two-years, before giving up some of its gains after the BoJ's decision.
Note: Investors remain weary of headlines related to a snap Japanese election that are rumoured to be called by PM Abe as early as next Monday.
In Hong Kong, shares ended little changed, as strength in financial and consumer stocks offset a slump in the resources sector triggered by a stronger dollar. The Hang Seng index fell -0.1%, while the China Enterprises Index rose +0.2%.
In China, the major indexes slipped, as developers and the materials sector weakened, offsetting gains in financial firms buoyed by the potential of another Fed rate increase. The blue-chip CSI300 index fell -0.1%, while the Shanghai Composite Index lost -0.2%.
In Europe, regional indices trade mostly higher across the board with the weaker EUR (€1.1916) helping push indices higher following the Fed and BoJ rate decision.
U.S stocks are set to open in the ‘red' (-0.1%).
Indices: Stoxx600 +0.2% at 382.7, FTSE flat 7271.5, DAX +0.2% at 12598, CAC-40 +0.5% at 5267, IBEX-35 +0.2% at 10311, FTSE MIB +0.5% at 22470, SMI +0.4% at 9133, S&P 500 Futures -0.1%
2. Oil prices steady ahead of key OPEC meeting, gold lower
Oil prices were steady overnight, holding most of this week's gains ahead of today's OPEC meeting in Vienna that could extend production limits aimed at clearing a glut that has depressed the market for more than three years.
In January, OPEC and its allies agreed to reduce output by about -1.8m bpd until March 2018 in an attempt to empty inventories. The market is now anticipating an extension to that deal, possibly to the end of next year.
Brent crude oil is down -5c at +$56.24 a barrel, while U.S light crude is -15c lower at +$50.54.
Note: Both contracts have risen more than +15% over the last three-months as global oil supply has tightened.
Ahead of the U.S open, gold prices have slipped to its lowest print in over three-weeks overnight. A stronger U.S dollar and increasing prospects of a December Fed rate hike is curbing appetite for the ‘yellow' metal. Spot gold is down -0.2% at +$1,298.06 an ounce.
3. Sovereign yields on the rise
With the Fed considered a tad more ‘hawkish' after yesterday's Federal Open Market Committee (FOMC) meeting – suggesting it is open to one more rate hike in 2017, data depended and three hikes next year – took the market by surprise.
FI dealers scrambled to price in a Dec. hike, pushing front-end U.S yields much higher (U.S 2's backed up to +1.43% for the first time since 2008) and flattening the curve.
According to the CME, Fed fund future odds moved from pre-meet +50% to +73% possibility for a Dec. Fed rate hike.
Market fears that the Fed will continue to raise rates despite lackluster inflation could keep pressure on the bond market in the near term. Also, the Fed indicated yesterday that it reduced its longer-term projection for its federal-funds rate. Officials now see a rate target of +2.8%, rather than +3%.
The yield on U.S 10-year rallied less than +1 bps to +2.27%, reaching its highest yield print in more than seven-weeks on its fifth consecutive advance. In Germany, the 10-year Bund yield climbed +3 bps to +0.47%, the highest in more than six-weeks.
4. Dollar still holding tough for now
The U.S dollar has posted a powerful rebound in the past 24-hours as the market was caught off guard by the Fed's projection of one more rate hike within the year.
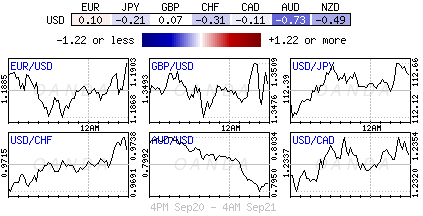
In yesterday's session, the EUR slumped -0.8% to €1.1860 intraday, giving back most of its gains made in the prior four-sessions. USD/JPY has managed to surge up to ¥112.52, its highest intraday level in nearly two-months, extending its winning streak to a fourth-session.
USD/CHF is up for a fourth day as it gains +0.2% to $0.9724, and USD/CAD has regained the psychological C$1.2300 level by rising +0.3% to C$1.2324. The pound swung up to £1.3656 Wednesday, its highest intraday level since the Brexit vote, before retreating to trade atop of £1.3492.
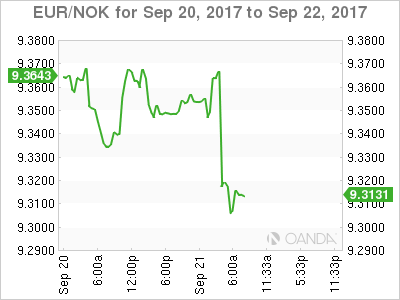
Elsewhere, NOK ($7.8066) has rallied against the U.S dollar after Norges Bank suggested rates might rise sooner than anticipated, even as it left its key policy rate at a record low of +0.5% earlier this morning. EUR/NOK has dropped to its lowest level in a week and a half at around €9.3057.
5. S&P cuts China's credit rating
S&P Global Ratings cut China's sovereign credit rating for the first time in 18-years earlier this morning, citing the risks from soaring debt, and revised its outlook to stable from negative.
The sovereign rating was cut by one step, to A+ from AA-.
'China's prolonged period of strong credit growth has increased its economic and financial risks,' S&P said. 'Although this credit growth had contributed to strong real GDP growth and higher asset prices, we believe it has also diminished financial stability to some extent.'
Note: Moody's Investors Service cut China's rating last May to A1 from Aa3, citing similar concerns over economy-wide debt and effects on state finances.
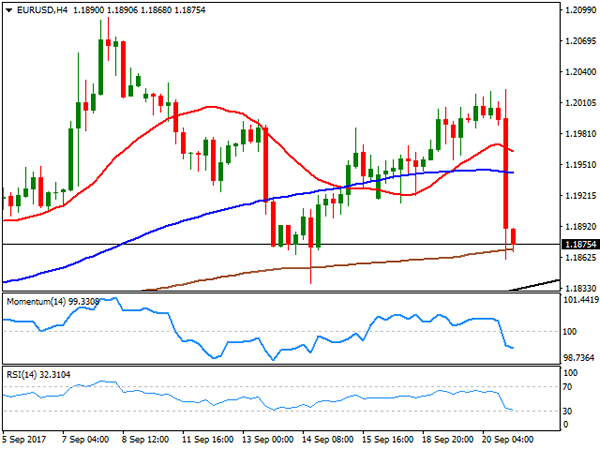
Daily Technical Analysis: EUR/USD Main Channel Could Break To The Downside
The EUR/USD has formed the main channel (light green) that could break soon if the price gets below 1.1890. The price will be trapped in the downtrend channel (violet) and might drop to 1.1800. the POC zone (D H3,EMA89, 50.0,order block, ATR high) 1.1930-50 could reject the price on a retracement. If we don’t see any retracement, pay attention to break of 1.1890. Targets are 1.1850, 1.1835 and 1.1800.
Market Update – European Session: Euro Indices Rise As Markets Digest Latest Rate Decisions From The FED And BoJ
Notes/Observations
European Indices higher following FOMC rate decision, unwind lifts dollar
Norway keeps rates on hold, reiterates will likely remain on hold til 2019
Overnight
Asia:
BoJ left rates on hold as expected with a vote of 8-1 with newcomer Kataoka dissenting
China PBOC sets yuan reference rate-0.3% at 6.5867, the weakest level since Sept 1st.
New Zealand Q2 GDP comes in line with expectations
Taiwan and Philippines leave rates on hold as expected
HTC Confirms $1.1B cooperation agreement with Google, where Google will acquire part of HTC engineering team related to Pixel phone
Australia's CBA to sell Life Insurance unit to AIA Group for $3B
Europe:
Norway keeps deposit rates on hold as expected; Notes Capacity Utilization is on the rise, higher than previously assumed, labor mkt improvement has occurred somewhat faster pace than assumed in June
Sweden Central bank (Riksbank) Sept Minutes showed there are some temporary factors behind the most recent upturn in inflation and the krona has strengthened more rapidly than in the forecast in July
ECB SEPT ECONOMIC BULLETIN: Short term indicators confirm the outlook for robust growth momentum in the near term
Americas:
FOMC kept rates on hold as expected, confirms start of balance sheet reduction in Oct; hurricanes could temporarily boost inflation
Economic data
(UK) AUG PUBLIC FINANCES (PSNCR): £0.0B V -£3.9B PRIOR; PUBLIC SECTOR NET BORROWING: +£5.1B V +£6.4BE
(CH) SWISS AUG TRADE BALANCE (CHF): 2.17B V 3.5B PRIOR
(CH) SWISS AUG M3 MONEY SUPPLY Y/Y: 4.0% V 4.0% PRIOR
(NL) Netherlands Aug Unemployment Rate: 4.7% v 4.8%e
(NL) Netherlands Sept Consumer Confidence Index: 23 v 26 prior
Fixed Income Issuance:
(ES) SPAIN DEBT AGENCY (TESORO) SELLS TOTAL €4.68B VS. €4.0-5.0B INDICATED RANGE IN 2021, 2026, 2028 AND 2044 BONDS
(FR) FRANCE DEBT AGENCY (AFT) SELLS TOTAL €6.99B VS. €6.0-7.0B INDICATED RANGE IN 2020, 2023 AND 2024 OATS
SPEAKERS/FIXED INCOME/FX/COMMODITIES/ERRATUM
Equities
Indices [Stoxx600 +0.2% at 382.7, FTSE flat 7271.5, DAX +0.2% at 12598, CAC-40 +0.5% at 5267, IBEX-35 +0.2% at 10311, FTSE MIB +0.5% at 22470, SMI +0.4% at 9133, S&P 500 Futures -0.1%]
Market Focal Points/Key Themes:
European Indices trade mostly higher across the board with the weaker Euro helping push Indices higher following the FOMC rate decision yesterday.
Corporate activity was light this morning, with notable movers including Capita trading sharply lower after missing estimates while Kier Group trades higher after Full year results. Else where Ryanair remains on focus after press reports that the Pilots have rejected a cash bonus offer to work overtime, while CRH trades higher after acquiring Ash Grove.
On the US front Calgon Carbon called sharply higher after being acquired.
Equities
Consumer discretionary [ Capita [CPI.UK)] -10% (Earnings), Mitchells & Butlers [MAB.UK] -5.1% (Trading update), Ryanair [RYA.UK] -2.2% (Reprtedly pilots turn down £12K cash bonus offer to work overtime]
Industrials: [Kier [KIE.UK] +8.6% (Earnings)]
Material: [CRH [CRH.UK] +2.8% (To acquire Ash Grove for enterprise value of $3.5B)]
Healthcare:[Nicox [COX.FR] +2.6% (Announces licensing agreement with Eyevance for commercialization of ZERVIATETM in the United States; To receive upfront payment of $6M)]
Speakers
BOJ Gov Kuroda: To adjust policy as appropriate and to maintain momentum towards 2% price target- post rate decision press conference
Currencies
The dollar continues hold ground after gaining sharply yesterday, while the Yen weakens following the BoJ rate decision. Then USD/JPY rallied over 100 pips following the rate decision.
Fixed Income
Thursday's liquidity report showed Wednesday's excess liquidity fell to €1.729T from €1.747T and use of the marginal lending facility rose to €137M from €86M.
Corporate issuance saw $0.6B come to market in quieter session, bringing Week to date issuance to just above $13B and Monthly issuance at ~ $102B
Looking Ahead
07:30 (BR) Brazil Central Bank (BCB) Quarterly Inflation Report (QIR)
08:00 (PL) Poland Central Bank (NBP) Sept Minutes
08:00 BR) Brazil Mid-Sept IBGE Inflation M/M: 0.1%e v 0.4% prior; Y/Y: 2.6%e v 2.7% prior
08:05 (UK) Baltic Dry Bulk Index
08:30 (US) Sept Philadelphia Fed Business Outlook: 17.2e v 18.9 prior
08:30 (US) Initial Jobless Claims: 300Ke v 284K prior; Continuing Claims: 1.98Me v 1.944M prior
08:30 (CA) Canada July Wholesale Trade Sales M/M: -0.7%e v -0.5% prior
08:30 (US) Weekly USDA Net Export Sales
09:00 (US) July FHFA House Price Index M/M: 0.4%e v 0.1% prior
09:00 (MX) Mexico July Retail Sales M/M: +0.1%e v -1.1% prior; Y/Y: 1.0%e v 0.4% prior
09:00 (RU) Russia Gold and Forex Reserve w/e Sept 15th: No est v $427.3B prior
09:00 (ZA) South Africa Central Bank (SARB) Interest Rate Decision: Expected to cut Interest Rate by 25bps to 6.75%
10:00 (US) Aug Leading Index: No est v 0.3% prior
10:00 (EU) Euro Zone Sept Advance Consumer Confidence: -1.5e v -1.5 prior
10:30 (US) Weekly EIA Natural Gas Inventories
12:00 (US) Fed reports Q2 Financial Accounts: Household Change in Net Worth: No est v $2.347T prior
Foreign Exchange Market Commentary: EUR/USD, USD/JPY, GBP/USD, GOLD, WTI CRUDE, DJIA, FTSE100, DAX
EUR/USD
Having surged to a daily high of 1.2023, the EUR/USD pair fell following Fed's announcement, seen generally hawkish. Clear indications on how and when they will unwind their balance sheet and three rate hikes still seen for this year, were clearly dollar positive, at least short term. The Central Bank left rates unchanged, as largely expected, but indicated that it will start reducing its $4.5 trillion balance sheet by $10 billion per month, from next October. Also, the dot-plot showed that a third rake hike for this year is still on the table, as 11 of 16 Fed members consider it's appropriate, with the Fed funds futures now suggesting a 72% chance of at least one more rate increase before year-end, up from previous 51%.
The pair fell down to 1.1861, recovering modestly within the Q&A, as Yellen said that falling inflation is somewhat a "mystery." Policymakers downgraded their short-term inflation forecast, lowered to 1.5% from previous 1.7%, for this year, whist growth was revised up, from 2.2% to 2.4%. Yellen has just made the ECB a big favor, as the European Central Bank was unable to fight a rising EUR, but seems possible that the decline extends now on profit taking, particularly considering USD shorts were overcrowded.
Anyway, the pair resumed its decline afterwards, heading into the Asian session at its lowest for the week, and poised to extend its decline towards the critical 1.1820/30 region, in where the pair has bottomed the previous two weeks, also having there a long term ascendant trend line coming from early April low of 1.0603. A break below the level should lead to a steeper decline that can extend during the upcoming sessions down to 1.1661, August 17th low. Technical readings in the 4 hours chart support a downward extension, albeit the price is now unable to break below its 200 SMA, whilst technical indicators partially lost downward momentum, remaining anyway near oversold readings.
Support levels: 1.1860 1.1820 1.1775
Resistance levels: 1.1910 1.1950 1.1995
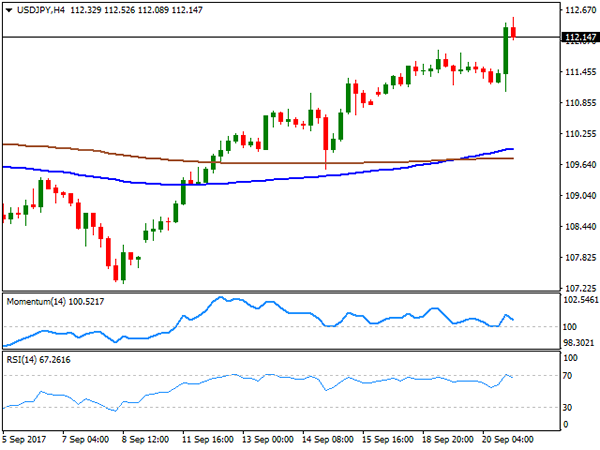
USD/JPY
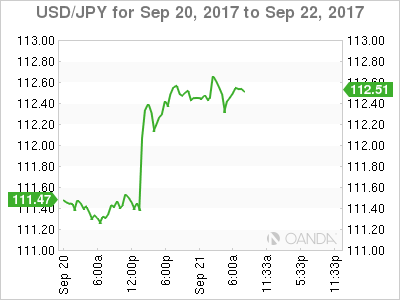
The USD/JPY pair heads into the Asian session above 112.00, but off the daily high of 112.52 achieved post-Fed, also the highest since mid July. The Japanese yen is down for third consecutive day, underpinned by advancing US Treasury yields, up to their highest in six weeks, on news the US Central Bank will start unwinding its balance sheet, while keeping doors opened for a third rate hike for the year. The 10-year note benchmark settled at 2.28%, up from 2.24%, while the 30-year note yield posted a modest advance, to 2.82% from 2.81%. The Bank of Japan will have its monetary policy meeting during the upcoming Asian session, but is largely anticipated to be a non-event. Japan will also release July's industrial activity index, expected at -0.1% from previous 0.4%. From a technical point of view, the 4 hours chart maintains the risk towards the upside, despite the late US session pullback, as indicators just retreated from overbought readings, but are far above their mid-lines, whilst the 100 SMA keeps advancing modestly above the 200 SMA, both well below the current level. Tuesday's high at 111.87 is key, as a break below it will likely anticipate some further slides ahead.
Support levels: 111.90 111.50 111.20
Resistance levels: 112.50 112.85 113.30
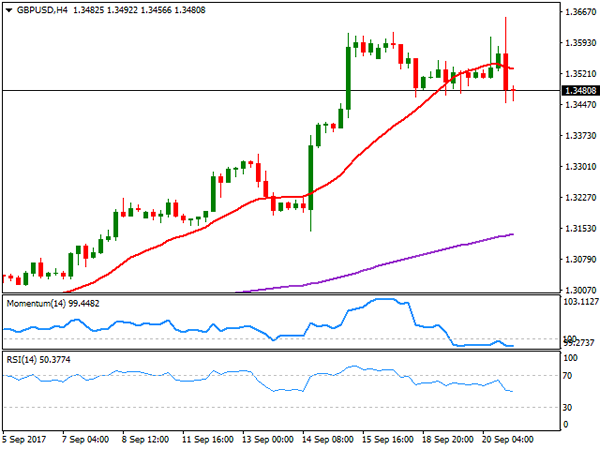
GBP/USD
The GBP/USD pair peaked at 1.3653, its highest since the Brexit referendum following Fed's initial release, in which it left rates unchanged, but the dollar gained traction on news the US Central Bank will begin unwinding its balance sheet starting next October. The Pound ended the day just 30 pips lower against its American rival, boosted at the beginning of the day by upbeat UK Retail Sales figures for August. Sales increased by 1.0% compared with July, and by 2.4% when compared to a year earlier, more than doubling market's expectations. The core readings, excluding fuel prices, were also sharply higher, while all July readings were revised modestly higher. The news sent the pair briefly above the 1.3600 level but pulled back ahead of Fed, holding anyway above 1.3500. Anyway, the pair is heading into the Asian opening around 1.3480, having set a low of 1.3451 on dollar's strength. From a technical point of view, the 4 hours chart shows that the risk has turned towards the downside, as the price is currently below a modestly bearish 20 SMA, whilst the RSI indicator hovers within neutral territory, and the Momentum entered bearish territory, with not enough directional strength at the time being. An extension below 1.3440 is now required to confirm a bearish continuation for this Thursday, with scope then to test the 1.3350/70 region.
Support levels: 1.3440 1.3410 1.3370
Resistance levels: 1.3530 1.3560 1.3595
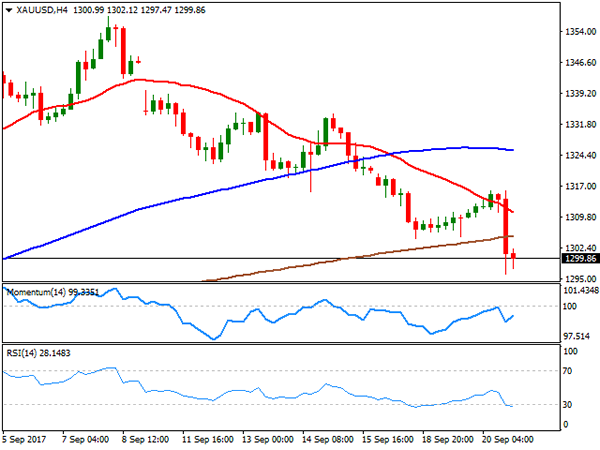
GOLD
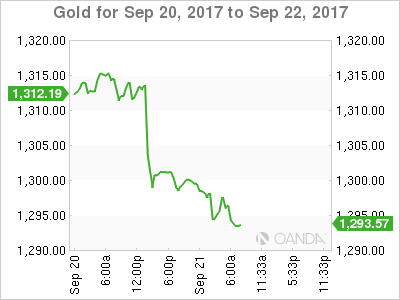
Gold prices fell to fresh September lows, with spot down to $1,295.99 a troy ounce, to settle a few cents below the 1,300.00 mark. News that the US Federal Reserve is still open to raise rates next December, while it will also begin unwinding its balance sheet, dented further demand gold, usually sensitive to higher rates. Moreover, market has shown no signs of worry on the latest verbal menaces between the US and North Korea, limiting the demand for the safe-haven metal. Struggling to regain the 1,300 level, the daily chart for the commodity indicates that the bearish momentum has just accelerated, as the price is well below its 20 SMA, now turning south, whilst technical indicators extended their bearish slopes, now nearing oversold territory. In the 4 hours chart, gold has broken below all of its moving averages, settling below the 200 SMA for the first time since mid July, whilst technical indicators pared losses, but so far posted shallow bounces within negative territory, not enough to confirm an upcoming recovery.
Support levels: 1,296.00 1,288.10 1,280.45
Resistance levels: 1,304.60 1,311.60 1,319.80
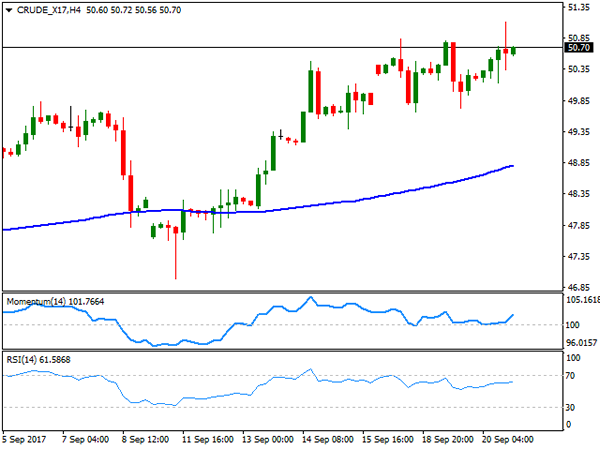
WTI CRUDE OIL
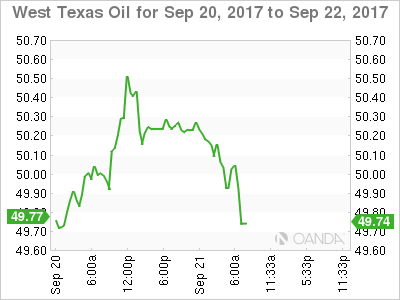
Crude oil prices surged to their highest since last May, as a disappointing EIA report was offset by hopes the OPEC will extend its production-cut deal. West Texas Intermediate crude futures traded as high as $51.10 a barrel, level reached on a volatile dollar after Fed's decision, to finally settle at 50.70. The EIA weekly report released early Wednesday showed that domestic crude supplies climbed by 4.59 million barrels for the week ended September 15h, surpassing market's expectations of 3.49 million but below previous 5.88M. The API report released late Tuesday also showed a 1.443M build, below previous 6.181M. US crude futures are at the higher end of the their yearly range, having topped back in January at 55.22, which means that the pace of the advance may begin moderating. Anyway, the bullish stance persists, as in the daily chart, WTI posted a higher high and a higher low daily basis, extending further beyond its 100 and 200 SMAs, whilst technical indicators picked up near overbought readings after being consolidating for most of the week. Shorter term, and according to the 4 hours chart, the commodity is also bullish, far above bullish moving averages, and with a strong upward momentum. Beyond the mentioned daily high, the 51.52, May high is the next probable target, en route to the 52.00 price zone.
Support levels: 50.20 49.60 49.10
Resistance levels: 51.10 51.55 52.00
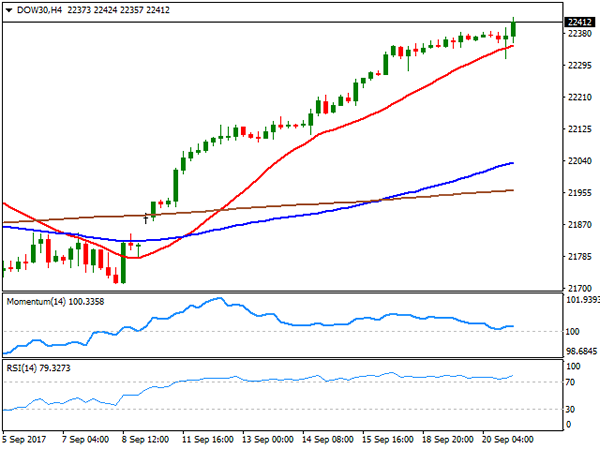
DJIA
Wall Street closed mixed, but with the DJIA up for ninth day in-a-row, up 41 points to 22,412.59. The S&P added 0.06%, to end at 2,508.24, although the Nasdaq Composite ending the day down 5 points, at 6,456.04. The Federal Reserve decided to leave rates unchanged, but also indicated that a hike remains likely before the end of the year, and that three additional hikes are possible for the next one, while announcing also they will unwind their balance sheet. Bank-related equities were among the best performers, as they benefit from higher bond yields because it means they can charge higher interest rates on loans. Apple was the worst performer, down 1.68%, followed by Johnson & Johnson that shed 1.48%. McDonald's on the other hand, was the best performer, up 1.56%. The daily chart supports additional gains ahead, although the risk of a downward correction keeps increasing. Indicators in the mentioned time frame, however, keep heading north above their mid-lines, whilst moving averages accelerated further north well below the current level. Being at unexplored territory, round numbers are clear market targets for speculators, now looking to test 22,500. Shorter term, and according to the 4 hours chart, the risk is also towards the upside, as the index bounced sharply after attempting to break below a bullish 20 SMA, whilst technical indicators also turned higher, and particularly the RSI now stands at 79.
Support levels: 22,370 22,334 22,288
Resistance levels: 22,424 22,475 22,500
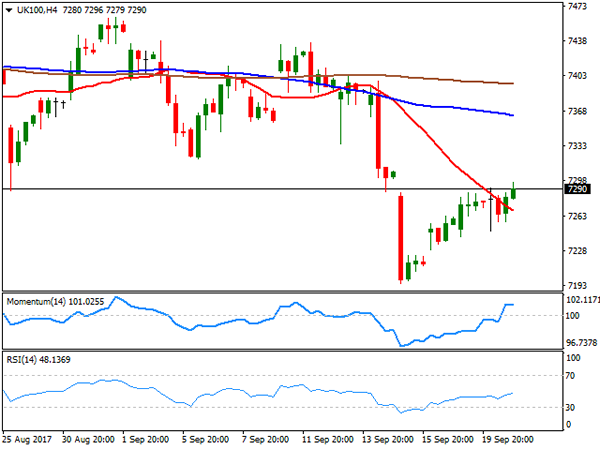
FTSE100
The London benchmark, the FTSE 100, ended Wednesday at 7,271.95, down 3 points, as the Pound surged on upbeat UK Retail Sales figures for August. Nevertheless, the decline was limited amid the prevalent cautious mode ahead of the US Federal Reserve's September policy decision. Babcock International Group led advancers, adding 5.81%, followed by Kingfisher that gained 5.60% after saying it's on track to meet targets in the second year of its five-year restructuring plan, also raising its dividend. Diageo, a drinks company, was the worst performer, shedding 2.78%. The index added some 20 points after the close, now struggling around 7,290, but still looking bearish in the daily chart, as the index has multiple relevant lows in the region from these last few months as the index develops below all of its moving averages, whilst technical indicators remain within bearish territory gaining downward strength. In the 4 hours chart, the RSI indicator remains below its mid-line, whilst the Momentum lost upward strength within positive territory. In this last time frame, the index stands a few points above a strongly bearish 20 SMA, also limiting chances of a steeper recovery for this Thursday, particularly if the Pound maintains its strength.
Support levels: 7,268 7,236 7,195
Resistance levels: 7,317 7,344 7,380
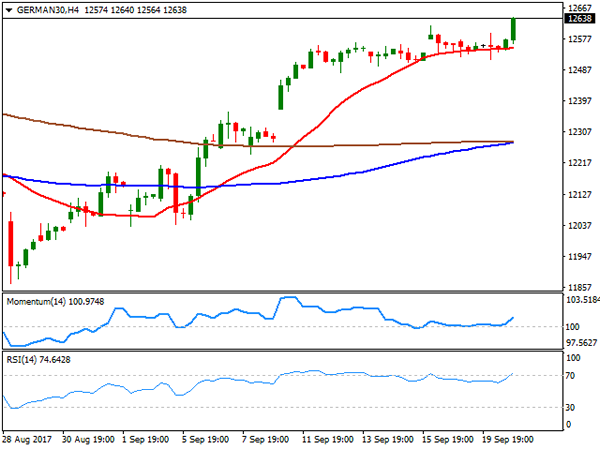
DAX
European equities ended the session little changed, with the German DAX managing to add 7 points, to 12,569.17, amid wait-and-see stance ahead of Fed's announcement. Higher oil prices kept equities afloat, whilst German equities found additional support in rising producer price inflation up by 0.2% in August from the previous month, and by 2.6% from a year earlier. RWE AG led advancers, closing the day 3.50%, followed by Commerzbank that added 2.51%, while Deutsche Bank led decliners, down 1.68%. The index surge in after-hours trading, amid Wall Street's reaction to the Fed's announcement, now heading into the Asian opening at 12,638, its highest in over two months, helped by a weaker EUR. Technically, the daily chart for the index favors further gains ahead, given that technical indicators have resumed their advance near overbought levels, whilst it extended further above its moving averages. Shorter term, and according to the 4 hours chart, the index is also biased higher, as an early decline was contained by buying interest around its 20 SMA, whilst technical indicators turned strongly up with the Momentum above its 100 level and the RSI entering overbought territory.
Support levels: 12,584 12,537 12,489
Resistance levels: 12,677 12,720 12,769
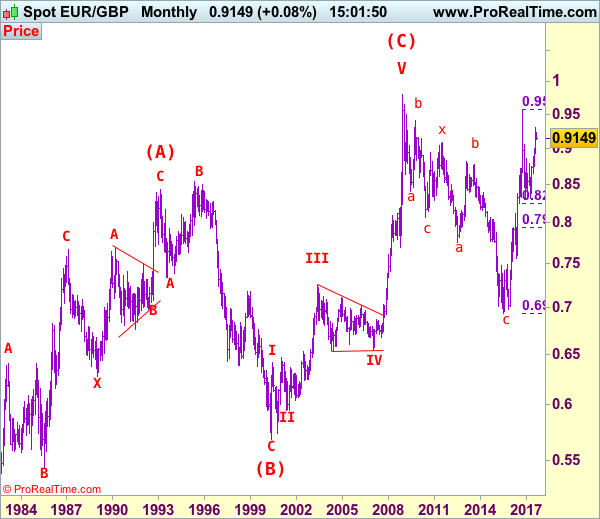
EUR/GBP Elliott Wave Analysis
EUR/GBP – 0.8829
Last week’s late selloff suggests the reversal from 0.9307 top is still in progress, hence downside bias is seen for this move to extend weakness towards previous support at 0.8743, a daily close below there would add credence to our view that recent upmove has indeed ended at 0.9307, bring further decline to 0.8700, then towards 0.8700-10, however, loss of near term downward momentum should prevent sharp fall below another previous support at 0.8652 and price should stay above 0.8600, bring rebound later.
Our latest preferred count is that the wave V of a 5-wave series from 0.5682 ended at 0.9805 earlier and major from there has possibly ended at 0.8067 as A-B-C-X-A-B-C. We are keeping our view that the entire correction from 0.9805 has possibly ended at 0.7756 and as labeled as the attached daily chart and impulsive move from 0.9084 has ended at 0.6938 as a 5-waver which marked as the (C) wave, recent impulsive rise is labeled as (I) (II), (i) (ii) series, indicated upside target at 0.9084 had been met, the retreat from 0.9576 suggest wave iii ended there and next upside target for wave v of (III) should head towards 0.9700 but price should falter well below parity .
On the upside, whilst initial recovery to 0.8890-00 cannot be ruled out, reckon upside would be limited to 0.8950 and price should falter well below 0.9000, bring another decline later to aforesaid downside targets. Only above resistance at 0.9048 would abort and signal the fall from 0.9307 has formed a temporary low, bring a stronger recovery to 0.9100 and then 0.9145-50, having said that, price should falter well below resistance at 0.9203, then the single currency shall head south again from there.
Recommendation: Sell at 0.8950 for 0.8750 with stop above 0.9050
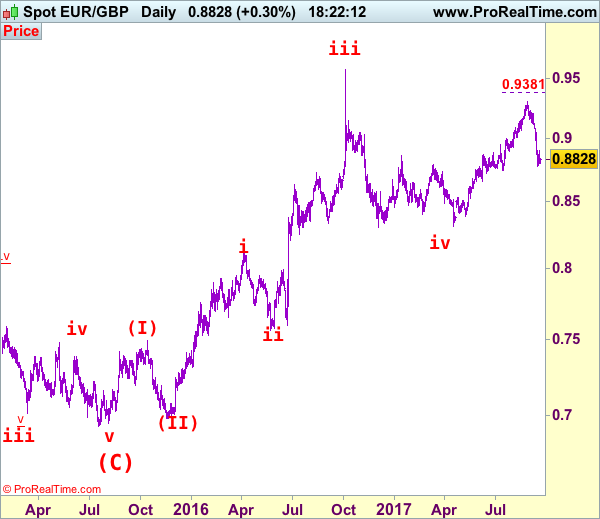
Euro's long term uptrend started in Feb 1981 at 0.5039 and is unfolding as a (A)-(B)-(C) move with (A): 0.8433 (Feb 1993), (B): 0.5682 (May 2000) and impulsive wave (C) should have ended at 0.9805 with wave III ended at 0.7254 (May 2003), triangle wave IV at 0.6536 (23 Jan 2007) and wave V as well as wave (C) has ended at 0.9805.
We are keeping an alternate count that only wave III ended at 0.9805 and the correction from there is the wave IV and has possibly ended at 0.6936, however, it is necessary to see a daily close above resistance at 0.9576 in order to change this to be the preferred count.
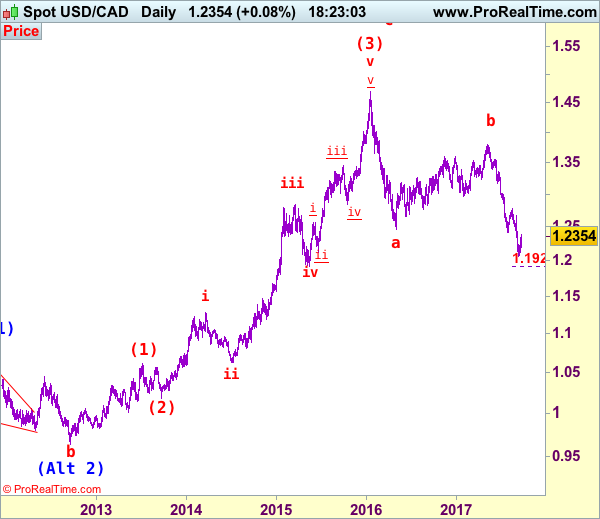
USD/CAD Elliott Wave Analysis
USD/CAD – 1.2354
As the greenback found good support at 1.2197 yesterday and has rebounded again, suggesting a temporary low has possibly been formed at 1.2061 earlier this month and consolidation with mild upside bias is seen for the rebound from there to bring retracement of recent decline to 1.2400-10, then towards 1.2440-45 but a daily close above latter level is needed to suggest at least a minor wave v has ended, bring retracement of recent decline to 1.2500, then 1.2550 but price should falter well below resistance at 1.2663, bring retreat later.
We are keeping our view that the wave b from 1.0657 (a leg top) has possibly ended at 0.9633 with (a): 0.9800, wave (b): 1.0447 and wave c at 0.9633, the subsequent rise from there is now treated as wave c exceeded indicated upside target at 1.3770-80 and 1.4000 and wave (3) has possibly ended at 1.4690 and wave (4) correction has commenced for retracement back towards 1.2000.
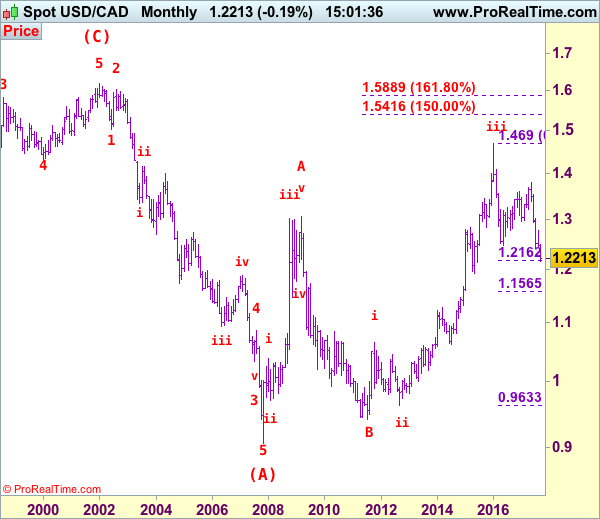
On the daily chart, our latest preferred count remains that the A of (B) rally from 0.9059 low (7 Nov 2007) unfolded into an impulsive wave with i: 0.9059-1.0380, ii ended at 0.9819, iii at 1.3019 followed by triangle wave iv at 1.2026 , then wave v formed a top at 1.3066 and also ended the wave A. The wave B is unfolding as an double three a-b-c-x-a-b-c and is sub-divided as a: 1.2192, b: 1.2716 and wave c at 1.0784, followed by wave x at 1.1725, another set of a-b-c unfolded with 2nd a at 0.9931, 2nd b at 1.0674. the 2nd c has possibly ended at 0.9407, therefore, consolidation with upside bias is seen for major correction, indicated target at 1.3900 had been met and gain to 1.4700 would follow.
On the downside, whilst pullback to 1.2250-60 cannot be ruled out, reckon said support at 1.2197 would hold and bring another rebound later. A daily close below 1.2197 would dampen this near term bullishness and risk test of 1.2121 support but only break there would confirm and signal decline has resumed for retest of said recent low at 1.2061. Looking ahead, break of 1.2061 would extend medium term downtrend towards psychological support at 1.2000 but reckon downside would be limited to 1.1925 (61.8% projection of 1.3794-1.2414 measuring from 1.2778). We are keeping our bearish count that wave b ended at 1.3794 and wave c has commenced for further fall towards psychological support at 1.2000.
Recommendation: Buy at 1.2260 for 1.2460 with stop below 1.2160.
Longer term - The selloff from 1.6194 (21 Jan 2002) to 0.9059 (07 Nov 2007) is viewed as (A) wave which is a 5-waver as labeled on the monthly chart as below, the subsequently rally is labeled as (B) with impulsive A leg of (B) ended at 1.3066, wave B of (B) is unfolding which has either ended at 0.9407 or would extend one more fall but downside should be limited to 0.9200 and 0.9000 should hold.
US Futures Higher Thanks To The Fed
FOMC Decision and the main points
- No attention to the downward revision of the economic numbers such as the retail numbers
- The Dot Plots have changed- they are completely useless and they have not helped in the past
- The views of the new members will be more important
- Fed fund rate pricing for another rate hike = 60%
- US Futures Higher Thanks To The Fed
US futures are ready to pick up where they left off thanks to the rising bank stocks which pushed the US indices to another record highs. The euro-dollar pair has started to move back up ahead of Mario Draghi’s speech, the president of the European Central Bank. The Bank of Japan kept its powder dry during their monetary policy and left the monetary unchanged. The dollar’s strength against the yen is still the prominent theme as the Fed starts their process of scaling down the mammoth balance sheet.
FOMC Decision and the main points
- No attention to the downward revision of the economic numbers such as the retail numbers
- The Dot Plots have changed- they are completely useless and they have not helped in the past
- The views of the new members will be more important
- Fed fund rate pricing for another rate hike = 60%
- The Hurricane situation is not appropriately priced in because they have increased the GDP growth forecast but underestimated the impact on the economic data in the dark period
- Inflation is still considered as transitory > if you leave things for that long, anything could be transitory; But then they said it is a concern
- Fed still seek stronger labour market.
- Reducing the size of the balance sheet is more critical > once the size is down, they can load that up again in case of mistakes but at current levels it is becoming difficult
- The relation between the Fed tightening their monetary policy and the financial conditions would be important and deteriorating conditions may push them to adopt a more gradual approach
Do not be fooled by the dovish (white) colour of Janet Yellen’s jacket. Her statement was perceived as hawkish. Although, it is important to emphasize that there was nothing new which was not expected by the market. The Fed left the interest rate unchanged and maintained their stance towards reducing the size of the balance sheet. Before the event, the Fed fund rate was reflecting that the chances of another interest rate hike in December are credible. The reason that we think that the statement is hawkish is because the Fed has paid no attention to the downward revision of the economic data and this tells us that despite them saying that they are actually data dependent, in reality they are not.
The number of interest rate hikes for the next three year are reduced from 7 to 6, as we said yesterday. So, the Fed dot plot has changed now, but we think that the market should not pay too much attention to this. Firstly, the dot plot represents the individual fed member’s forecast and it provides very little help in the overall picture. Finally, some of the members will no longer be serving beyond this year so the new dot plot is only good for this year.
The dollar index has moved higher as markets have reacted to the decision that the Fed still thinks that more interest rate hikes are possible despite the fact that the size of the balance sheet will also be reduced. The Fed is in dire need to reduce the size of their balance sheet because of its mammoth size, and by reducing the size of their balance sheet to some extent, it gives them a chance to load it up again when they need it. However, something which should not be ignored is the relation between the Fed monetary policy and the financial conditions, the economy would start to see the impact to some extent of this and this makes us believe that the current projections are slightly overrated. The Fed may have to adopt an even more gradual approach over the next three years in comparison to what they are projecting.
Another reason which provided more aid to the dollar bulls was that the statement largely ignored the downward revision of the economic data, such as the retail number for the last two months which were revised down largely. The housing data is giving a message that the lower affordability ratio is also leaving its prints on the headline number. The Fed paid more attention to the equation part which would boost the GDP growth due to the hurricane situation but overlooked the threats of the weaker sentiment which could derail the investor confidence due to the upcoming soft data. The precious metal has moved lower after the FOMC statement because the market has perceived the statement as somewhat hawkish.
EUR/JPY Daily Outlook
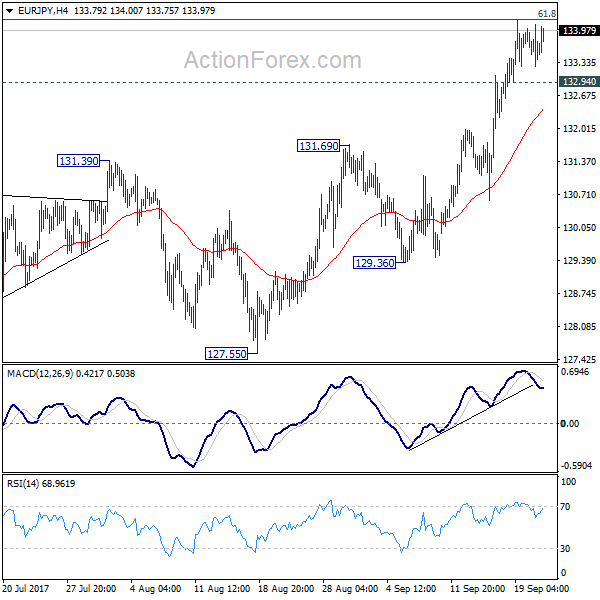
Daily Pivots: (S1) 133.08; (P) 133.57; (R1) 133.89; More...
With 132.94 minor support intact, intraday bias in EUR/JPY remains on the upside. Firm break of 134.20 fibonacci level will pave the way to 141.04 resistance next. On the downside, below 132.94 minor support will turn intraday bias neutral and bring consolidations. But firm break of 131.39 resistance turned support is needed to be the first sign of near term reversal. Otherwise, outlook will remain bullish in case of retreat.
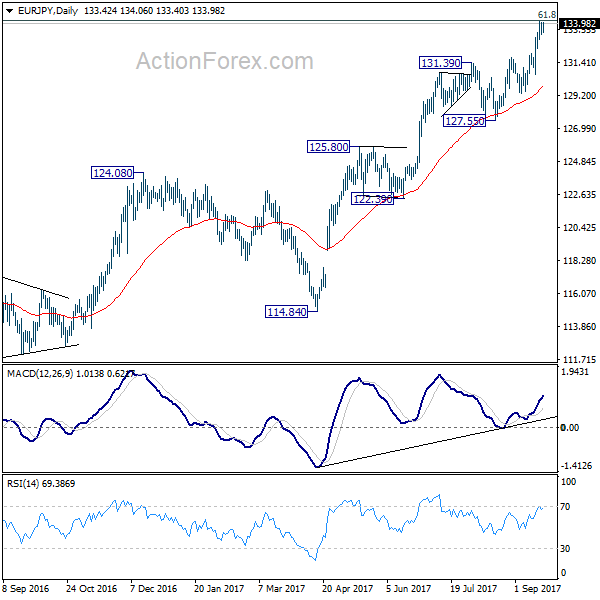
In the bigger picture, current rise from 109.03 is seen as at the same degree as the down trend from 149.76 (2014 high) to 109.03 (2016 low). as long as 124.08 resistance turned support holds, further rise is expected to 61.8% retracement of 149.76 to 109.03 at 134.20. Sustained break there will pave the way to key long term resistance zone at 141.04/149.76. On the downside, break of 127.55 support is needed to be the first signal of medium term reversal. Otherwise, outlook will remain bullish.