Sample Category Title
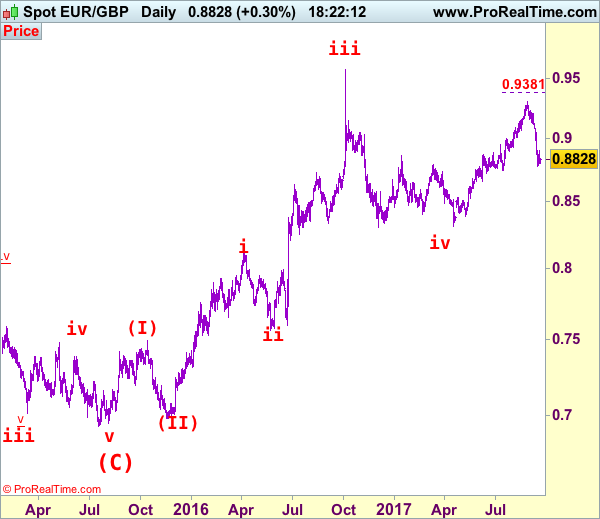
EUR/GBP Elliott Wave Analysis
EUR/GBP – 0.8829
Last week’s late selloff suggests the reversal from 0.9307 top is still in progress, hence downside bias is seen for this move to extend weakness towards previous support at 0.8743, a daily close below there would add credence to our view that recent upmove has indeed ended at 0.9307, bring further decline to 0.8700, then towards 0.8700-10, however, loss of near term downward momentum should prevent sharp fall below another previous support at 0.8652 and price should stay above 0.8600, bring rebound later.
Our latest preferred count is that the wave V of a 5-wave series from 0.5682 ended at 0.9805 earlier and major from there has possibly ended at 0.8067 as A-B-C-X-A-B-C. We are keeping our view that the entire correction from 0.9805 has possibly ended at 0.7756 and as labeled as the attached daily chart and impulsive move from 0.9084 has ended at 0.6938 as a 5-waver which marked as the (C) wave, recent impulsive rise is labeled as (I) (II), (i) (ii) series, indicated upside target at 0.9084 had been met, the retreat from 0.9576 suggest wave iii ended there and next upside target for wave v of (III) should head towards 0.9700 but price should falter well below parity .
On the upside, whilst initial recovery to 0.8890-00 cannot be ruled out, reckon upside would be limited to 0.8950 and price should falter well below 0.9000, bring another decline later to aforesaid downside targets. Only above resistance at 0.9048 would abort and signal the fall from 0.9307 has formed a temporary low, bring a stronger recovery to 0.9100 and then 0.9145-50, having said that, price should falter well below resistance at 0.9203, then the single currency shall head south again from there.
Recommendation: Sell at 0.8950 for 0.8750 with stop above 0.9050
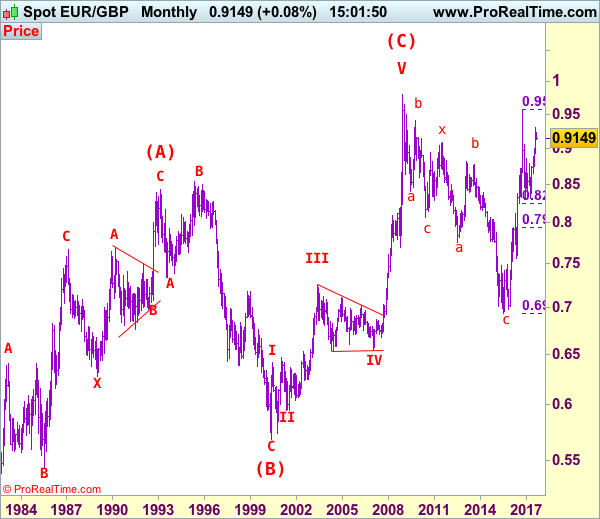
Euro's long term uptrend started in Feb 1981 at 0.5039 and is unfolding as a (A)-(B)-(C) move with (A): 0.8433 (Feb 1993), (B): 0.5682 (May 2000) and impulsive wave (C) should have ended at 0.9805 with wave III ended at 0.7254 (May 2003), triangle wave IV at 0.6536 (23 Jan 2007) and wave V as well as wave (C) has ended at 0.9805.
We are keeping an alternate count that only wave III ended at 0.9805 and the correction from there is the wave IV and has possibly ended at 0.6936, however, it is necessary to see a daily close above resistance at 0.9576 in order to change this to be the preferred count.
USD/CAD Elliott Wave Analysis
USD/CAD – 1.2354
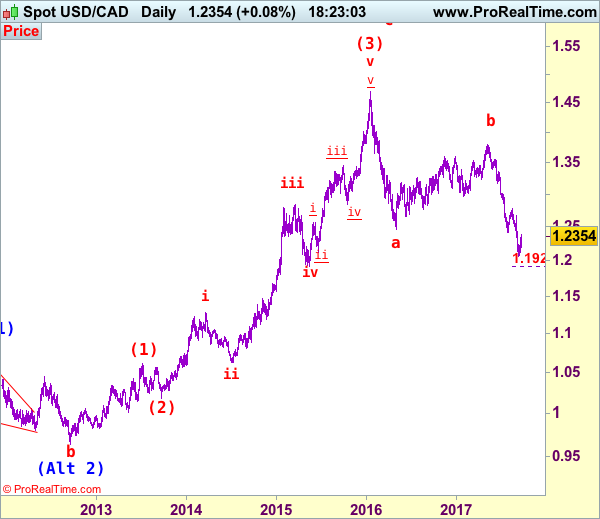
As the greenback found good support at 1.2197 yesterday and has rebounded again, suggesting a temporary low has possibly been formed at 1.2061 earlier this month and consolidation with mild upside bias is seen for the rebound from there to bring retracement of recent decline to 1.2400-10, then towards 1.2440-45 but a daily close above latter level is needed to suggest at least a minor wave v has ended, bring retracement of recent decline to 1.2500, then 1.2550 but price should falter well below resistance at 1.2663, bring retreat later.
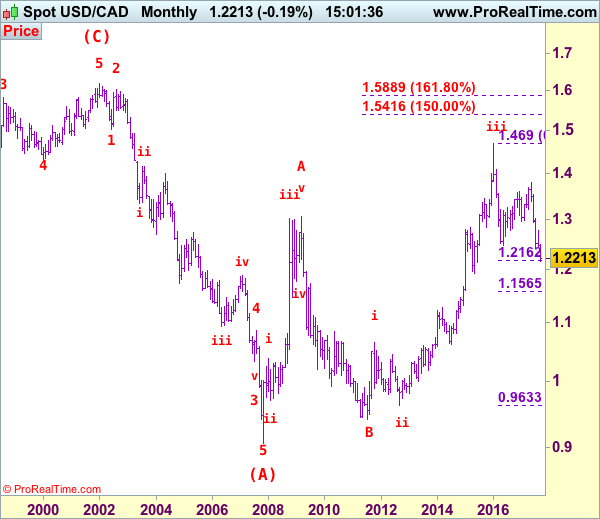
We are keeping our view that the wave b from 1.0657 (a leg top) has possibly ended at 0.9633 with (a): 0.9800, wave (b): 1.0447 and wave c at 0.9633, the subsequent rise from there is now treated as wave c exceeded indicated upside target at 1.3770-80 and 1.4000 and wave (3) has possibly ended at 1.4690 and wave (4) correction has commenced for retracement back towards 1.2000.
On the daily chart, our latest preferred count remains that the A of (B) rally from 0.9059 low (7 Nov 2007) unfolded into an impulsive wave with i: 0.9059-1.0380, ii ended at 0.9819, iii at 1.3019 followed by triangle wave iv at 1.2026 , then wave v formed a top at 1.3066 and also ended the wave A. The wave B is unfolding as an double three a-b-c-x-a-b-c and is sub-divided as a: 1.2192, b: 1.2716 and wave c at 1.0784, followed by wave x at 1.1725, another set of a-b-c unfolded with 2nd a at 0.9931, 2nd b at 1.0674. the 2nd c has possibly ended at 0.9407, therefore, consolidation with upside bias is seen for major correction, indicated target at 1.3900 had been met and gain to 1.4700 would follow.
On the downside, whilst pullback to 1.2250-60 cannot be ruled out, reckon said support at 1.2197 would hold and bring another rebound later. A daily close below 1.2197 would dampen this near term bullishness and risk test of 1.2121 support but only break there would confirm and signal decline has resumed for retest of said recent low at 1.2061. Looking ahead, break of 1.2061 would extend medium term downtrend towards psychological support at 1.2000 but reckon downside would be limited to 1.1925 (61.8% projection of 1.3794-1.2414 measuring from 1.2778). We are keeping our bearish count that wave b ended at 1.3794 and wave c has commenced for further fall towards psychological support at 1.2000.
Recommendation: Buy at 1.2260 for 1.2460 with stop below 1.2160.
Longer term - The selloff from 1.6194 (21 Jan 2002) to 0.9059 (07 Nov 2007) is viewed as (A) wave which is a 5-waver as labeled on the monthly chart as below, the subsequently rally is labeled as (B) with impulsive A leg of (B) ended at 1.3066, wave B of (B) is unfolding which has either ended at 0.9407 or would extend one more fall but downside should be limited to 0.9200 and 0.9000 should hold.
US Futures Higher Thanks To The Fed
FOMC Decision and the main points
- No attention to the downward revision of the economic numbers such as the retail numbers
- The Dot Plots have changed- they are completely useless and they have not helped in the past
- The views of the new members will be more important
- Fed fund rate pricing for another rate hike = 60%
- US Futures Higher Thanks To The Fed
US futures are ready to pick up where they left off thanks to the rising bank stocks which pushed the US indices to another record highs. The euro-dollar pair has started to move back up ahead of Mario Draghi’s speech, the president of the European Central Bank. The Bank of Japan kept its powder dry during their monetary policy and left the monetary unchanged. The dollar’s strength against the yen is still the prominent theme as the Fed starts their process of scaling down the mammoth balance sheet.
FOMC Decision and the main points
- No attention to the downward revision of the economic numbers such as the retail numbers
- The Dot Plots have changed- they are completely useless and they have not helped in the past
- The views of the new members will be more important
- Fed fund rate pricing for another rate hike = 60%
- The Hurricane situation is not appropriately priced in because they have increased the GDP growth forecast but underestimated the impact on the economic data in the dark period
- Inflation is still considered as transitory > if you leave things for that long, anything could be transitory; But then they said it is a concern
- Fed still seek stronger labour market.
- Reducing the size of the balance sheet is more critical > once the size is down, they can load that up again in case of mistakes but at current levels it is becoming difficult
- The relation between the Fed tightening their monetary policy and the financial conditions would be important and deteriorating conditions may push them to adopt a more gradual approach
Do not be fooled by the dovish (white) colour of Janet Yellen’s jacket. Her statement was perceived as hawkish. Although, it is important to emphasize that there was nothing new which was not expected by the market. The Fed left the interest rate unchanged and maintained their stance towards reducing the size of the balance sheet. Before the event, the Fed fund rate was reflecting that the chances of another interest rate hike in December are credible. The reason that we think that the statement is hawkish is because the Fed has paid no attention to the downward revision of the economic data and this tells us that despite them saying that they are actually data dependent, in reality they are not.
The number of interest rate hikes for the next three year are reduced from 7 to 6, as we said yesterday. So, the Fed dot plot has changed now, but we think that the market should not pay too much attention to this. Firstly, the dot plot represents the individual fed member’s forecast and it provides very little help in the overall picture. Finally, some of the members will no longer be serving beyond this year so the new dot plot is only good for this year.
The dollar index has moved higher as markets have reacted to the decision that the Fed still thinks that more interest rate hikes are possible despite the fact that the size of the balance sheet will also be reduced. The Fed is in dire need to reduce the size of their balance sheet because of its mammoth size, and by reducing the size of their balance sheet to some extent, it gives them a chance to load it up again when they need it. However, something which should not be ignored is the relation between the Fed monetary policy and the financial conditions, the economy would start to see the impact to some extent of this and this makes us believe that the current projections are slightly overrated. The Fed may have to adopt an even more gradual approach over the next three years in comparison to what they are projecting.
Another reason which provided more aid to the dollar bulls was that the statement largely ignored the downward revision of the economic data, such as the retail number for the last two months which were revised down largely. The housing data is giving a message that the lower affordability ratio is also leaving its prints on the headline number. The Fed paid more attention to the equation part which would boost the GDP growth due to the hurricane situation but overlooked the threats of the weaker sentiment which could derail the investor confidence due to the upcoming soft data. The precious metal has moved lower after the FOMC statement because the market has perceived the statement as somewhat hawkish.
EUR/JPY Daily Outlook
Daily Pivots: (S1) 133.08; (P) 133.57; (R1) 133.89; More...
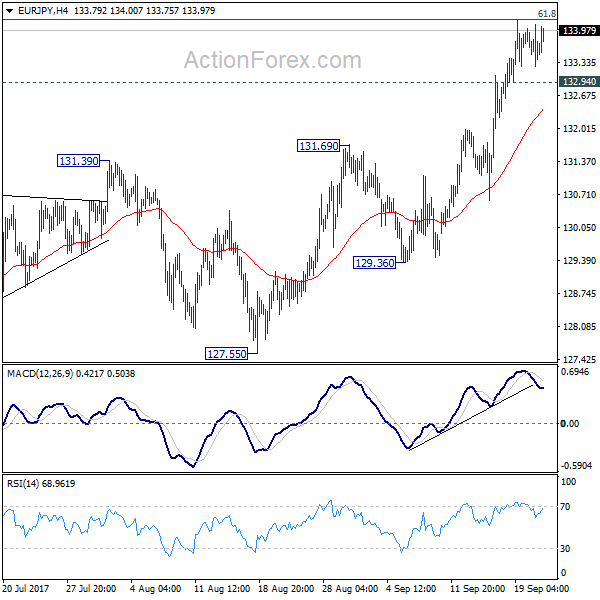
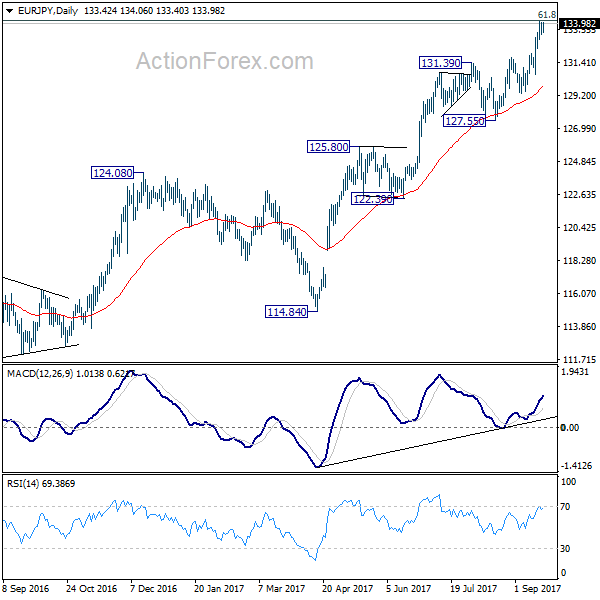
With 132.94 minor support intact, intraday bias in EUR/JPY remains on the upside. Firm break of 134.20 fibonacci level will pave the way to 141.04 resistance next. On the downside, below 132.94 minor support will turn intraday bias neutral and bring consolidations. But firm break of 131.39 resistance turned support is needed to be the first sign of near term reversal. Otherwise, outlook will remain bullish in case of retreat.
In the bigger picture, current rise from 109.03 is seen as at the same degree as the down trend from 149.76 (2014 high) to 109.03 (2016 low). as long as 124.08 resistance turned support holds, further rise is expected to 61.8% retracement of 149.76 to 109.03 at 134.20. Sustained break there will pave the way to key long term resistance zone at 141.04/149.76. On the downside, break of 127.55 support is needed to be the first signal of medium term reversal. Otherwise, outlook will remain bullish.
USD Broadly Higher As Fed Will Start To Its Reduce Balance Sheet In October
FOMC pull trigger and launch balance sheet reduction programme
As widely expected, the FOMC finally triggered the process to reduce the size of its $4.5tn balance sheet. Although the normalization process will start in October, which could be seen as a bit rushed, the pace of disinvestment will be very slow and has already been well telegraphed as described in the Addendum to the Policy Normalization Principles and Plans released in June.
Unsurprisingly, the US dollar reacted in a volatile fashion amid the announcement as investors struggled to assess the short and medium-term consequences of this decision. High quality commodity currencies such as the CAD, NZD and AUD experienced a more acute sell-off, mostly due to the substantial proportion of long speculative position in those currencies against the USD. The single currency dropped more than 1% but quickly stabilized slightly below 1.19, while the pound sterling slid only 0.70% to $1.35.
It must be noted that all in all, it wasn’t a hawkish meeting with both the statement and Yellen’s speech being cautious. The Fed revised downwardly its inflation forecast. Now, FOMC members don’t expect core inflation to reach the 2% percent until 2019. However, the growth forecast was moderately revised to the upside as the real GDP growth forecast has been lifted to 2.4% for 2017 compared to 2.2% previously. Finally, Fed officials cut the forecast for the official rate down to 2.8% in the long-term from 3%, suggesting a stabilisation of the economy.
Bank of Japan still on the accommodative side.
During the night, the Bank of Japan has announced its rate remain on hold. It is certain that the Bank of Japan was also closely looking towards the Fed which had its meeting yesterday night. The US central bank has announced a reduction of its balance sheet which is providing some relief to the USDJPY. Indeed, the currency pair has surged above 112.
Markets will now start pricing the end of the Quantitative Easing. The big unknown is how will react the global bond markets as higher yields would likely trigger a sell-off which can be massive as free money kept flowing into this market during the last decade.
The BoJ is going to continue its all-in monetary policy by buying assets at around Yen 80 trillion a year. This can definitely not end well. Some BoJ members believe that the inflation target of 2% is too high for the current monetary policy which is, in definite, not loose enough. For the time being, the BoJ maintains its 10-year government bond target around 0 percent.
Against the backdrop of the US balance sheet reduction, we consider that the USDJPY is set to appreciate towards 114 within the short-term.
Technical Outlook: SPOT GOLD – Post-Wed Weakness Could Extend To $1284
Spot Gold hit new low at $1293 on Thursday, in extension of Wednesday’s fall after Fed signaled possible additional rate hike this year.
The yellow metal is currently riding on the third wave (from $1334) of five-wave sequence from $1357, which hit its FE100% at $1294 and could travel further down, towards it FE 123.6% at $1282.
The notion is supported by bearishly aligned techs (10/20SMA bear-cross) and formation of daily Tenkan-sen/Kijun-sen bears cross, which generate additional pressure on the price.
In addition, negative fundamentals on Fed’s indication of another rate hike this year, weighs on near-term performance of interest rate-change sensitive gold.
Session high at $1301 marks initial resistance, followed by Wednesday’s peak at $1316.
Res: 1301, 1305, 1311, 1316
Sup: 1292, 1282, 1280, 1276
Investors Remain Unconvinced By Fed Projections
- USD and indices pare post-Fed gains;
- Markets remain unconvinced by 2018 hikes;
- Draghi to appear as euro softens against the greenback.
US futures are marginally lower and the dollar is paring gains ahead of the open on Wall Street, as we see some early profit taking after the Fed unexpectedly maintained its hawkish outlook for interest rates on Wednesday.
Subdued inflation, recent Fed commentary, non-starter fiscal stimulus policies and the recent hurricanes are among the many reasons why investors had assumed that interest rate expectations would be scaled back at yesterday’s meeting but the policy makers clearly had other ideas.
Instead, the central bank announced plans to begin very gradually reducing the size of its balance sheet while only marginally revising lower interest rate forecasts between now at 2019, with another this year still planned. With the dollar having slumped since the start of the year, this provided some rare reprieve and more may follow as markets fall more in line with Fed forecasts. Especially if we see an improvement in the data in the final quarter of the year.
Even now, despite the Fed effectively forecasting four rate hikes before the end of next year, markets are pricing in only one or two and even then, unconvincingly. Clearly there is still a lot of convincing to do on the Fed’s part, potentially providing in the process plenty of upside for US yields and the dollar. Of course, with Yellen possibly being out at the start of next year, this may not be a case of doubting what she says but whether she’ll be there to follow through. It will be interesting to see how the markets react should she be re-elected.
With the euro having fallen back towards 1.19 against the dollar in the aftermath of the Fed announcement, it will be interesting to hear the views of ECB President Mario Draghi later today. There is a clear aversion to 1.20 in the pair within the ECB as whenever this level is approached, a mysterious ECB source says something that weighs on the currency. Draghi has tried and failed to do similar in the recent past, it will be interesting to see whether he tries the same today, not to mention whether there’s any truth to reports that policy makers can’t agree on whether an end date for QE should be set.
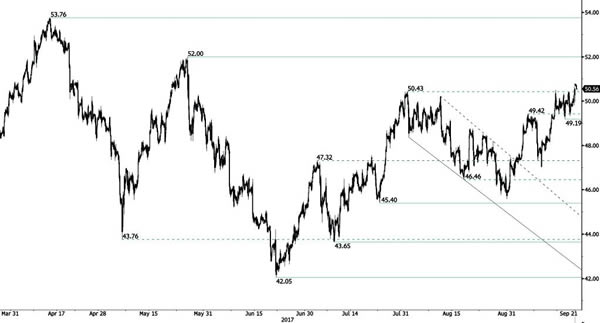
CRUDE OIL Short-Term Bullish Momentum
Crude oil is edging higher above the $50 level. Key support is given at 45.40 (17/08/2017 high). Strong resistance found at 50.43 (31/07/2017) has been broken. Expected to show another leg higher.
In the long-term, crude oil has recovered after its sharp decline last year. However, we consider that further weakness are very likely. Strong support lies at 35.24 (05/04/2016) while resistance can now be found at 55.24 (03/01/2017 high).
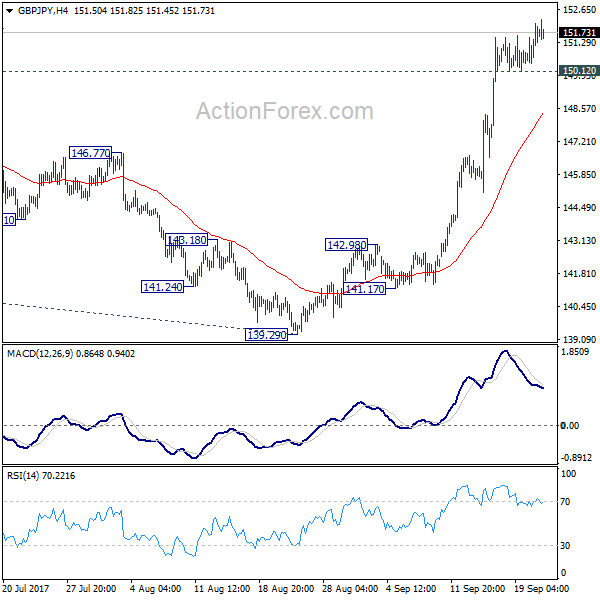
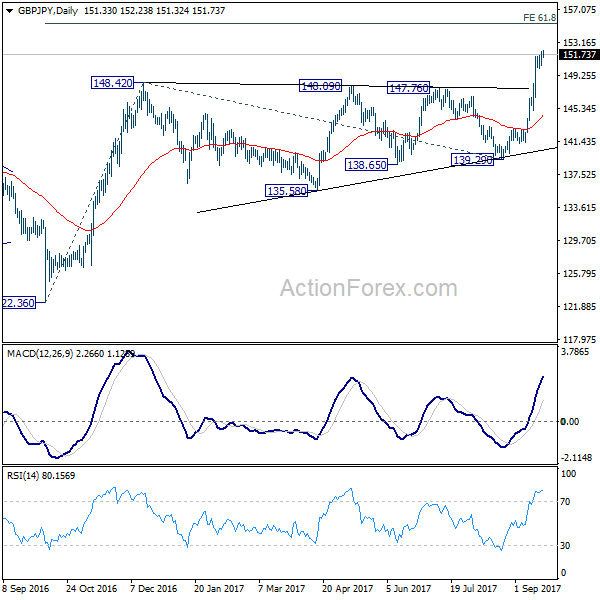
GBP/JPY Daily Outlook
Daily Pivots: (S1) 150.50; (P) 151.33; (R1) 152.20; More
No change in GBP/JPY's outlook. With 150.12 minor support intact, intraday bias remains on the upside. Current medium term rise from 122.36 should target 61.8% projection of 122.36 to 148.42 from 139.29 at 155.39 next. On the downside, below 150.12 minor support will turn intraday bias neutral and bring consolidation before staging another rally.
In the bigger picture, the consolidation from 148.42 should have completed and medium term rebound from 122.36 is resuming. Firm break of 38.2% retracement of 196.85 to 122.36 at 150.43 will carry long term bullish implications. In that case, GBP/JPY could target 61.8% retracement at 167.78. For now, the bullish scenario is preferred as long as 139.29 support holds.
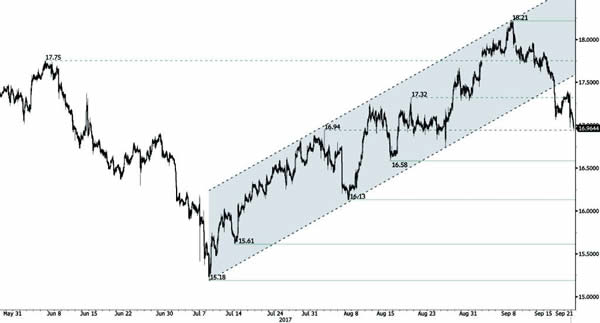
SILVER Continued Decline
Silver has reversed and has broken uptrend channel by breaking support implied by its lower bound. Strong resistance is given at 18.65 (17/04/2017 high) while support can be found at 16.58 (15/08/2017 high). Expected to show further bearish move.
In the long-term, the trend is rater negative. Further downsides are very likely. Resistance is located at 25.11 (28/08/2013 high). Strong support can be found at 11.75 (20/04/2009).