Sample Category Title
USD/JPY Continued Increase
USD/JPY is pushing higher above 112.00. Strong support is located at 111.12 (20/09/2017 low). Expected to show further bullish pressures. Yet, downside risks are now rising as markets may soon take some short-term profit.
We favor a long-term bearish bias. Support is now given at 99.02 (10/08/2013 low). A gradual rise towards the major resistance at 125.86 (05/06/2015 high) seems unlikely. Expected to decline further support at 93.79 (13/06/2013 low).
GBP/USD Strong Buying Demand
GBP/USD is pushing higher after recent surge. Hourly resistance is given at 1.3657 (20/09/2017 high). Strong support is given at 1.2774 (24/08/2017 low). Expected to show continued bullish consolidation.
The long-term technical pattern is reversing. The Brexit vote had paved the way for further decline. Long-term support can be found at 1.1841 (07/10/2017 low). Long-term resistance given around 1.35 is at stake and indicates a long-term reversal in the negative trend. Yet, it is very unlikely at the moment.
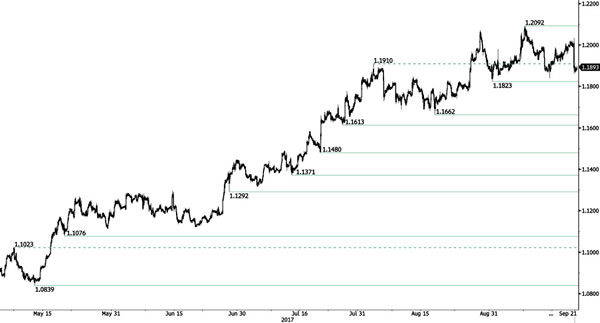
EUR/USD Triple Bottom
EUR/USD lies in a bullish trend despite ongoing consolidation. Hourly resistance can be found at 1.2092 (08/09/2017 high) while hourly support lies at 1.1823 (31/08/2017 low). Stronger support is given at a distance at 1.1662 (17/08/2017 low). Expected to show renewed bullish pressures.
In the longer term, the momentum is now turning largely positive. We favour a continued bullish bias. Key resistance is holding at 1.2252 (25/12/2014 high) while strong support lies at 1.0341 (03/01/2017 low).
Elliott Wave Analysis: GBPUSD And German DAX Searching For Support To Bounce Up
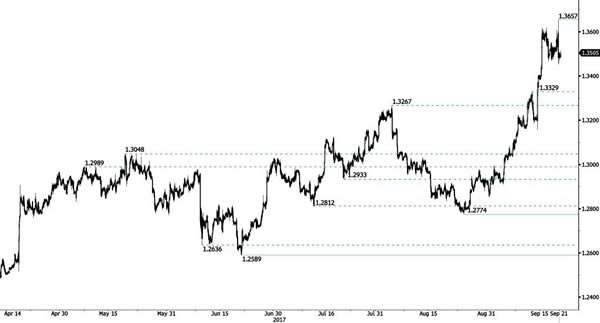
GBPUSD can be trading in a three-wave correction labeled as wave 4. We see sub-wave a and b already completed, which means current drop can now be sub-wave c in progress. Sub-wave c of 4 can later search for region of support near the former swing highs and lows of previous waves near the 1.3328 and 1.3381 level and make a reversal higher. Support can also be seen at the Fibonacci ratio 23.6 and 38.2.
GBPUSD, 1H
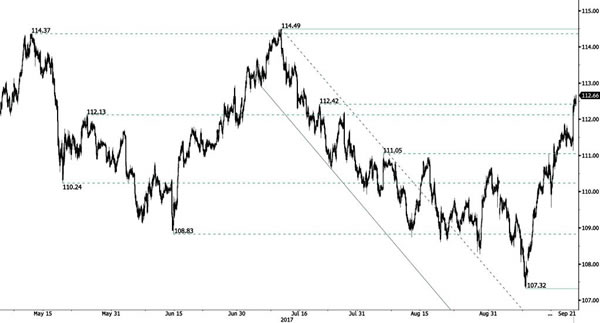
Dax is still trading in a correction of a higher degree labeled as wave 4). We see sub-wave A and possibly B completed, meaning one more drop lower into leg C can still follow. Support for the whole correction is near the former swing low of wave four at the 12472 level.
German DAX, 1H
Technical Outlook: WTI OIL – Overall Structure Remains Bullish And Favors Further Upside After Correction
WTI Oil price eases on Thursday, pressured by stronger dollar and another build in crude oil inventories, which rose by 4.5 million barrels last week, beating forecast for build of 3.49 million barrels.
Bulls are taking a breather after eight straight days in green that pushed oil price to fresh four-month high at $51.09 on Wednesday.
Oil price remains well supported, with recent comments that OPEC and top oil producers outside the cartel are considering an extension of output cut, offering additional support to oil price.
Current easing is seen as corrective action and positioning for further advance, with pullback to ideally hold above psychological $50 level and extended dips not to exceed strong support at $49.55 (broken 200SMA / Fibo 38.2% of $46.99/$51.09 upleg).
Oil price is currently riding on the third wave of five-wave cycle from $45.57, which cracked it 100% Fibonacci expansion at $50.83 and may extend to $51.74 (FE 123.6%) on sustained break above $50.83 pivot.
Res: 50.83, 51.09, 51.55, 51.74
Sup: 50.35, 50.00, 49.55, 49.04
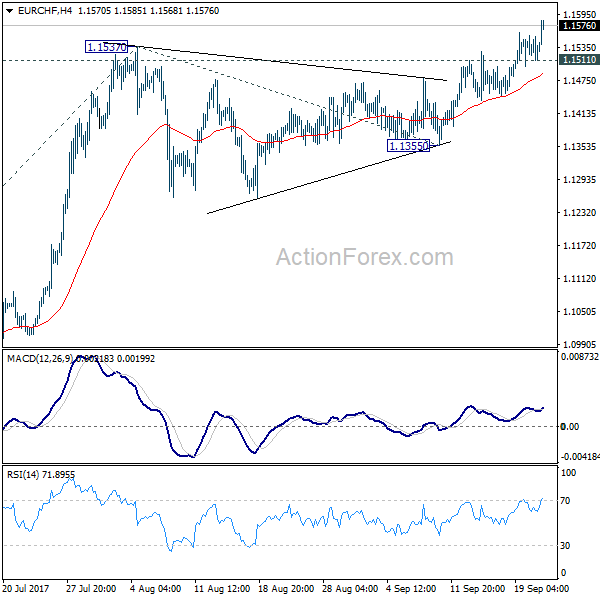
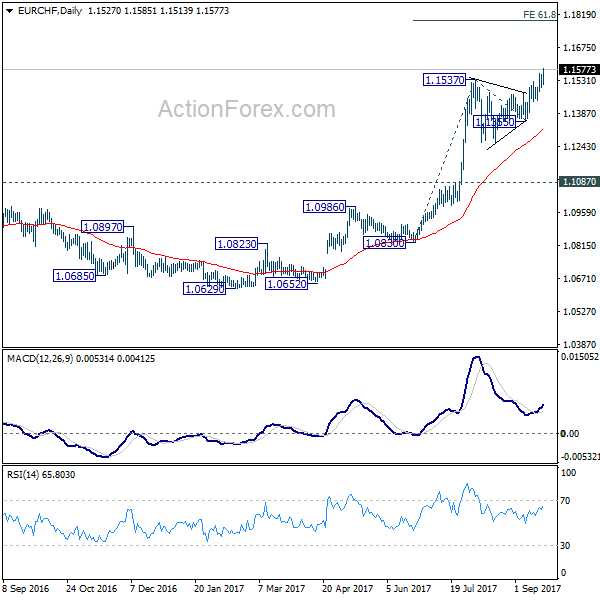
EUR/CHF Daily Outlook
Daily Pivots: (S1) 1.1510; (P) 1.1533; (R1) 1.1556; More... .
EUR/CHF's rally is still in progress and reaches as high as 1.1585 so far. Intraday bias remains on the upside for 61.8% projection of 1.0830 to 1.1537 from 1.1355 at 1.1792 next. On the downside, below 1.1511 minor support will turn intraday bias neutral and bring consolidations first.
In the bigger picture, long term rise from SNB spike low back in 2015 is still in progress. EUR/CHF should now be heading back to prior SNB imposed floor at 1.2000. For now, this will be the favored case as long as 1.1087 resistance turned support holds.
Trade Idea: GBP/USD – Sell at 1.3600
GBP/USD – 1.3509
Original strategy :
Buy at 1.3380, Target:1.3580, Stop: 1.3320
Position: -
Target: -
Stop: -
New strategy :
Sell at 1.3600, Target:1.3400, Stop: 1.3660
Position: -
Target: -
Stop:-
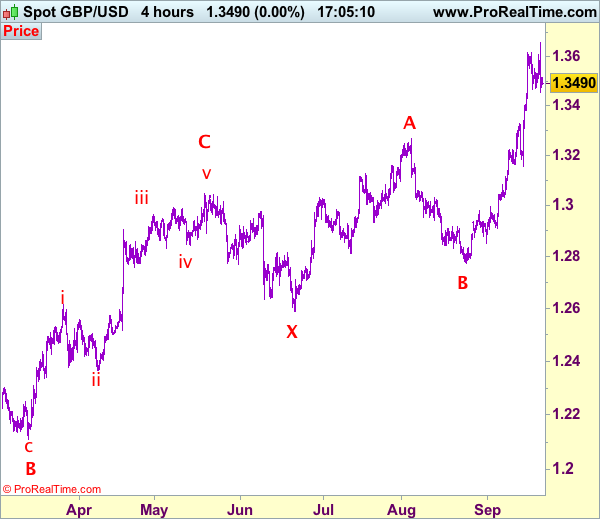
Although cable resumed recent rise to 1.3658 yesterday, lack of follow through buying and the subsequent retreat suggest top is possibly formed there and consolidation with mild downside bias is seen for weakness to 1.3380-85, however, break there is needed to add credence to this view, bring retracement of recent rally to 1.3350, then towards 1.3300-10 which is likely to hold form here.
In view of this, we are looking to turn short on recovery as 1.3590-00 should limit upside. Above said resistance at 1.3658 (yesterday’s post-Fed high) would signal recent upmove is still in progress and may extend headway to 1.3700. Our preferred count is that (pls see the attached chart) the wave IV is unfolding as a complex double three (ABC-X-ABC) correction with 2nd wave B ended at 1.2774, hence 2nd wave C is unfolding and may extend further gain to 1.3650, then 1.3700, however, overbought condition should limit upside to 1.3770-75 and reckon 1.3800-10 would hold from here, bring retreat later.
Our preferred count on the daily chart is that cable's rebound from 1.3500 (wave (A) trough) is unfolding as a wave (B) with A ended at 1.7043, followed by triangle wave B and wave C as well as wave (B) has ended at 1.7192, the subsequent selloff is the larger degree wave (C) which is still unfolding with minor wave (III) of larger degree wave 3 ended at 1.1986, hence wave (IV) correction is in progress which could either be a triangle wave (IV) of a complex formation but upside should be limited to 1.3500 and price should falter well below 1.4000, bring another decline in wave (V) of 3 for weakness to 1.1500, then 1.1200.
Technical Outlook: AUDUSD Deeply In Red After Fed / RBA Gov Lowe’s Speech
The Aussie is firmly in red in early Thursday's trading and accelerated stronger down after speech of RBA's governor Lowe, who said that the central bank has considerable independence and does not need to follow global trend, when most of major central banks were stuck in hawkish tone recently.
Lowe said the RBA is prepared to run its own race on setting the monetary policy, adding that rates will not go up for some time, but the raise of interest rates is more likely than cut.
Strong sell-off that followed Lowe's comments brought the pair near Monday's correction low at 0.7940.
Strong bids lay at this zone and may keep fresh bears limited for some time, but renewed bearish tone which is building after Wednesday's strong upside rejection and early Thursday's strong bearish acceleration, threatens of further weakness.
Clear break below 0.7940/29 (18 Sep low / Fibo 61.8% of 0.7807/0.8124 upleg) would spark fresh downside and expose supports at 0.7890/65 (daily cloud top / higher base).
Broken bull-trendline (0.8000) and south-turning daily Tenkan-sen (0.8021) mar good barriers which should cap recovery attempts.
Res: 0.8000, 0.8021, 0.8035, 0.8102
Sup: 0.7940, 0.7929, 0.7890, 0.7865
Trade Idea: GBP/JPY – Stand aside
GBP/JPY - 151.60
Original strategy:
Sold at 151.00, stopped at 151.05
Position: - Short at 151.00
Target: -
Stop: - 151.05
New strategy :
Stand aside
Position: -
Target: -
Stop:-
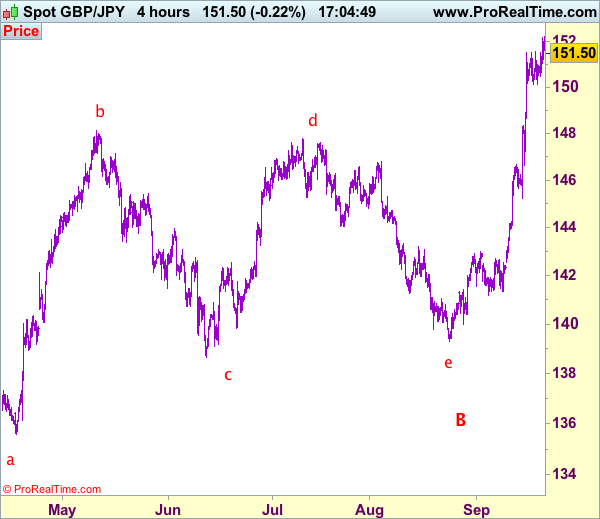
Although sterling resumed recent upmove yesterday as the pair broke above resistance at 151.59 and recent rally may extend gain to 152.50-60, loss of upward momentum should prevent sharp move beyond 153.00-10 and reckon 153.50-60 would hold from here, risk from there has increased for a retreat to take place later.
In view of this, would not chase this rise here and would be prudent to stand aside in the meantime. Below 151.00-05 would bring weakness towards support at 150.45-50 but only break of support at 150.10-15 would signal a temporary top is formed, bring retracement of recent rise to 150.00, then 149.50 but reckon 148.90-00 would hold form here.
Our preferred count is that larger degree wave V with circle is unfolding from 251.12 with wave (I) 219.34, (II): 241.38 and wave (III) is subdivided into 1: 192.60, 2: 215.89 (23 Jul 2008) and wave 3 ended at 118.87 earlier in 2009. The correction from there to 162.60 is wave 4 which itself is a double three and is labeled as first a-b-c ended at 151.53, followed by wave x at 139.03, 2nd a ended at 162.60, 2nd b at 146.75 and 2nd c leg of wave 4 ended at 163.00. Therefore, the decline from 163.00 to 116.85 is now treated as wave 5 which also marked the end of larger degree wave (III), hence wave (IV) major correction has commenced for retracement of the wave (III) from 241.38 and upside target at 183.95-00 (50% Fibonacci retracement of the wave (II) from 241.38) had been met, a drop below 160.00 would suggest wave (IV) has ended at 195.85, bring decline in wave (V) for initial weakness to 130 (already met) and 120.
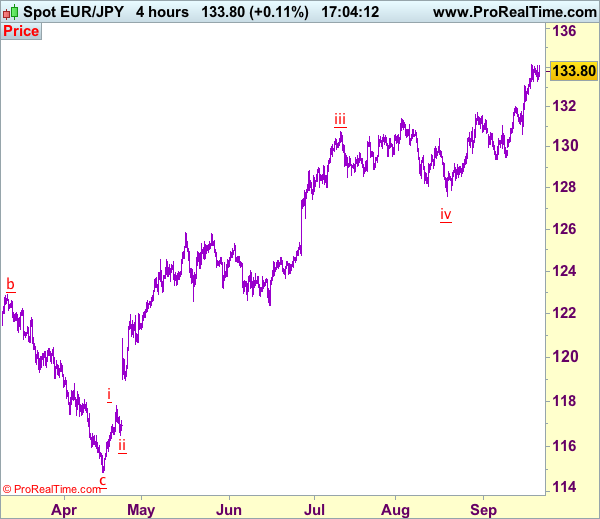
Trade Idea: EUR/JPY – Buy at 132.40
EUR/JPY - 133.82
Original strategy:
Buy at 132.40, Target: 134.40, Stop: 131.80
Position: -
Target: -
Stop: -
New strategy :
Buy at 132.40, Target: 134.40, Stop: 131.80
Position: -
Target: -
Stop:-
As the single currency has continued trading with a firm bias after recent rally, adding credence to our view that recent upmove is still in progress and bullishness remains for further gain to 134.50-60, then towards 135.00-10, however, near term overbought condition should limit upside and reckon 135.55-60 would hold from here, risk from there is seen for a retreat to take place later.
In view of this, we are looking to reinstate long on pullback as 132.30-40 should limit downside and bring another rise. Below support at 132.27 would defer and risk test of previous resistance at 132.01 (should turn into support) but only break there would signal a temporary top is formed, bring correction to 131.40-50 first.
Our latest preferred count is that wave (ii) is ABC-X-ABC which ended at 123.33 and wave (iii) is unfolding with wave iii ended at 100.77, followed by wave iv at 111.57 and wave v as well as the wave (iii) has ended at 97.04, followed by wave (iv) at 111.43 and wave (v) has ended at 94.12 which is also the end of the larger degree v, this also implied the major wave (C) has also ended there, hence major correction has commenced from there with (A) leg unfolding in its lower degree wave c which has possibly ended at 145.69. Under this count, A-B-C wave (B) has commenced with A leg ended at 136.23, wave B at 143.79 and wave C has possibly ended at 149.79.
Our larger degree count is that the decline from 139.26 is wave (C) and is sub-divided into a diagonal triangle i-ii-iii-iv-v with wave i - 105.44, wave ii- 123.33, wave iii - 97.03, wave iv - 111.43, followed by the final wave v as well as the end of wave (C) at 94.12, this also mark the bottom of larger degree wave B. Under this count, major rise in wave C has commenced as an impulsive wave with minor wave III ended at 145.69, wave V is still in progress for further gain to 150.00. Having said that, this so-called wave V could well be the first leg of larger degree 5-waver wave C and this wave C should bring at least a retest of wave A top at 169.97 (July 2008).