Sample Category Title
AUD/USD Daily Outlook
Daily Pivots: (S1) 0.7968; (P) 0.7994; (R1) 0.8033; More...
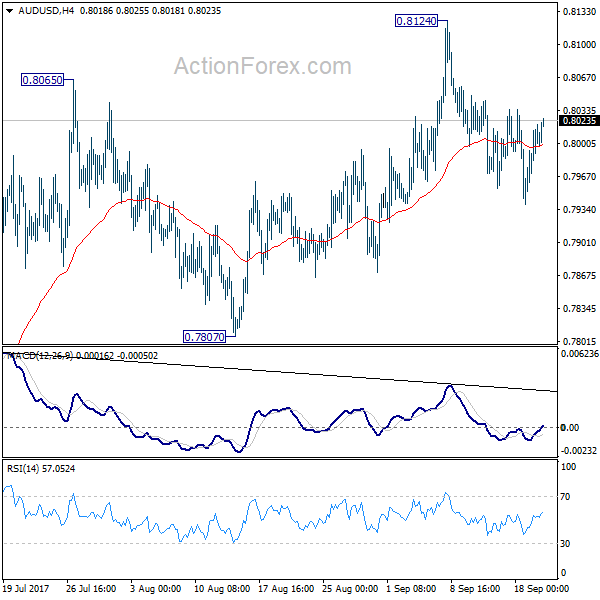
AUD/USD's recovery continues today but it's staying well below 0.8124 resistance. Intraday bias remains neutral for the moment. The consolidation from 0.8124 could extend further. Another fall cannot be ruled out. But still, with 0.7807 support intact, near term outlook stays bearish and another rise is expected. Break of 0.8124 will turn bias to the upside and target 100% projection of 0.6826 to 0.7833 from 0.7328 at 0.8335 next. However, considering bearish divergence condition in 4 hour MACD, firm break of 0.7807 will indicate near term reversal and turn bias back to the downside for 0.7328 key support.
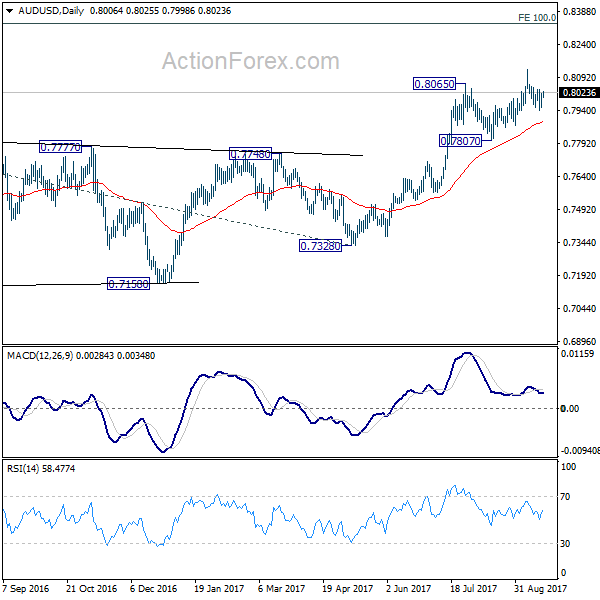
In the bigger picture, rise from 0.6826 medium term bottom is still in progress. At this point, there is no confirmation of trend reversal yet and we'll continue to treat such rebound as a corrective pattern. But in any case, break of 55 month EMA (now at 0.8090) will target 38.2% retracement of 1.1079 to 0.6826 at 0.8451. Break of 0.7807 support is needed to to be the first sign of completion of the rebound. Otherwise, further rise is now in favor.
Dollar Trading Mildly Lower as Fed Awaited, Little Reaction to Trump’s Threat to Totally Destroy North Korea
US equities surged to new records highs overnight as markets await FOMC's announcement on balance sheet normalization. DOW closed up 39.45 pts or 0.18% at 22370.80. S&P 500 gained 2.78 pts, or 0.11%, to 2506.65. 10 year yield also extended recent rebound and rose 0.014 to 2.243. But Dollar is trading generally lower in Asian session today. For the week, Euro, Aussie and Kiwi remain the strongest ones. Meanwhile, Canadian Dollar is under pressure as rate hike speculations cooled. Strong risk appetite in the market is pressuring Yen as the second weakest. Markets have little to response to US President Donald Trump's provocative talk to totally destroy North Korea.
Trump threatens to totally destroy North Korea
US President Donald Trump threatened to "totally destroy" North Korea if the US is "forced to defend itself of its allies" in his 42-minute speech to the United Nations. He called North Korean leader Kim Jong-Un as a "Rocket Man on a suicide mission for himself and for his regime". Trump also emphasized in his speech that "as President of the United States, I will always put America first." And he further commented that "just like you, as the leaders of your countries, will always and should always put your countries first."
UN Guterres warned of "fiery talk"
Earlier, United Nations Secretary General, Antonio Guterres, warned that "Fiery talk can lead to fatal misunderstandings, we must not sleepwalk our way into war." European Union Foreign Policy head Federica Mogherini also warned that "we don't talk never never of destroying countries but about trying to bring peace in the world." French President Emmanuel Macron also said firmly that "France rejects escalation", and "any military intervention must be avoided."
China: Pyongyang and Washington persistent pursuit of their own interests
An editorial in the China Daily criticized that "today's dangerous deadlock has been the result of Pyongyang's and Washington's persistent pursuit of their own interests in disregard of other countries' efforts to persuade the two antagonists to talk". And, "his threat to 'totally destroy' if need be will, therefore, likely worsen the already volatile situation." South Korean President Moon Jae-in said in a statement that "we view the speech as portraying a firm and specific stance on the key issues regarding keeping peace and safety that the international community and the United Nations are faced with." Japan Prime Minister Shinzo Abe is so far quiet on the topic.
Japan PMI Abe may push back timing for fiscal surplus
Talking about Abe, there are expectations that the will announce to dissolve the parliament after he returns from the US, and calls for a snap election, possibly next Monday. In a poll published yesterday, the conservative Sankei newspaper found 50.3% support for Abe's cabinet, up 6.5% from last month. Disapproval also fell 9% to 40%. That's well ahead of main opposition LDP, at 38%. It's reported that Abe might be planning to push back the timing of primary budget surplus by a few years, from fiscal 2020 to later in the decade. And he wants to go ahead with the scheduled sales tax hike from 8% to 10% in 2019. And then use some of the revenue for social security and education.
Fed to announce plan to unwind the USD 4.5T balance sheet
Looking ahead, FOMC policy announcement and press conference is the focus of the day. It's widely expected that Fed would formally announce the schedule of the long-awaited normalization of its USD 4.5T balance sheet. At the June meeting, the Fed revealed the plan to "gradually reduce" its securities holdings by "decreasing its reinvestment of the principal payments" received. Specifically, such payments will be reinvested only to the extent that they exceed gradually rising caps:
For payments of principal that the Federal Reserve receives from maturing Treasury securities, the Committee anticipates that the cap will be $6 billion per month initially and will increase in steps of $6 billion at three-month intervals over 12 months until it reaches $30 billion per month.
For payments of principal that the Federal Reserve receives from its holdings of agency debt and mortgage-backed securities, the Committee anticipates that the cap will be $4 billion per month initially and will increase in steps of $4 billion at three-month intervals over 12 months until it reaches $20 billion per month. The Committee also anticipates that the caps will remain in place once they reach their respective maximums so that the Federal Reserve's securities holdings will continue to decline in a gradual and predictable manner until the Committee judges that the Federal Reserve is holding no more securities than necessary to implement monetary policy efficiently and effectively.
More details are awaited as the plan is formalized. Inflation has remained persistently soft despite the upside surprise in the August data. We believe some members would raise concerns that weak price levels might last longer than previously anticipated. There might be downward revisions in the inflation forecast in 2018. Meanwhile, there are some speculations that the Fed might reduce its average Fed funds rates projections.
On the data front
New Zealand current account turned into NZD -0.62b deficit in Q2. Australia Westpac leading indicator dropped -0.1% mom in August. Japan trade surplus widened slightly to JPY 0.37T in August. German PPI and UK retail sales will be released in European session. US will release existing home sales.
AUD/USD Daily Outlook
Daily Pivots: (S1) 0.7968; (P) 0.7994; (R1) 0.8033; More...
AUD/USD's recovery continues today but it's staying well below 0.8124 resistance. Intraday bias remains neutral for the moment. The consolidation from 0.8124 could extend further. Another fall cannot be ruled out. But still, with 0.7807 support intact, near term outlook stays bearish and another rise is expected. Break of 0.8124 will turn bias to the upside and target 100% projection of 0.6826 to 0.7833 from 0.7328 at 0.8335 next. However, considering bearish divergence condition in 4 hour MACD, firm break of 0.7807 will indicate near term reversal and turn bias back to the downside for 0.7328 key support.
In the bigger picture, rise from 0.6826 medium term bottom is still in progress. At this point, there is no confirmation of trend reversal yet and we'll continue to treat such rebound as a corrective pattern. But in any case, break of 55 month EMA (now at 0.8090) will target 38.2% retracement of 1.1079 to 0.6826 at 0.8451. Break of 0.7807 support is needed to to be the first sign of completion of the rebound. Otherwise, further rise is now in favor.
Economic Indicators Update
| GMT | Ccy | Events | Actual | Forecast | Previous | Revised |
|---|---|---|---|---|---|---|
| 22:45 | NZD | Current Account Balance Q2 | -0.62B | -0.89B | 0.24B | 0.22B |
| 23:50 | JPY | Trade Balance (JPY) Aug | 0.37T | 0.41T | 0.34T | 0.36T |
| 00:30 | AUD | Westpac Leading Index M/M Aug | -0.10% | 0.12% | ||
| 06:00 | EUR | German PPI M/M Aug | 0.10% | 0.20% | ||
| 06:00 | EUR | German PPI Y/Y Aug | 2.50% | 2.30% | ||
| 08:30 | GBP | Retail Sales M/M Aug | 0.20% | 0.30% | ||
| 14:00 | USD | Existing Home Sales Aug | 5.46M | 5.44M | ||
| 14:30 | USD | Crude Oil Inventories | 5.9M | |||
| 18:00 | USD | FOMC Rate Decision | 1.25% | 1.25% | ||
| 18:30 | USD | FOMC Press Conference |
European Open Briefing: Asian Equity Markets Were Mostly Muted Early On Wednesday
Global Markets:
- Asian stock markets: Nikkei down 0.06 %, Shanghai Composite up 0.22 %, Hang Seng rose 0.16 %, ASX 200 down 0.09 %
- Commodities: Gold at $1316.40 (+0.44 %), Silver at $17.36 (+0.52 %), WTI Oil at $50.19 (+0.58 %), Brent Oil at $55.31 (+0.31%)
- Rates: US 10-year yield at 2.23, UK 10-year yield at 1.33, German 10-year yield at 0.45
News & Data:
- (EUR) German ZEW Economic Sentiment 17.0 vs 12.3 expected
- (CAD) Manufacturing Sales m/m -2.6 % vs -1.7 % expected
- (USD) Building Permits 1.30 M vs 1.22 M expected
- (USD) Current Account -123 B vs -115 B expected
- (USD) Housing Starts 1.18 M vs 1.17 M
- (USD) Import Prices m/m 0.6 % vs 0.4 % expected
- (NZD) GDT Price Index 0.9 % vs 0.3 % previous
- (NZD) Current Account -0.62 B vs -0.82 B expected
- Oil rises after Iraq signals possible OPEC cut extension- RTRS
Markets Update:
Asian equity markets were mostly muted early on Wednesday as investors remain cautious before the U.S. Federal Reserve’s policy announcement coming at the conclusion of the two-day meeting and another fresh round of geopolitical tensions after U.S. President Donald Trump threatened to annihilate North Korea.
EUR/USD gained 20+ points for the session but Price action was mostly subdued as Asian investors waited on the side-lines ahead of the FOMC. Price is currently seen trading at 1.2003 as the US Dollar weakened and lost 0.1 percent against the Euro. The dollar index, which tracks the dollar against a basket of currencies was flat and is currently valued at 91.74.
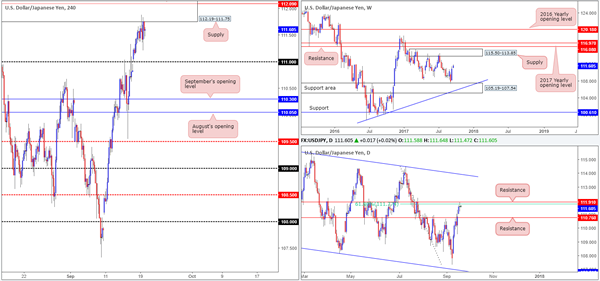
USD/JPY is currently seen trading steadily around 110.50 as the Yen gained 0.1% against the USD, Similar to Yesterday’s Asian session the yen was mostly seen ranging between 111.40 to 111.60 earlier today with no major movements. There were reports mentioning Japanese PM Abe is going to abandon his goal of achieving a primary budget surplus in 2020.
AUDUSD managed to break above round number 0.80 against the US Dollar on Tuesday and has managed to stay above the round number, The Aussie is currently seen ranging around 0.8020 with no major movements in today’s Asian session. The New Zealand dollar is currently seen trading around 0.73031 as the Kiwi lost over 40 pips against the US Dollar after rising to highs of 0.7342 earlier in the session.
Upcoming Events:
- 08:30 GMT – (GBP) Retail Sales m/m
- 14:00 GMT – (USD) Existing Home Sales
- 14:30 GMT – (USD) Crude Oil Inventories
- 18:00 GMT – (USD) FOMC Economic Projections
- 18:00 GMT – (USD) FOMC Statement
- 18:00 GMT – (USD) Federal Funds Rate
- 18:30 GMT – (USD) FOMC Press Conference
- 22:45 GMT – (NZD) GDP q/q
Daily Technical Analysis: EUR/USD Rising Wedge Struggles With Bullish Break At 1.20
Currency pair EUR/USD
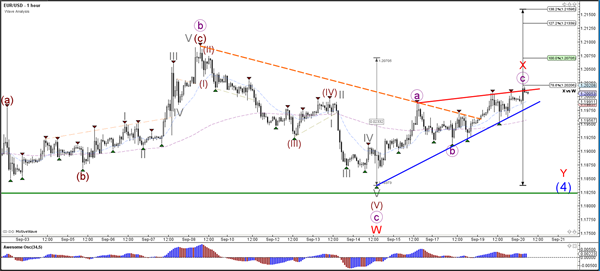
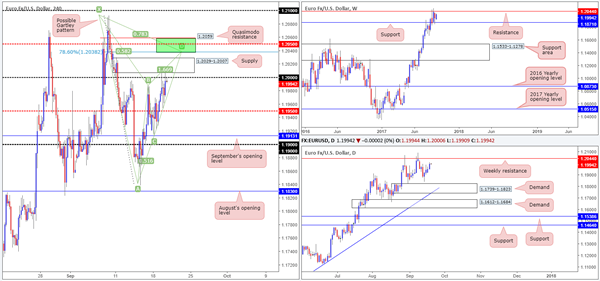
The EUR/USD respected the 78.6% Fibonacci resistance level of wave X vs W. Price could be building an extended WXY (red) correction within wave 4 (blue) unless price shows strong bullish candles once breaking above the resistance trend lines.
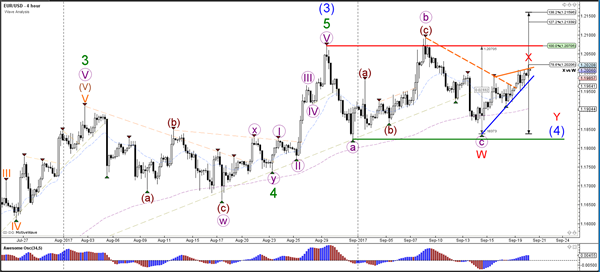
The EUR/USD seems to be building a rising wedge chart pattern at 1.20 when comparing the angle of the support (blue) trend line with the angle of the resistance (red). A break below support could see the start of wave Y (red) whereas a bullish break could see price test higher Fibonacci levels of wave X vs W.
Currency pair GBP/USD
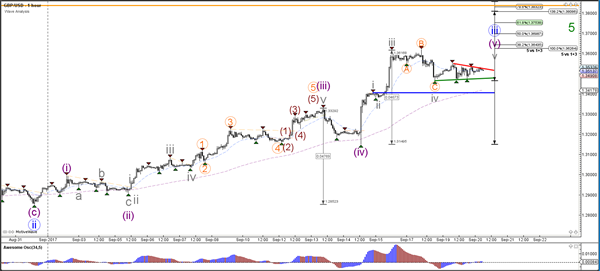
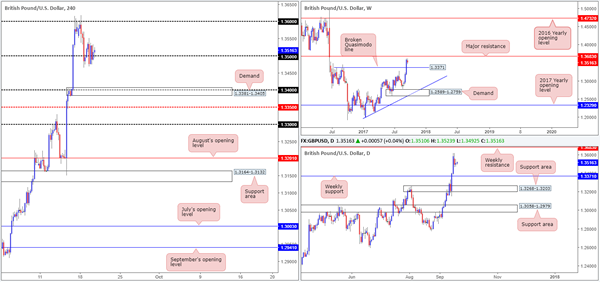
The GBP/USD is building a small triangle pattern (red/green) after its bearish retracement within the larger uptrend. A bullish breakout above resistance (red) could restart the wave 3 (blue).
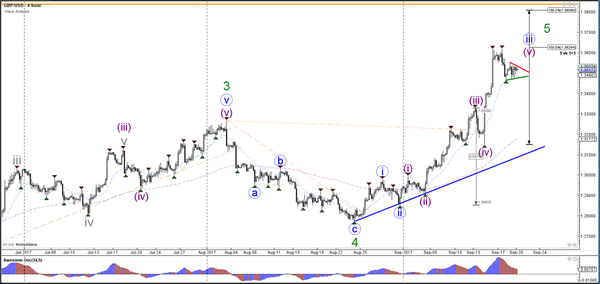
The GBP/USD is moving sideways and offers a key support (green) and resistance (red) trend line. A break below the top of wave 1 (blue) invalidates the wave 4 (grey).
Currency pair USD/JPY
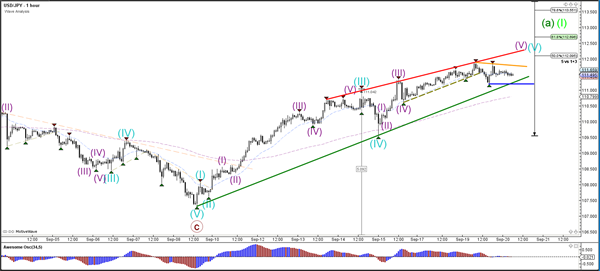
The USD/JPY seems to be in a 5th wave (blue) which could be part of a wave 1 (light green) or alternatively wave A (green).
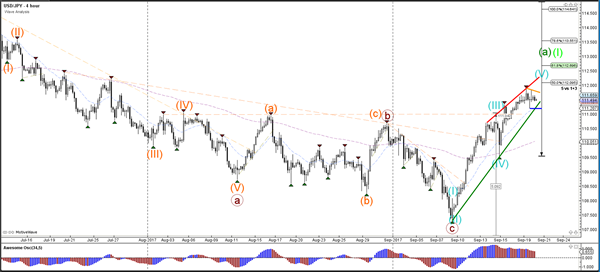
The USD/JPY is in a bullish trend channel (green/red). The bullish momentum could be finished if price manages to break below support (green/blue).
Daily Technical Outlook And Review: EUR/USD, GBP/USD, AUD/USD, USD/JPY, USD/CAD, USD/CHF, DOW 30, GOLD
A note on lower timeframe confirming price action...
Waiting for lower timeframe confirmation is our main tool to confirm strength within higher timeframe zones, and has really been the key to our trading success. It takes a little time to understand the subtle nuances, however, as each trade is never the same, but once you master the rhythm so to speak, you will be saved from countless unnecessary losing trades. The following is a list of what we look for:
- A break/retest of supply or demand dependent on which way you're trading.
- A trendline break/retest.
- Buying/selling tails ... essentially we look for a cluster of very obvious spikes off of lower timeframe support and resistance levels within the higher timeframe zone.
- Candlestick patterns. We tend to only stick with pin bars and engulfing bars as these have proven to be the most effective.
We typically search for lower-timeframe confirmation between the M15 and H1 timeframes, since most of our higher-timeframe areas begin with the H4. Stops are usually placed 1-3 pips beyond confirming structures.
EUR/USD
Thanks to a healthy bout of buying above the H4 mid-level number 1.1950 yesterday, the single currency was able to shake hands with the widely watched 1.20 handle. As expected, price marginally whipsawed through this psychological boundary and came into contact with nearby H4 supply pegged at 1.2029-1.2007.
For those who read Tuesday's report you may recall that we anticipated a bounce from here – well done to those who played this intraday move. Our reasoning behind only expecting a bounce lies within higher timeframe structure. On the weekly timeframe, the unit shows room to extend up to resistance at 1.2044. With such a major level planted above 1.20, the odds of price whipsawing through all of those stops above 1.20 is incredibly high, in our opinion.
Suggestions: Seeing as how H4 price is now seen chewing on 1.20 again, our expectation is for the pair to move higher today and touch gloves with the green area marked on the H4 chart at 1.2059/1.2038 (comprised of a H4 Quasimodo resistance at 1.2059, a H4 mid-level resistance at 1.2050, a H4 Harmonic bearish Gartley pattern completion at 1.2038 and also the weekly resistance at 1.2044).
For aggressive traders, you could look to short 1.2038 with stops above 1.2059, while a more conservative route might be to wait for price to strike the 1.2050 region and place stops above the X point of the Gartley pattern at 1.2092.
Data points to consider: US FOMC Projections, statement and press conference at 7-7.30pm GMT+1.
Levels to watch/live orders:
- Buys: Flat (stop loss: N/A).
- Sells: 1.2059/1.2038 region (stop loss: aggressive: 1.2061 conservative: 1.2094).
GBP/USD
It was a relatively quiet day for the British pound on Tuesday, with H4 price spending most of the segment seesawing back and forth around the 1.35 handle. To the upside, we see little stopping the pair from reaching the 1.36 handle, and likewise beyond 1.35 the path south looks clean to the 1.34 boundary (intersects with nice-looking H4 demand at 1.3381-1.3405).
Looking over to the higher timeframes, weekly action shows that despite the recent dip lower there's room for the major to stretch up to a weekly resistance at 1.3683. And with USDX weekly flow trading beneath resistance at 11854, there's a strong possibility GBP resistance will come into play sometime this week.
Suggestions: Although 1.35 has likely been weakened by Tuesday's movement, our desk is still biased to the upside for now. Aside from weekly USDX trading beneath resistance, both weekly and daily GBP charts show room to advance up to as far as 1.3683. For this reason, we remain keen buyers of 1.35. In the event that we are able to pin down a lower-timeframe buy setup from here (see the top of this report for ideas on how to use lower-timeframe action to enter), 1.36 will be the first port of call for us, followed by the major weekly resistance (thus giving us plenty of room to lock in substantial profits).
Data points to consider: UK Retail sales at 9.30am. US FOMC Projections, statement and press conference at 7-7.30pm GMT+1.
Levels to watch/live orders:
- Buys: 1.35 region ([waiting for a lower-timeframe buy signal to form is advised] stop loss: dependent on where one confirms this area).
- Sells: Flat (stop loss: N/A).
AUD/USD:
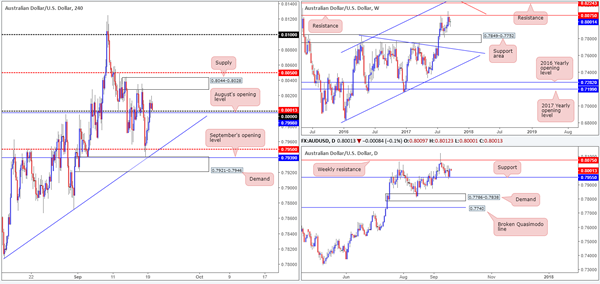
In recent dealings, the commodity currency continued to extend north after interacting with September's opening level at 0.7939. H4 price broke through both the large psychological level 0.80/August's opening level at 0.7998 and reached a high of 0.8019 on the day.
With H4 price currently retesting the 0.80 platform as we write, this will likely attract fresh buyers into the market today. However, upside is relatively limited given the nearby supply seen at 0.8044-0.8028. So, unless you manage to pin down a setup with a stop less than 15 pips, risk/reward parameters would likely be unfavorable here. Also of particular interest should be the fact that weekly price, although contained within a reasonably strong uptrend at the moment, has been selling off from resistance at 0.8075.
Suggestions: In the absence of more favorable price action, we have opted to remain flat for now.
Data points to consider: RBA Assist Gov. Ellis speaks at 4.05am. US FOMC Projections, statement and press conference at 7-7.30pm GMT+1.
Levels to watch/live orders:
- Buys: Flat (stop loss: N/A).
- Sells: Flat (stop loss: N/A).
USD/JPY:
For those who read Tuesday's report you may remember us mentioning that we had set a pending sell order around the underside of H4 supply (112.19-111.75) at 111.75, and placed a stop-loss order two pips beyond the area at 112.21. We also went on to write that should the order fill, which, as you can see, it has, we would be eyeing the 111 handle as an initial take-profit level.
Our reasoning behind taking a sell trade from here was as follows:
- H4 supply at 112.19-111.75.
- 112 handle.
- July's opening level at 112.09.
- Daily resistance at 111.91.
- Daily 61.8% Fib resistance at 111.77 taken from the high 114.49.
- USDX weekly chart trading beneath resistance at 11854.
Suggestions: Apart from our recent short call, we do not really have much else to hang our hat on for now.
Data points to consider: US FOMC Projections, statement and press conference at 7-7.30pm GMT+1.
Levels to watch/live orders:
- Buys: Flat (stop loss: N/A).
- Sells: 111.75 ([live] stop loss: 112.21).
USD/CAD
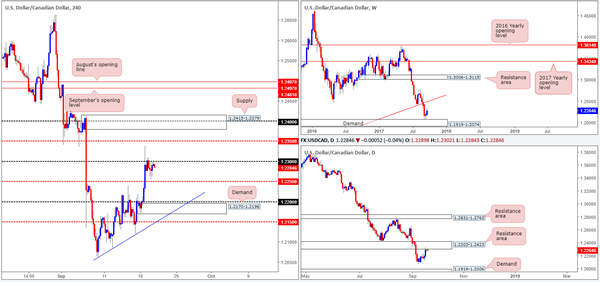
Trading was relatively lackluster on Tuesday as the H4 candles spent the day fastened to the underside of the 1.23 handle, probably helped by the fact that daily price is also connected to a resistance area coming in at 1.2303-1.2423. Should a violation of this number take place today, the next upside target can be seen around the H4 mid-level resistance at 1.2350, followed closely by a strong-looking H4 supply marked at 1.2415-1.2379. Contrary to both the H4 and daily charts, however, weekly price is currently seen trading from demand at 1.1919-1.2074, and shows space to stretch as far north as the weekly trendline resistance etched from the low 0.9633.
Suggestions: Technically speaking, this is not really a market we would generally look to trade. Reason being is a long would have you going up against potential daily and H4 sellers as well as the overall trend, but in-line with weekly structure. Conversely, a short, although in unison with the trend and daily/H4 action, would be against potential weekly buyers! Considering this, opting to stand on the sidelines may be the better path to take today.
Data points to consider: US FOMC Projections, statement and press conference at 7-7.30pm GMT+1.
Levels to watch/live orders:
- Buys: Flat (stop loss: N/A).
- Sells: Flat (stop loss: N/A).
USD/CHF
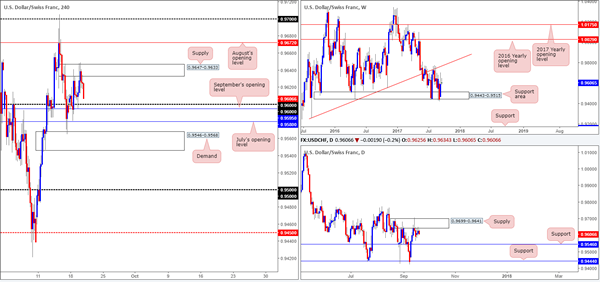
In recent trading, the USD/CHF pair has been consolidating between a H4 supply coming in at 0.9647-0.9633 and the 0.96 handle/September's opening level at 0.9595. In a similar fashion to Tuesday's report, we're sure you'll agree with us when we say H4 action is somewhat restricted at the moment. To the upside, not only do we have the current supply to contend with, there's also August's opening level at 0.9672 lurking nearby. To the downside, however, there's the 0.96 handle, two monthly opening levels (September/July – 0.9595/0.9580), shadowed closely by demand pegged at 0.9546-0.9568.
On top of this, the buyers and sellers on the weekly chart remain battling for position between a support area registered at 0.9443-0.9515 and a trendline resistance etched from the low 0.9257. Turning our attention to the daily timeframe, price remains capped by supply penciled in at 0.9699-0.9641. Should the Swissy bounce lower from here, the next area of support on tap can be seen at 0.9546.
Suggestions: With little ‘wiggle' room for H4 price to move, and not much credible direction over on the bigger picture, we'll place this market on the back burner for the time being and reassess structure tomorrow.
Data points to consider: US FOMC Projections, statement and press conference at 7-7.30pm GMT+1.
Levels to watch/live orders:
- Buys: Flat (stop loss: N/A).
- Sells: Flat (stop loss: N/A).
DOW 30
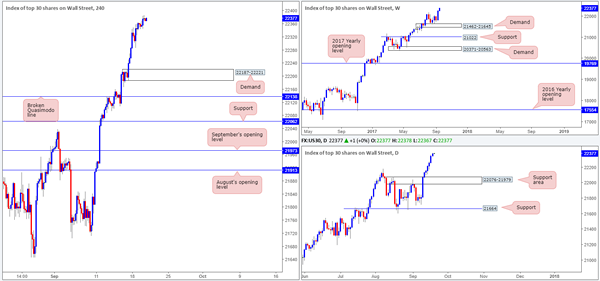
US stocks continued to push higher on Tuesday, registering a fresh record high of 22386.
As highlighted in yesterday's report, a pullback on the H4 timeframe could see price cross swords with the demand zone at 22187-22221. A violation of this area, however, likely opens the door for a test of the broken Quasimodo line at 22138, which happens to sit just above a daily support area fixed at 22076-21979.
Suggestions: With absolutely no resistances seen on the horizon, this is a buyers' market right now as far as we're concerned. As such, we'll continue to watch both the above said H4 supports for possible buying opportunities should the index dip lower.
Data points to consider: US FOMC Projections, statement and press conference at 7-7.30pm GMT+1.
Levels to watch/live orders:
- Buys: 22187-22221 ([waiting for a reasonably sized H4 bullish candle to form – preferably a full, or near-full-bodied candle – is advised] stop loss: ideally beyond the candle's tail). 22138 ([waiting for a reasonably sized H4 bullish candle to form – preferably a full, or near-full-bodied candle – is advised] stop loss: ideally beyond the candle's tail).
- Sells: Flat (stop loss: N/A).
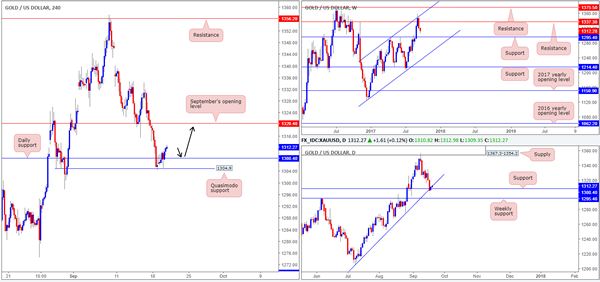
GOLD:
The H4 Quasimodo support at 1304.9 has, as you can see, held up beautifully yesterday. Removing nearby offers from daily resistance at 1308.4, the yellow metal, according to the H4 timeframe, is now relatively free to rally north up to September's opening level at 1320.4. In addition to this, take note of the daily trendline support extended from the low 1205.0 fuses with the aforesaid daily support.
Aside from weekly price showing room to decline down to support at 1295.4, we have to remember that the USDX weekly chart actually shows sellers kissing the underside of resistance at 11854. Therefore, we believe there's strong evidence that gold may rally higher today. With that being said, a long trade taken on any retest seen at the daily support could be an option today (see black arrows).
Suggestions: In view of the possibility of a downside move being seen on the weekly scale, we would highly recommend not placing pending buy orders at the noted daily support level. Instead, wait for price to strike the level and assess using H4 candle action whether there is credible buyer intent present (a full, or near-full-bodied bull candle).
Levels to watch/live orders:
- Buys: 1308.4 region ([waiting for a reasonably sized H4 bullish candle to form – preferably a full, or near-full-bodied candle – is advised] stop loss: ideally beyond the candle's tail).
- Sells: Flat (stop loss: N/A).
Elliott Wave View: NZDUSD
NZDUSD Short Term Elliott Wave view suggests that the Index shows a 5 swing sequence from 8/31 low favoring further upside. Rally from 8/31 low (0.7128) is unfolding as a double three Elliott Wave structure. Up from 0.7128, Minute wave ((w)) ended at 0.7338 and Minute wave ((x)) ended at 91.71. Wave ((y)) is currently in progress and the subdivision is also unfolding as a double three Elliott wave structure. Minutte wave (w) of ((y)) ended at 0.7344 and Minutte wave (x) of ((y)) ended at 0.7246. Near term, while pullbacks stay above 0.718, expect pair to extend higher. We don’t like selling the pair.
NZDUSD 1 Hour Elliott Wave Chart
Double three ( 7 swings) is the most important pattern in Elliott wave’s new theory. It is also probably the most common pattern in the market these days. Double three is also known as a 7-swing structure. It is a very reliable pattern that gives traders a good opportunity to trade with a well-defined level of risk and target areas. The image below shows what Elliott Wave Double Three looks like. It has labels (W), (X), (Y) and an internal structure of 3-3-3. This means that all 3 legs has corrective sequences. Each (W) and (Y) is formed by 3 wave oscillations and has a structure of A, B, C or W, X, Y of smaller degrees.
Inflation Slowdown: Transitory or Persistent?
The devastation caused by Hurricanes Harvey and Irma has raised questions over whether the near-term hit to the economy will keep the Fed from raising the fed funds rate once more this year. The biggest hurdle for the Fed squeezing in one more rate increase by year end, however, is inflation. The disruptions caused by storms even as large as Harvey and Irma are widely acknowledged to be short term for the national economy, with the hit to growth more than made up in subsequent quarters by rebuilding efforts. Whether the weakness in inflation since the start of the year can be as quickly reversed is less clear. In this note, we explore the factors that have contributed to the slowdown in inflation since the start of the year to determine if it is likely to be temporary or if below-target inflation is likely to persist.
Inflation Has Rolled Over
Headline and core personal consumption expenditures (PCE) inflation strengthened over the course of 2016 as the impact of lower oil prices and a rising dollar faded. Expectations, at least in the market, also improved late in the year following inflation's pickup and optimism about more pro-growth policies out of Washington. In January, the PCE deflator hit 2.0 percent for the first time since 2012. Since then, however, inflation has rolled over (Figure 1). Not only has the headline measure been falling since February, but core PCE inflation hit its lowest level since 2015 in July. Whereas in 2015 Fed officials were able to point to the strengthening dollar and collapse in commodity prices as factors holding down inflation temporarily, the drivers of the recent slowdown have been more varied and therefore less easily labeled as transitory. The pullback is once again fanning fears about whether the Fed can reach its inflation target of 2 percent on a sustained basis.
Energy Whipsaws Headline Inflation Again
A 0.4 percent month-over-month rebound in the August consumer price index (CPI) hints that previous months' softness may have been temporary, but a look across categories sheds light on whether the latest move is more noise or a signal. No categories are as noisy on a monthly basis as food and energy, which is why they are stripped out in calculating core inflation (Figure 2). While monthly changes fluctuate greatly and may not be indicative of the underlying direction of inflation, the trend in energy and food inflation remains important given that these components collectively comprise more than 20 percent of the consumption basket. Since price changes in food and energy are highly visible to consumers, they also play an outsized role in setting inflation expectations.
Commodities prices, most notably for crude oil but also for raw metals and agricultural crops, have suffered in the last three years as a result of supply increases and weak global demand (Figure 3). This marks a reversal in trend from the early years of the expansion, when prices rose substantially to reach peaks in mid-2011 and mid-2014. In fact, rising oil prices during the recession were a key reason why the United States did not see greater disinflation despite unemployment that reached 10 percent in 2009. This effect is largely because rising prices at the pump supported inflation expectations during this period (Figure 4).
Recently, lower commodities prices may be having the opposite impact, holding down inflation both directly and through expectations. Whereas energy prices added 0.72 percentage points to year-over-year headline inflation in January, their 12-month contribution slipped to 0.45 percentage points in August. Gasoline prices are rising once again due to refinery outages and shortages caused by hurricanes Harvey and Irma, but we expect these effects to be shortlived. With oil prices expected to hover around $50 per barrel, little different than current levels, energy should have a relatively subdued effect on the inflation trend compared to historical standards in the coming months. Similarly, we expect food prices to remain relatively steady on the back of flatness in agricultural crop prices and increased competition in the grocery sector.
Core Weakness More Troublesome for the Fed
More concerning for Fed officials, core inflation has also slowed since the start of the year. After coming within a whisker of the FOMC's target in January, the core PCE deflator has fallen back to 1.4 percent on a year-ago basis. Core CPI has slowed more dramatically, falling from 2.3 percent to 1.7 percent in August. A breakdown of core goods and core services shows that both have weakened since the start of the year and contributed to the moderation in inflation.
Goods prices have been a drag on the core index for the better part of the past four years. Soft inflation globally, a stronger dollar and technology have led to broad declines across components in recent years. Deflation in this sector has intensified, however, since the start of the year and has shaved an additional tenth of a percentage point off headline CPI since January (Figure 5). About half the slowdown in core goods inflation since the start of the year can be attributed to declining prices for new and used motor vehicles. Pressure on car prices may ease in the next few months due to replacement demand generated by the recent storms, but the lift is likely to be short term given that the number vehicles coming off-lease is expected to reach another record high in 2018. In contrast, the drag from apparel prices and other imported consumer goods is likely to ease as the dollar weakens further over the next year.
Core services, on the other hand, have been supportive of headline inflation, with prices consistently increasing at a rate above 2 percent (Figure 6). Since the start of the year, however, services inflation has declined markedly, from above 3 percent year-over-year for the 13 months ending in February to around 2.5 percent for the past four months. At 60 percent of the CPI, this has led to core services contributing 35 basis points less to headline inflation since January.
The slowdown within core services can be largely attributed to three components: cell phone services, medical care and housing (Figure 7). The declining cost of mobile phone services is the largest contributor to decelerating services inflation; prices for this component dropped every month this year on a year-ago basis, with the slowdown accelerating from January to August. The drop reflects both quality adjustments in how the BLS prices cell phone services and stiffer competition among providers that have reduced the price tag for unlimited data plans. Unless another similarly steep price war manifests, the most unfavorable readings will drop out of the 12-month change in inflation by March.
Medical care services have also contributed to the slowdown in headline inflation since the start of the year, adding 13 basis points less to the headline in August versus January. While some of the weakening can be traced to slower growth in the cost for health insurance, lower out-of-pocket costs for physician care has been a larger factor. The first outright decline in this component since data began in 1980 looks suspect to us, and indexes at this level should be interpreted cautiously given the sample size and response rate.
Whereas we suspect the hit to inflation from wireless and medical services will not be sustained, the slowdown in housing costs may be more persistent. Year-over-year shelter cost inflation ticked up in the August CPI reading compared to July, but growth remains below rates seen in the first quarter of this year. With housing costs at historic highs in many major metros, the limits of affordability will likely weigh on price growth going forward. Additionally, a deluge of rental units is beginning to put pressure on some industry measures of apartment rent, which tend to lead the rent component of CPI (Figure 8).
Recent Weakness Is Transitory But Expect Only a Modest Rebound
Despite having slowed since the start of the year, we expect inflation to resume its upward trend in the coming months. The pickup will be driven by multiple sources. After rising 25 percent from the middle of 2014 through the end of 2016 on a trade-weighted basis, the dollar is expected to weaken over the coming year as the Fed is no longer the only major central bank signaling less policy accommodation. The pullback should reduce pressure on core goods prices, as import prices of consumer goods closely track the value of the dollar (Figure 9). Similarly, the uptick in inflation globally suggests less disinflationary pressure from abroad.
At only 19 percent of the CPI, however, the reduced pressure on core goods inflation will still be rather small. Therefore, a rebound in service costs will be needed to get inflation back on track. While the relationship between the labor market and inflation has weakened in recent years, it has not completely disappeared.2 Unemployment may tick up in the next couple of months following hurricane-related work disruptions, but the trend remains downward (Figure 10). We expect employment costs to edge up further with the labor market near full employment. Meanwhile, the recent declines in wireless and physician services look unsustainable.
That is not to say we expect a rapid reversal of the weakness earlier this year. The near-term bounce to energy prices from Hurricanes Harvey and Irma is likely to be short lived. Food price inflation is also expected to remain weak given recent commodity price movements and industry competition. Gains in core inflation should also be limited. Not only are prices for autos and housing hitting some resistance, but wage gains will remain hindered by sluggish productivity growth and low inflation expectations.
Temporary, But Fed Officials Will Need to See More
Slower inflation since the start of the year has been troubling in part due to its breadth. Not only has headline inflation weakened on another pullback in energy prices, but core inflation has also moderated. In contrast to the 2014-2015 bout of weakening related to oil prices and the value of the dollar, even core services inflation has slowed.
The rebound in August headline and core CPI has hinted at a pickup in the remaining months of the year. Hurricanes Harvey and Irma are also likely to boost inflation in the near term, most notably via energy prices, but also potentially through hotel and vehicle prices. While the lift from energy and autos may fade toward the end of the year and into 2018, other areas within core inflation should provide an offset as the dollar declines and labor costs edge higher.
Will an upswing in inflation come in time for the FOMC to raise rates once more before the end of the year? In June, the majority of committee's members still expected to see one additional rate increase this year. Lower inflation readings over the summer will likely pare back September's projections for core inflation at year end, which in turn could push out the appropriate timing for the Fed's next rate hike. Coupled with the nascent runoff of the Fed's balance sheet, more committee members are likely to display some hesitancy in supporting an additional rate hike. Yet there will be three more releases of PCE and CPI inflation data ahead of the FOMC's December meeting. While this time-frame might not be long enough to boost the year-over-year readings of inflation, it should be enough to signal a shift in momentum. The trend in inflation remains tenuous, but we believe enough of the recent softness is transitory that we are not writing off one more rate hike in 2017 just yet.
Market Morning Briefing: Continued Rise In The Euro-Yen
STOCKS
Cautious on Nifty as it is trading below important resistances. Dow, Nikkei and Dax look bullish. Shanghai could be in the initial phase of a corrective fall.
Dow (22370.80, +0.18%) is in an uptrend and is inching up slowly. AS mentioned earlier we may see a test of 22500-22600 levels in the coming sessions.
Dax (12561.79, +0.02%) paused a bit yesterday but looks bullish for the near term targeting 12650-12680 initially.
Nikkei (20298.80, -0.00%) is heading towards 20500 in the coming sessions. For the medium term 21000 is a very crucial resistance (Note 20800-20700 are interim resistances below 21000) and could push the index back towards 20100 or lower in the longer run.
Shanghai (3353.82, -0.09%) is trading flat and has been stable this week below 3370. There is a decent chance that the index would come off towards 3325 or even lower in the coming sessions.
Nifty (10147.55, -0.05%) has been slowly inching up breaking immediate resistances on its way to 10200-10300 soon. Note 10200 seem to be a decent resistance on the 3-day line charts. Need to be cautious for any signs of a corrective dip from near current levels.
COMMODITIES
Brent (55.39) and WTI (50.23) are stable and may come off from current levels in the next few sessions. While below 56.00 and 50.81, there could be an initial sideways consolidation followed by a dip towards 54.50 and 49 respectively.
Gold (1312.28) bounced back from levels near 1303 itself (we had expected a test of 1296) and could move up towards 1320. While above 1300, some bullish possibilities remain towards 1330 else a break below 1300-1296 could make the price vulnerable to a sharp fall.
Silver (17.30) is up from levels of 17.18 and could now move up towards 17.50.
Copper (2.98) is holding above 2.95 support and could move up towards 3.00-3.05 in the coming sessions. Near term could be sideways to bullish.
FOREX
Some hours to go for the FOMC. The Dollar Index (91.7260) trades lower, the Euro (1.2009) and Aussie (0.8013) trade higher, retaining their uptrends.
Should the Euro (1.2009) manage to see 1.2035-50, one of the two possibilities mentioned a couple of days ago, it may also try to move further up towards 1.2115+. The Aussie (0.8013) has done well for itself by bouncing from the mentioned Support at 0.7960 yesterday and again looks like it could test 0.8050.
Continued rise in the Euro-Yen (133.92). Although it seems to be breaking into new bullish territory, we note that the current level is the 61.8% retracement of the fall from 149.51 (Dec '14) to 109.42 (Jun '16). Just a point to be noted. Dollar-Yen (111.52) has been stable since yesterday, conceding to the overall Dollar weakness. Chances of further rise to 113.00-50 exist. Confirmation needed in form of rise past 111.90.
The Pound (1.3523) dipped to 1.3468, but has moved back up a bit. It looks consolidative between 1.3450-3600 for a couple of days now.
A bit of a dip in the Dollar-Yuan (USDCNY = 6.568) today after a near-test of 6.60 yesterday. Some more upside may be possible, but need to watch. The Rupee weakened to 65.33 yesterday along with weakness in some to the BRIC currencies. Need to see if there is follow-through buying towards 64.40-50 or not.
INTEREST RATES
FOMC tonight. US yields have been rising since 11-Sep, but have Resistances overhead. The 30Yr (2.81%) has Resistance at the current level while the 10Yr (2.24%) and 5Yr (1.83%) have Resistances near 2.25-26% and 1.85-86% respectively.
There are chances that the US 30-10 (0.57%) and 30-5 (0.97%) Yr Spreads might move up again from near current levels. This suggests chances that the US 10Yr and 5Yr could dip soon. This further suggests chances of a dovish FOMC tonight.
The German-US 10Yr Spread (-1.78%) trades marginally lower than Monday's -1.76%. Need to see if this moves up after the FOMC or not. It might.
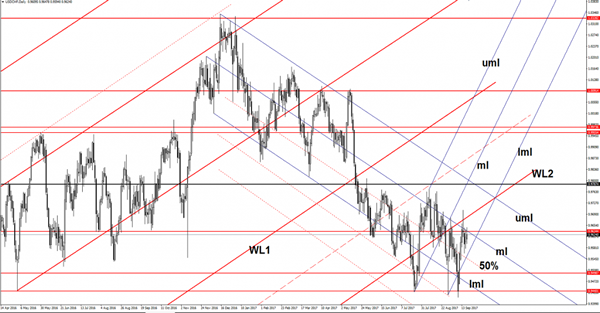
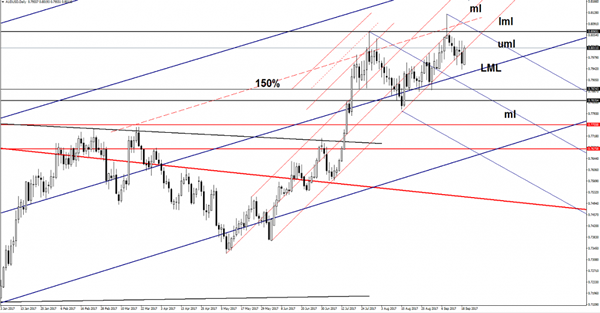
AUD/USD False Breakdown?
AUD/USD rallied on Tuesday and tries to stay within the minor ascending pitchfork’s body. Has failed to reach and retest the lower median line (LML) of the major ascending pitchfork. Technically, it was expected to reach this level and even to breakdown under it. Could come back up to retest the upper median line (uml) of the minor descending pitchfork before will drop further.
USD/CHF Facing Tough Resistance
The pair has resumed the yesterday's bullish candle, but remains to see if will have enough directional energy to climb much higher. Price is pressuring the median line (ml), remains to see if will have enough energy to close above it and above the 0.9634 level. A valid breakout will confirm a further increase within the minor ascending pitchfork's body.