
Sample Category Title
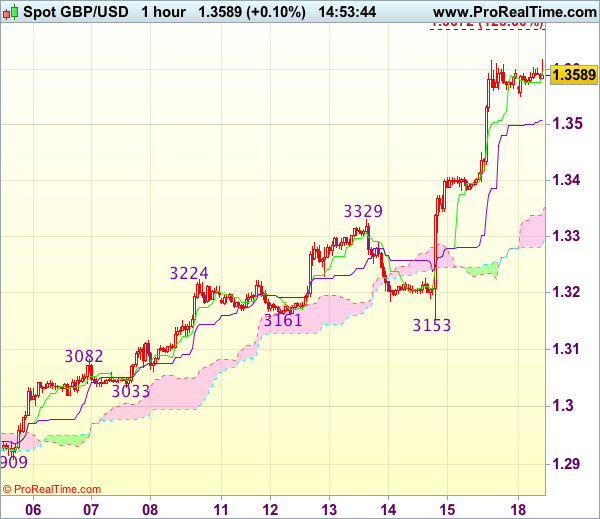
Trade Idea : GBP/USD – Buy at 1.3420
GBP/USD - 1.3577
Most recent candlesticks pattern : N/A
Trend : Up
Tenkan-Sen level : 1.3595
Kijun-Sen level : 1.3518
Ichimoku cloud top : 1.3359
Ichimoku cloud bottom : 1.3302
Original strategy :
Buy at 1.3490, Target: 1.3600, Stop: 1.3455
Position : -
Target : -
Stop : -
New strategy :
Buy at 1.3420, Target: 1.3600, Stop: 1.3385
Position : -
Target : -
Stop : -
Although cable edged higher in London morning to 1.3619, lack of follow through buying on break of Friday’s high at 1.3617 and current retreat suggest consolidation with initial mild downside bias would be seen and pullback to the Kijun-Sen (now at 1.3518) cannot be ruled out, however, reckon downside would be limited to 1.3420-30 and bring another rise later, above said resistance at 1.3619 would extend recent upmove to 1.3650 and possibly towards 1.3675 but upside should be limited to 1.3700-10, bring retreat later.
In view of this, would not chase this rise here and would be prudent to buy cable on subsequent pullback as 1.3420-30. Only below 1.3380-85 would defer and signal a temporary top is formed, bring retracement of recent rise to 1.3350, then 1.3320-25 but lower Kumo (now at 1.3302) should remain intact.
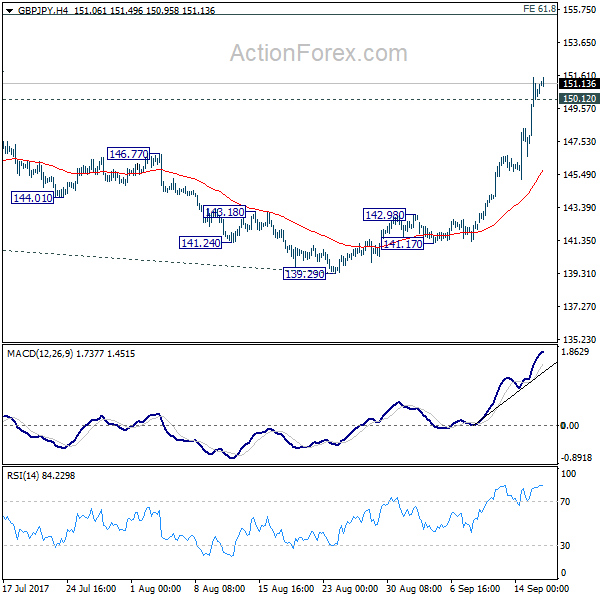
GBP/JPY Daily Outlook
Daily Pivots: (S1) 147.53; (P) 149.54; (R1) 152.53; More
Intraday bias in GBP/JPY remains on the upside for the moment. Current medium term rise from 122.36 should target 61.8% projection of 122.36 to 148.42 from 139.29 at 155.39 next. On the downside, below 150.12 minor support will turn intraday bias neutral and bring consolidation before staging another rally.
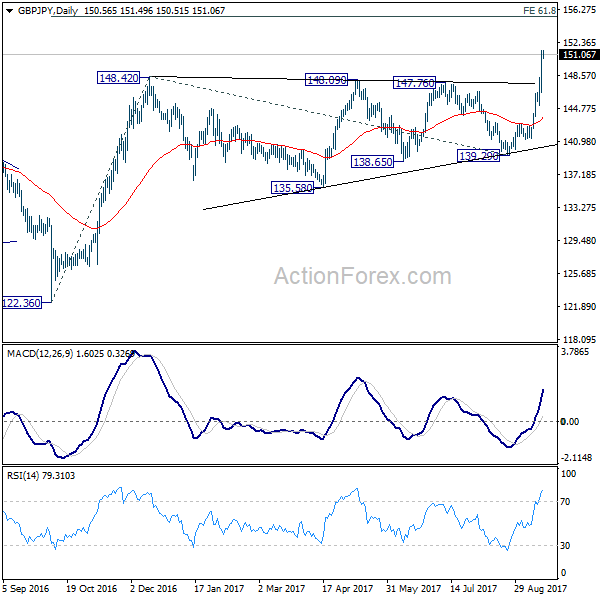
In the bigger picture, the consolidation from 148.42 should have completed and medium term rebound from 122.36 is resuming. Firm break of 38.2% retracement of 196.85 to 122.36 at 150.43 will carry long term bullish implications. In that case, GBP/JPY could target 61.8% retracement at 167.78. For now, the bullish scenario is preferred as long as 139.29 support holds.
Euro-Zone’s Trade Surplus Shrunk In July
For the 24 hours to 23:00 GMT, the EUR rose 0.5% against the USD and closed at 1.1953 on Friday.
On the macro front, the Euro-zone's seasonally adjusted trade surplus narrowed more-than-expected to €18.6 billion in July, from a revised trade surplus of €21.7 billion in the previous month, while market participants were expecting the region to post a surplus of €20.3 billion.
The greenback lost ground against a basket of currencies, dragged down by a slew of downbeat economic reports from the US.
Data indicated that advance retail sales in the US unexpectedly fell 0.2% in August, dipping to a six-month low level, as sales were partially disrupted by impact of the Hurricane Harvey. Advance retail sales had climbed by a revised 0.3% in the previous month, whereas investors had envisaged for a gain of 0.1%.
Moreover, the nation's industrial production surprisingly declined 0.9% in August, dropping to a more than eight-year low level, as massive storm depressed the nation's oil drilling, petroleum refining and other industrial activity. Markets had anticipated industrial production to rise 0.1%, after recording a revised rise of 0.4% in the prior month. Additionally, the nation's manufacturing production recorded an unexpected drop of 0.3% in August, confounding market consensus for an increase of 0.3%. In the previous month, manufacturing production had recorded a revised flat reading.
In other economic news, the US flash Reuters/Michigan consumer sentiment index eased to a level of 95.3 in September, less than market expectations for a fall to a level of 95.0. In the prior month, the index had registered a reading of 96.8. Also, the nation's New York Empire State manufacturing index slightly fell to a level of 24.4 in September, compared to a reading of 25.2 in the prior month. On the contrary, the nation's business inventories rose 0.2% in July, in line with market expectations. In the previous month, business inventories had risen 0.5%.
In the Asian session, at GMT0300, the pair is trading at 1.1945, with the EUR trading 0.07% lower against the USD from Friday's close.
The pair is expected to find support at 1.1904, and a fall through could take it to the next support level of 1.1862. The pair is expected to find its first resistance at 1.1987, and a rise through could take it to the next resistance level of 1.2028.
Moving ahead, traders will focus on the Euro-zone's final consumer price inflation data for August, slated to release in a few hours. Moreover, the US NAHB housing market index for September, scheduled to release later in the day, will be on investors' radar.
The currency pair is showing convergence with its 20 Hr moving average and trading above its 50 Hr moving average.

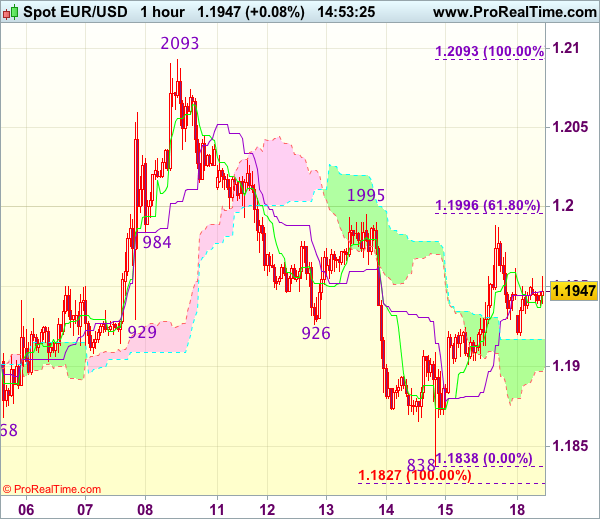
Trade Idea : EUR/USD – Buy at 1.1905
EUR/USD - 1.1940
Most recent candlesticks pattern : N/A
Trend : Near term down
Tenkan-Sen level : 1.1945
Kijun-Sen level : 1.1951
Ichimoku cloud top : 1.1917
Ichimoku cloud bottom : 1.1900
New strategy :
Buy at 1.1905, Target: 1.2005, Stop: 1.1870
Position : -
Target : -
Stop : -
Although the single currency retreated after meeting resistance at 1.1988 on Friday, last week’s anticipated rebound from 1.1838 suggests low has possibly been formed there and downside should be limited to 1.1900-05, bring another rebound later to 1.1995-00 (previous resistance and 61.8% Fibonacci retracement of 1.2093-1.1838), however, break there is needed to signal the fall from 1.2093 has ended, bring subsequent rise to 1.2030-35 and then 1.2050-55.
In view of this, we are looking to buy euro again on dips as 1.1900-05 should limit downside and bring another rebound. Below 1.1865-70 would abort and suggest the rebound from 1.1838 (last week’s low) has ended, bring retest of this level first.
Interest Rate Could Rise In The Coming Months: BoE’s Vlieghe
For the 24 hours to 23:00 GMT, the GBP rose 1.45% against the USD and closed at 1.3597 on Friday, propelled by upbeat comments from one of the dovish Bank of England's (BoE) committee member.
The BoE policymaker, Gertjan Vlieghe, vowed for a near-term interest rate hike, if the economy continues to strengthen as expected.
In the Asian session, at GMT0300, the pair is trading at 1.3593, with the GBP trading slightly lower against the USD from Friday's close.
Overnight data revealed that the nation's Rightmove house price index eased 1.2% on a monthly basis in September, following a drop of 0.9% in the prior month.
The pair is expected to find support at 1.3447, and a fall through could take it to the next support level of 1.3302. The pair is expected to find its first resistance at 1.3677, and a rise through could take it to the next resistance level of 1.3762.
Trading trend in the Pound today is expected to be determined by a speech from the BoE Governor, Mark Carney, scheduled later in the day.
The currency pair is trading above its 20 Hr and 50 Hr moving averages.

EUR/JPY Daily Outlook
Daily Pivots: (S1) 130.97; (P) 132.02; (R1) 133.46; More...
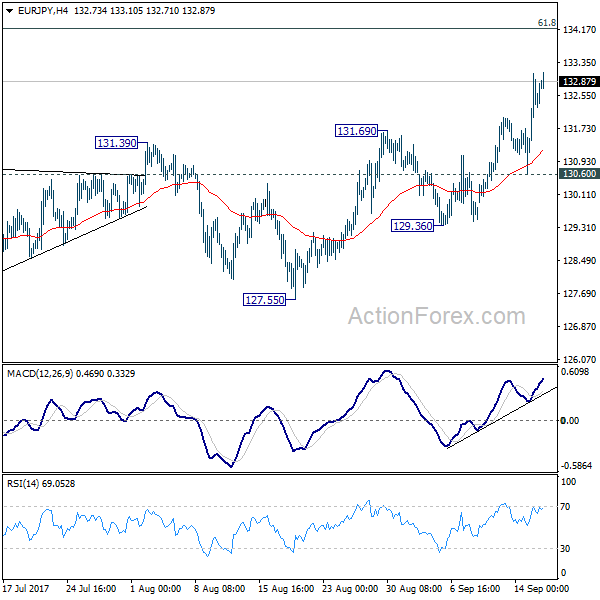
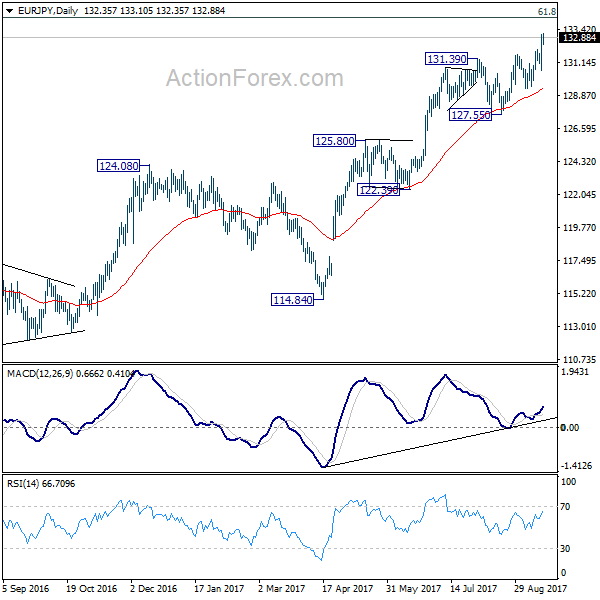
Intraday bias in EUR/JPY remains on the upside for the moment. Current medium term rise should target 134.20 fibonacci level next. Firm break there will pave the way to 141.04 resistance next. On the downside, break of 130.60 support is needed to indicate short term topping. Otherwise outlook will remain bullish in case of retreat.
In the bigger picture, current rise from 109.03 is seen as at the same degree as the down trend from 149.76 (2014 high) to 109.03 (2016 low). as long as 124.08 resistance turned support holds, further rise is expected to 61.8% retracement of 149.76 to 109.03 at 134.20. Sustained break there will pave the way to key long term resistance zone at 141.04/149.76. ON the downside, break of 127.55 support is needed to be the first signal of medium term reversal. Otherwise, outlook will remain bullish.
Trade Idea : USD/JPY – Stand aside
USD/JPY - 111.33
Most recent candlesticks pattern : N/A
Trend : Up
Tenkan-Sen level : 111.20
Kijun-Sen level : 110.92
Ichimoku cloud top : 110.30
Ichimoku cloud bottom : 110.16
New strategy :
Stand aside
Position : -
Target : -
Stop : -
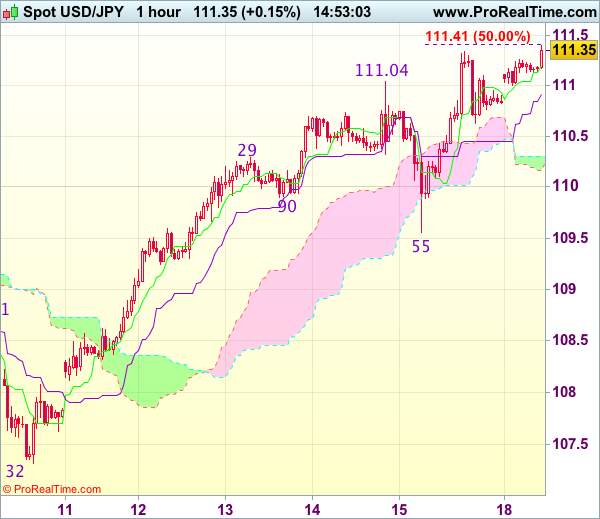
Although the greenback has edged higher again after last week’s rally and bullishness remains or recent reversal from 107.32 low to extend gain to 111.41-45 (50% projection of 107.32-111.04 measuring from 109.55), however, reckon upside would be limited to 111.85-90 (61.8% projection) and price should falter below 112.00-10, risk from there has increased for a correction later.
In view of this, would not chase this move here and would be prudent to stand aside for now. Below the Kijun-Sen (now at 110.92) would bring correction to 110.60-65 and downside should be limited to 110.30-35, price should stay above 110.00, bring rebound later.
Japanese Yen Trading On A Weaker Footing This Morning
For the 24 hours to 23:00 GMT, the USD rose 0.38% against the JPY and closed at 110.85 on Friday.
In the Asian session, at GMT0300, the pair is trading at 111.21, with the USD trading 0.32% higher against the USD from Friday’s close.
The pair is expected to find support at 110.42, and a fall through could take it to the next support level of 109.64. The pair is expected to find its first resistance at 111.66, and a rise through could take it to the next resistance level of 112.12.
The currency pair is trading above its 20 Hr and 50 Hr moving averages.

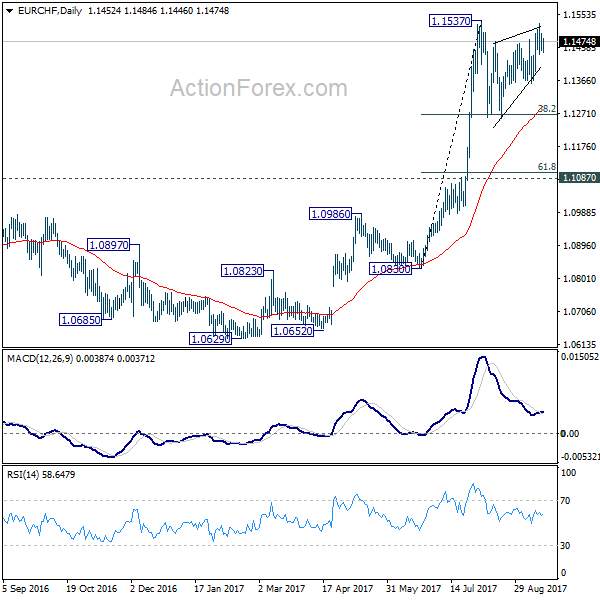
EUR/CHF Daily Outlook
Daily Pivots: (S1) 1.1436; (P) 1.1468; (R1) 1.1487; More... .
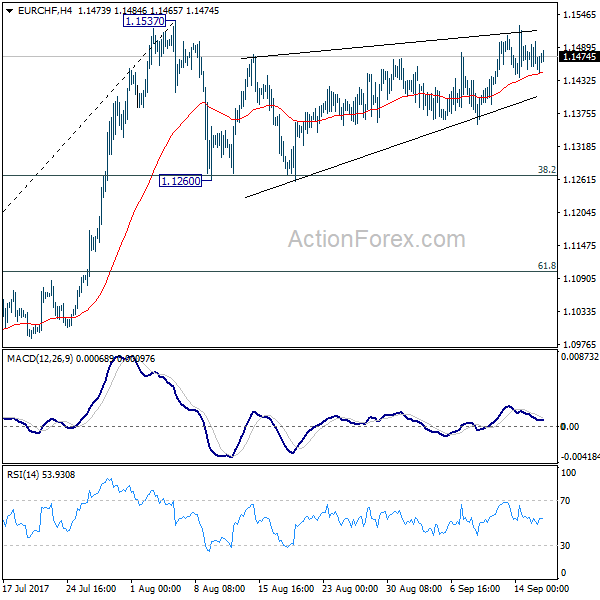
Intraday bias in EUR/CHF remains neutral as consolidation from 1.1537 is still in progress. Another fall could be seen. But in that case, downside should be contained by 38.2% retracement of 1.0830 to 1.1537 at 1.1267 to bring rebound. On the upside, break of 1.1537 resistance will confirm resumption of larger rally from 1.0629. In that case, EUR/CHF should target 1.2 key resistance level next.
In the bigger picture, long term rise from SNB spike low back in 2015 is still in progress. EUR/CHF should now be heading back to prior SNB imposed floor at 1.2000. For now, this will be the favored case as long as 1.1087 resistance turned support holds.
Swiss Franc Reverses Its Gains In The Asian Session
For the 24 hours to 23:00 GMT, the USD declined 0.74% against the CHF and closed at 0.9595 on Friday.
In the Asian session, at GMT0300, the pair is trading at 0.9605, with the USD trading 0.1% higher against the CHF from Friday's close.
The pair is expected to find support at 0.9564, and a fall through could take it to the next support level of 0.9524. The pair is expected to find its first resistance at 0.9646, and a rise through could take it to the next resistance level of 0.9688.
With no major macroeconomic releases in the Switzerland today, investors will look forward to global macroeconomic events for further direction.
The currency pair is showing convergence with its 20 Hr moving average and trading below its 50 Hr moving average.
