Sample Category Title
Canada’s Existing Home Sales Rose For The First Time In 4 Months In August
For the 24 hours to 23:00 GMT, the USD traded flat against the CAD and closed at 1.2179 on Friday.
Macroeconomic data showed that Canada's existing home sales rebounded 1.3% on a monthly basis in August, advancing for the first time since March 2017. In the previous month, existing home sales had dropped 2.1%.
In the Asian session, at GMT0300, the pair is trading at 1.2181, with the USD trading a tad higher against the CAD from Friday's close.
The pair is expected to find support at 1.2129, and a fall through could take it to the next support level of 1.2078. The pair is expected to find its first resistance at 1.2225, and a rise through could take it to the next resistance level of 1.2270.
The currency pair is showing convergence with its 20 Hr and 50 Hr moving averages.

EUR/USD Daily Outlook
Daily Pivots: (S1) 1.1862; (P) 1.1892 (R1) 1.1947; More...
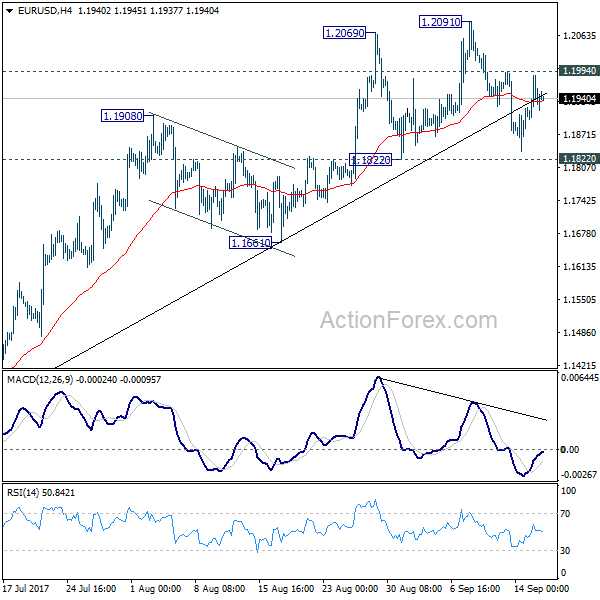
Intraday bias in EUR/USD remains neutral for the moment. With 1.1822 support intact, near term outlook stays bullish for another rise. Above 1.1994 minor resistance will turn bias to the upside for 1.2091 first. Break there will extend larger rise from 1.0339 and target next key fibonacci level at 1.2516. But considering bearish divergence condition in 4 hour MACD, break of 1.1822 will confirm short term topping and bring deeper fall back to 1.1661 support and below.
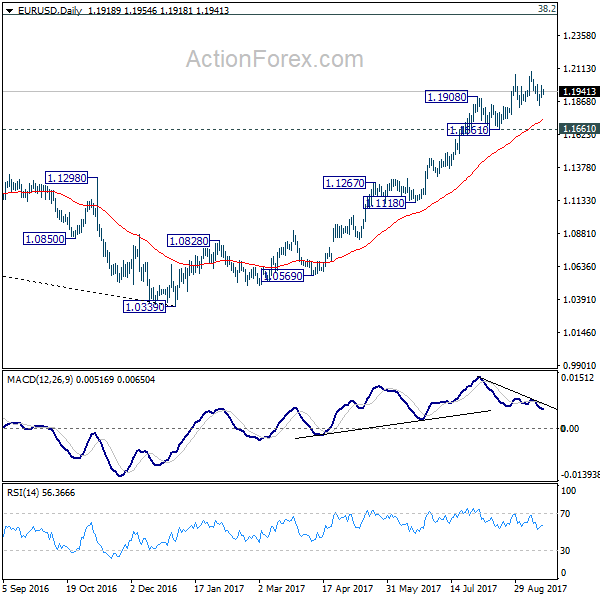
In the bigger picture, rise from medium term bottom at 1.0339 is still in progress for 38.2% retracement of 1.6039 (2008 high) to 1.0339 (2017 low) at 1.2516. However, it should be noted that there is no confirmation of trend reversal yet. That is, such rebound from 1.0399 could be a correction. And the long term fall fro 1.6039 (2008 high) could resume. Hence, we'd be cautious on strong resistance from 1.2516 to limit upside. But after all, break of 1.1661 is needed to indicate medium term topping. Otherwise, outlook will remain bullish in case of pull back.
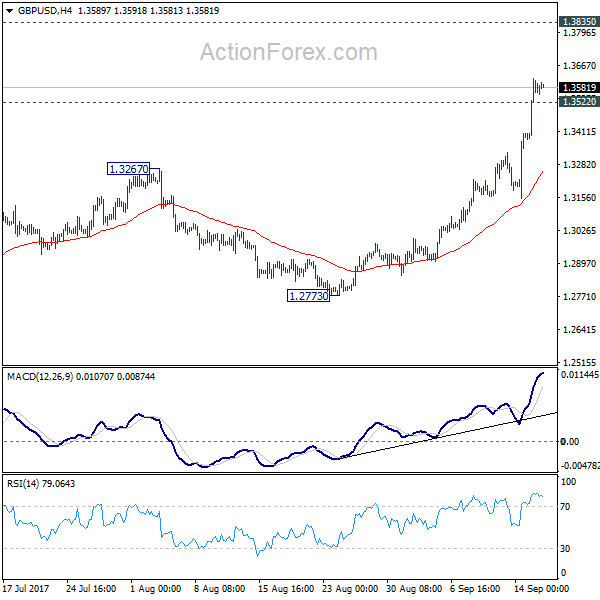
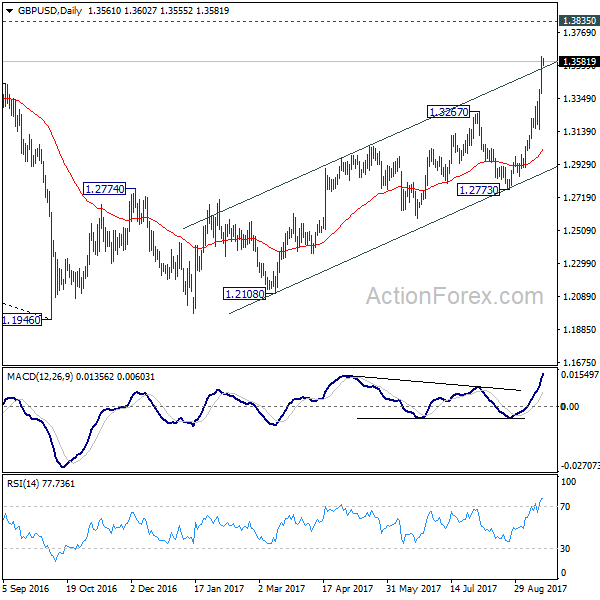
GBP/USD Daily Outlook
Daily Pivots: (S1) 1.3435; (P) 1.3526; (R1) 1.3674; More...
Intraday bias in GBP/USD remains on the upside for the moment. current medium term rally should extend to 1.3835 support turned resistance next. Break there will target 55 month EMA (now at 1.4405). On the downside, below 1.3522 minor support will turn intraday bias neutral and bring consolidations, before staging another rally.
In the bigger picture, the strong break of 1.3444 key resistance now argues that the long term trend in GBP/USD has reversed. That is a key bottom was formed back in 1.1946 on bullish convergence condition in monthly MACD. Current rise from 1.1946 will target 38.2% retracement of 2.1161 (2007 high) to 1.1946 (2016 low) at 1.5466 next. In any case, medium term outlook will now stay bullish as long as 1.2773 support holds.
European Open Briefing: Asia-Pacific Equity Markets Were Higher On Monday
Global Markets:
- Asian stock markets: Nikkei up 0.52 %, Shanghai Composite rose 0.25 %, Hang Seng gained 0.99 %, ASX 200 rose 0.5 %
- Commodities: Gold at $1321.49 (-0.28 %), Silver at $17.63 (-0.35 %), WTI Oil at $50.46 (+0.04 %), Brent Oil at $55.70 (+0.14 %)
- Rates: US 10-year yield at 2.20, UK 10-year yield at 1.30, German 10-year yield at 0.43
News & Data:
- (AUD) New Motor Vehicle Sales m/m 0.0 % vs -2.4 % previous
- (USD) Core Retail Sales m/m 0.2 % vs 0.5 % expected
- (USD) Retail Sales m/m -0.2 % vs 0.1 % expected
- (USD) Empire State Manufacturing Index 24.4 vs 18.2 expected
- (USD) Capacity Utilization Rate 76.1 % vs 76.8 % expected
- (USD) Industrial Production m/m -0.9 % vs 0.1 % expected
- (USD) Prelim UoM Consumer Sentiment 95.3 vs 95.1 expected
- Oil markets firm on rising refinery demand, falling U.S. rig count- RTRS
- Dollar edges up vs yen, hovers near seven-week high ahead of Fed- RTRS
CFTC Positioning Data:
- EUR long 86K vs 96K long last week.
- GBP short 46K vs 54K short last week.
- JPY short 57K vs 73K short last week.
- CHF short 2K vs 2K short last week.
- CAD long 50K vs 54K long.
- AUD long 63k vs 65k last week.
- NZD long 12K vs 15K long last week.
Markets Update:
Asia-Pacific equity markets were higher on Monday following a record-breaking Wall street session and Australia’s benchmark index rebounding from three straight sessions of declines as investors piled into risk assets amid optimism that the U.S. favors a peaceful resolution to North Korea’s nuclear threats and no new provocation by North Korea over the weekend.
USDJPY opened up around 40 pips early on Monday and has since stabilized around 111.20 currently. Overall, the Japanese Yen continues to lose value as it lost 0.3 percent against the US Dollar, extending Friday’s 0.5 percent drop. Bank of Japan is widely expected to maintain its massive asset buying campaign at a meeting on Thursday.
EURUSD is little changed from its late levels on Friday and is currently seen trading around 1.1934. The Euro had hit a 2-1/2-year high reaching $1.2092 earlier this month. The dollar index, which tracks the dollar against a basket of currencies was flat and is currently valued at 91.87 after losing 0.3 percent on Friday.
AUDUSD is currently seen Trading at 0.8024 as the Australian Dollar put up a strong show outperforming on the session rising 0.3 percent against the US Dollar. Australia’s main index added 0.5 percent rebounding from three straight sessions of declines. Similarly, the New Zealand dollar is seen trading at 0.7320 after the Kiwi added 0.3 percent against the USD.
Upcoming Events:
- All Day – JPY Bank Holiday
- 08:00 GMT – (EUR) Italian Trade Balance
- 09:00 GMT – (EUR) Final CPI y/y
- 09:00 GMT – (EUR) Final Core CPI y/y
- 10:00 GMT – (EUR) German Buba Monthly Report
- 12:30 GMT – (CAD) Foreign Securities Purchases
- 14:30 GMT – (GBP) ECB's Lautenschlaeger Speaks
- 20:00 GMT – (USD) TIC Long-Term Purchases
The Week Ahead:
Tuesday, September 19th
- 01:30 GMT – (AUD) Monetary Policy Meeting Minutes
- 01:30 GMT – (AUD) HPI q/q
- 09:00 GMT – (EUR) German ZEW Economic Sentiment
- 12:30 GMT – (CAD) Manufacturing Sales m/m
- 12:30 GMT – (USD) Building Permits
- 12:30 GMT – (USD) Current Account
- 12:30 GMT – (USD) Housing Starts
- 12:30 GMT – (USD) Import Prices m/m
- 22:45 GMT – (NZD) Current Account
Wednesday, September 20th
- 08:30 GMT – (GBP) Retail Sales m/m
- 14:00 GMT – (USD) Existing Home Sales
- 14:30 GMT – (USD) Crude Oil Inventories
- 18:00 GMT – (USD) FOMC Economic Projections
- 18:00 GMT – (USD) FOMC Statement
- 18:00 GMT – (USD) Federal Funds Rate
- 18:30 GMT – (USD) FOMC Press Conference
- 22:45 GMT – (NZD) GDP q/q
Thursday, September 21st
- Tentative – (JPY) Monetary Policy statement
- Tentative – (JPY) BOJ Policy Rate
- Tentative – (JPY) BOJ Press Conference
- 08:30 GMT – (GBP) Public Sector Net Borrowing
- 12:30 GMT – (CAD) Wholesale Sales m/m
- 12:30 GMT – (USD) Unemployment Claims
- 12:30 GMT – (USD) Philly Fed Manufacturing Index
Friday, September 22nd
- All Day – (NZD) Parliamentary Elections
- 07:00 GMT – (EUR) French Flash Manufacturing PMI
- 07:00 GMT – (EUR) French Flash Services PMI
- 07:30 GMT – (EUR) German Flash Manufacturing PMI
- 07:30 GMT – (EUR) German Flash Services PMI
- 08:00 GMT – (EUR) Flash Manufacturing PMI
- 08:00 GMT – (EUR) Flash Services PMI
- 12:30 GMT – (CAD) CPI m/m
- 12:30 GMT – (CAD) Core Retail Sales m/m
- 12:30 GMT – (CAD) Common CPI y/y
- 12:30 GMT – (CAD) Median CPI y/y
- 12:30 GMT – (CAD) Retail Sales m/m
- 12:30 GMT – (CAD) Trimmed CPI y/y
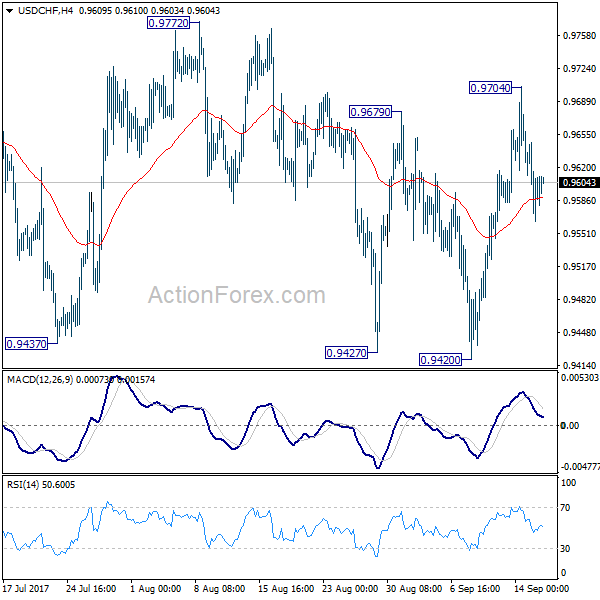
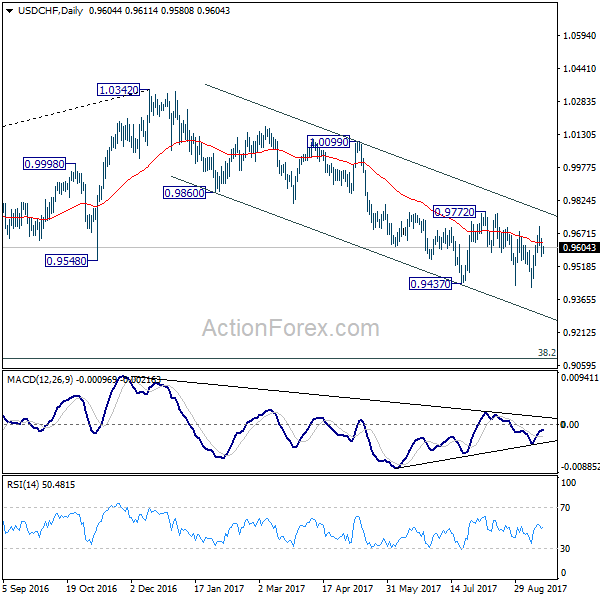
USD/CHF Daily Outlook
Daily Pivots: (S1) 0.9556; (P) 0.9602; (R1) 0.9638; More....
Intraday bias in USD/CHF remains mildly on the downside for 0.9420 support. With 0.9772 resistance intact, outlook remains bearish. Break of 0.9420 will resume medium term fall from 1.0342 and target next long term fibonacci level at 0.9090. However, firm break of 0.9772 will indicate trend reversal and turn outlook bullish.
In the bigger picture, current development suggests that 0.9443 key support (2016 low) could be taken out firmly as down trend form 1.0342 extends. There are various interpretation of the price actions. But in any case, medium term outlook will stay bearish as long as 0.9772 resistance holds. Current down trend could extend to 38.2% retracement of 0.7065 (2011 low) to 1.0342 (2016 high) at 0.9090. However, break of 0.9772 will indicate that USD/CHF has successfully defended 0.9443 again and turn outlook bullish for 1.0099 resistance.
Daily Technical Analysis: GBP/USD Bull Flag Continuation Chart Pattern Targets 1.3750
Currency pair GBP/USD
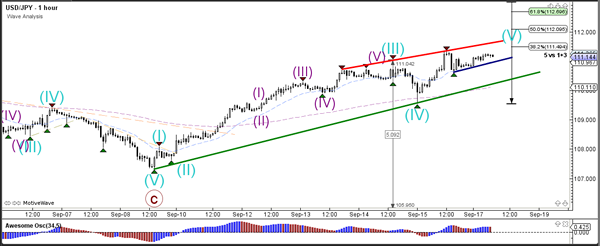
The GBP/USD bullish momentum is strong and probably part of a wave 3 (blue). The resistance line (orange) is a potential resistance from the daily chart.
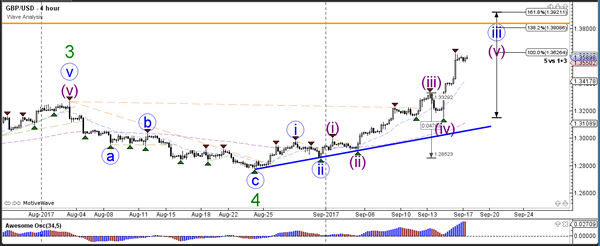
The GBP/USD is building a bull flag chart pattern (red/blue), which is a continuation pattern within the uptrend. The Fibonacci levels of wave 4 vs 3 (grey) are most likely support whereas a break above the bull flag could see price challenge the Fibonacci targets of wave 5 (grey/purple).
Currency pair EUR/USD
The EUR/USD seems to have completed an ABC correction (red) within the wave 4 (blue). A bullish breakout could indicate the continuation of the uptrend via wave 5 (blue).
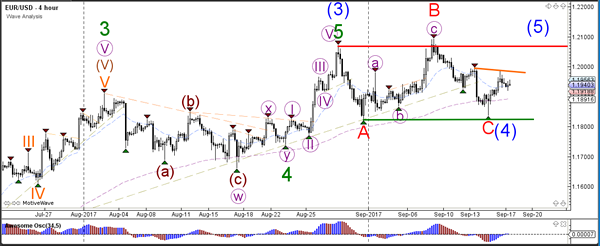
The wave 4 (blue) might become extended via a WXY formation (red) if price develops a 3 wave pattern (purple).
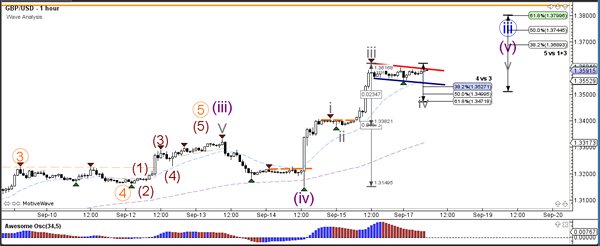
Currency pair GBP/USD
The USD/JPY is challenging the strong horizontal resistance level (red), which could indicate the end of a wave 1 (light green) or alternatively wave A (green).
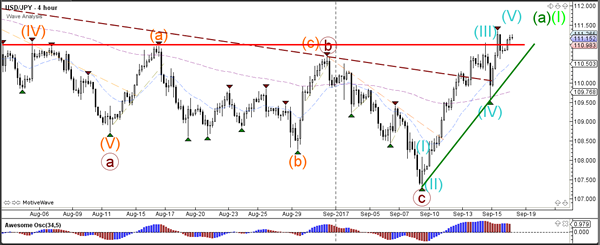
The USD/JPY break below the support trend lines (green/blue) could indicate a bearish ABC correction. Otherwise price could still continue slightly higher within the wave 5 (blue).
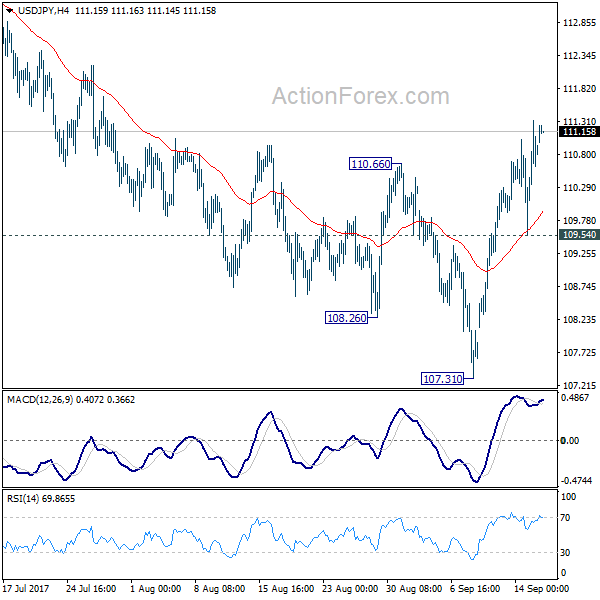
USD/JPY Daily Outlook
Daily Pivots: (S1) 109.79; (P) 110.56; (R1) 111.59; More...
Intraday bias in USD/JPY remains on the upside for the moment. Fall from 114.49 should have completed at 107.31 already. Further rally would be seen for medium term channel resistance (now at 112.91). Sustained break there will argue that whole correction from 118.65 has completed too. In that case, further rise should be seen to 114.49 resistance for confirmation. On the downside, below 109.54 minor support will turn bias back to the downside for 107.31 instead.
In the bigger picture, rise from 98.97 (2016 low) is seen as the second leg of the corrective pattern from 125.85 (2015 high). It's unclear whether this this second leg has completed at 118.65 or not. But medium term outlook will be mildly bearish as long as 114.49 resistance holds. And, there is prospect of breaking 98.97 ahead. Meanwhile, break of 114.49 will bring retest of 125.85 high. But even in that case, we don't expect a break there on first attempt.
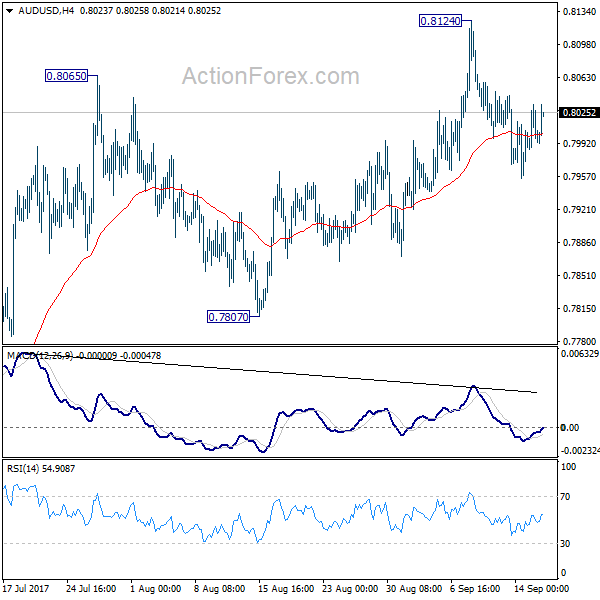
AUD/USD Daily Outlook
Daily Pivots: (S1) 0.7979; (P) 0.8007; (R1) 0.8028; More...
Intraday bias in AUD/USD remains neutral as correction from 0.8124 is still in progress. Deeper fall could be seen. But still, with 0.7807 support intact, near term outlook stays bearish and another rise is expected. Break of 0.8124 will turn bias to the upside and target 100% projection of 0.6826 to 0.7833 from 0.7328 at 0.8335 next. However, considering bearish divergence condition in 4 hour MACD, firm break of 0.7807 will indicate near term reversal and turn bias back to the downside for 0.7328 key support.
In the bigger picture, rise from 0.6826 medium term bottom is still in progress. At this point, there is no confirmation of trend reversal yet and we'll continue to treat such rebound as a corrective pattern. But in any case, break of 55 month EMA (now at 0.8090) will target 38.2% retracement of 1.1079 to 0.6826 at 0.8451. Break of 0.7807 support is needed to to be the first sign of completion of the rebound. Otherwise, further rise is now in favor.
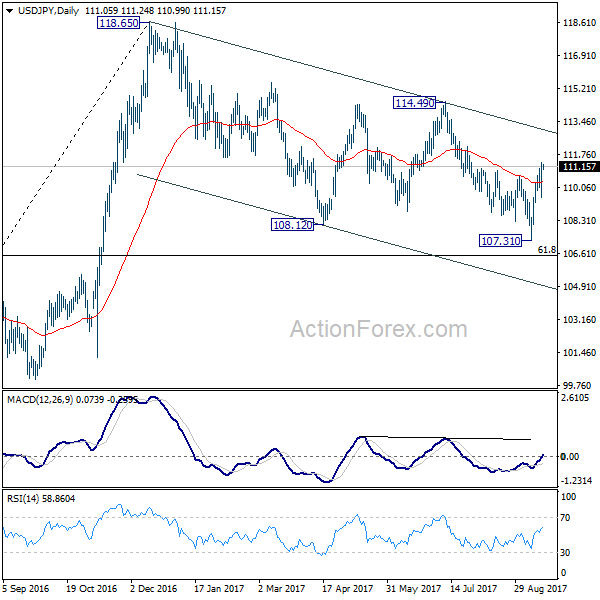
Weekly Technical Outlook And Review: EUR/USD, GBP/USD, AUD/USD, USD/JPY, USD/CAD, USD/CHF, DOW 30, GOLD
A note on lower timeframe confirming price action...
Waiting for lower timeframe confirmation is our main tool to confirm strength within higher timeframe zones, and has really been the key to our trading success. It takes a little time to understand the subtle nuances, however, as each trade is never the same, but once you master the rhythm so to speak, you will be saved from countless unnecessary losing trades. The following is a list of what we look for:
- A break/retest of supply or demand dependent on which way you're trading.
- A trendline break/retest.
- Buying/selling tails ... essentially we look for a cluster of very obvious spikes off of lower timeframe support and resistance levels within the higher timeframe zone.
- Candlestick patterns. We tend to only stick with pin bars and engulfing bars as these have proven to be the most effective.
We typically search for lower-timeframe confirmation between the M15 and H1 timeframes, since most of our higher-timeframe areas begin with the H4. Stops are usually placed 1-3 pips beyond confirming structures.
EUR/USD
Weekly gain/loss: – 94 pips
Weekly closing price: 1.1940
Over the past three weeks, upward momentum has somewhat diminished thanks to the weekly resistance pegged at 1.2044. Despite this, weekly bulls managed to chalk up a mild end-of-week correction last week from weekly support seen below at 1.1871, possibly encouraging buyers into the market. In addition to this, we can see that weekly price over on the USDX formed a nice-looking bearish pin bar off resistance at 11854, and shows room to move down to at least weekly support at 11687 (converges with a long-term weekly trendline support etched from the low 9322).
Since the 29th August, the daily candles have been consolidating between the noted weekly resistance level and a demand coming in at 1.1739-1.1823. Looking at the USDX daily timeframe, however, there's a possibility that we may see further selling from resistance at 11868, as the next area of interest does not come into view until the 11681-11749 neighborhood (fuses with a channel support taken from the low 12352). As such, this could pressure the EUR up to the weekly barrier sometime this week.
A quick look at recent dealings on the H4 timeframe show US retail sales figures contracted on Friday, immediately forcing the pair higher. As you can probably see though (check the M30 chart), price quickly stalled following the move and began paring gains. Trade concluded with the piece closing below the H4 mid-level support logged at 1.1950.
Suggestions: For ease, let's just recap what we have here:
Weekly price seen within moderate range – weekly USDX shows possible selling on the cards, which could force EUR higher.
Daily, at current price, is positioned mid-range with price likely heading higher to retest weekly resistance, thanks largely to USDX daily action pointing to the possibility of further selling.
H4 closed sub 1.1950. Next downside target located at September's opening level drawn from 1.1913, followed closely by the 1.19 handle.
So, with the above in mind, our team has absolutely no interest in shorting sub 1.1950.
Although both weekly and daily price suggest buys, nevertheless, traders may want to note the large psychological number 0.80 lurking above. Not only is this a watched number, but it is also bolstered by a strong-looking H4 supply just above it at 1.2029-1.2007 and a nearby H4 61.8% Fib resistance at 1.1994 taken from the high 1.2092. For that reason, we have to be prepared for a possible bounce lower from here. Why we only expect a bounce should be obvious: the higher timeframes!
To trade any bounce seen from 0.80, we would highly recommend drilling down to the lower timeframes to secure a tighter entry (see the top of this report for information on how to do this). This will likely help with risk/reward should price reverse before reaching 1.1950.
Data points to consider: EUR Final CPI figures y/y at 10 am GMT+1.
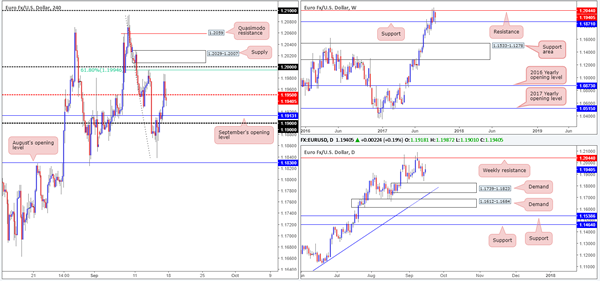
Levels to watch/live orders:
- Buys: Flat (stop loss: N/A).
- Sells: 0.80 region ([waiting for a lower-timeframe entry signal to form is advised] stop loss: dependent on where one confirms this area).
GBP/USD:
Weekly gain/loss: + 395 pips
Weekly closing price: 1.3583
Cable printed another impressive weekly candle last week, consequently breaking through the weekly Quasimodo resistance level at 1.3371 and landing the unit within touching distance of a major resistance coming in at 1.3683 (seen as far back as 2001). With USDX weekly action printing a bearish pin bar last week from resistance at 11854, there's a strong possibility GBP resistance will come into play this week. Looking down to the daily timeframe, there's not really much to add except that the USDX daily candles show further selling could be seen down to demand at 11681-11749 (fuses with a channel support taken from the low 12352).
Reviewing Friday's movement on the H4 timeframe reveals that the pound surged higher on Friday, after BoE policy maker Gertjan Vlieghe, a usual dove, signaled a shift in the BoE's bias towards an interest-rate hike. The pair, after trading nearly 200 pips on the day, eventually found some refuge at the 1.36 handle going into the closing bell.
Suggestions: Though there are three beautiful-looking H4 selling wicks in view from 1.36, this would be a challenging sell. Aside from strong sentiment, price may want to push up to the aforesaid weekly resistance before any serious sellers begin making a play. As a result, the desk will be watching for 1.36 to give way. Should this occur and price retests the number as support, followed by a full, or near-full-bodied bull candle, we would look to long this market up to the 1.3680 neighborhood.
Data points to consider: No high-impacting events on the docket today.
Levels to watch/live orders:
- Buys: Watch for H4 price to engulf 1.36 and then look to trade any retest seen thereafter ([waiting for a H4 confirming bull candle to form following the retest is advised] stop loss: ideally beyond the candle's tail).
- Sells: Flat (stop loss: N/A).
AUD/USD:
Weekly gain/loss: – 55 pips
Weekly closing price: 0.7999
On the whole, the commodity currency remains entrenched within a relatively strong uptrend at the moment. However, weekly price does show bearish intent being seen from resistance penciled in at 0.8075, but whether it'll be sufficient enough to half further buying is difficult to judge. Above the current resistance is another resistance level at 0.8224, seen converging with two trendline resistances (0.9757/0.7722).
Turning our attention to the daily candles, the pair is currently seen meandering between the noted weekly resistance and a support level drawn from 0.7955. A violation of this daily level would likely pressure the major back down to demand coming in at 0.7786-0.7838 (seen positioned within the walls of a weekly support area at 0.7849-0.7752 – the next downside target on the weekly scale).
During the course of Friday's sessions H4 price reclaimed the large psychological level 0.80, following a somewhat decisive move lower from supply marked at 0.8044-0.8028. Aside from this being a widely watched number and converging with August's opening level at 0.7998, this is not a level we expect price to reverse from. The team actually favors the 0.7950 neighborhood for longs due to the following points:
Daily support lodged at 0.7955.
Just below 0.7950 there is a strong-looking H4 demand base at 0.7921-0.7946.
Nearby September's opening level at 0.7939.
61.8%78.6% H4 Fib supports at 0.7928/0.7925.
H4 trendline support etched from the low 0.7807.
Suggestions: Given that the H4 demand is located only a few pips below daily support, this would be an ideal area to buy, in our humble view. Not only would a move down to this area likely trigger stops from below daily support and the H4 mid-level support, it would also be a trade in line with the underlying trend and therefore could print a substantial move higher. Of course, the only grumble here is the current weekly resistance, but given the confluence bolstering a long, we feel a buy is worth the risk.
Data points to consider: No high-impacting events on the docket today.
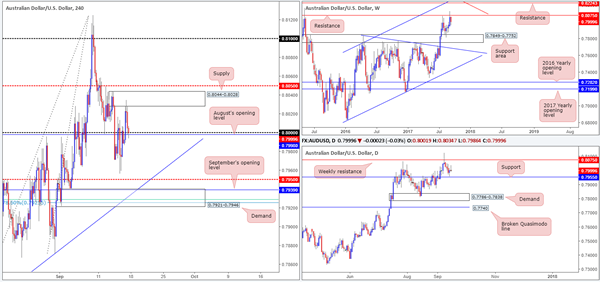
Levels to watch/live orders:
- Buys: 0.7939 ([pending order] stop loss: 0.7918).
- Sells: Flat (stop loss: N/A).
USD/JPY:
Weekly gain/loss: + 300 pips
Weekly closing price: 110.83
After clipping the top edge of a weekly support area at 105.19-107.54, USD/JPY bulls staged an aggressive recovery last week, completely engulfing the prior week's losses. Although the USDX formed a bearish pin bar from weekly resistance at 11854 last week, the path north on the USD/JPY appears reasonably free up to as far as the weekly supply area punched in at 115.50-113.85.
Daily resistance at 110.76, as you can see, suffered a rather brutal blow on Friday as price struck highs of 111.32. While a marginal close was printed above this line, it is very difficult to judge whether this is enough to spark further buying on this scale up to resistance planted at 111.91/61.8% daily Fib resistance at 111.77.
A quick recap of Friday's movement on the H4 timeframe shows price failed to sustain gains beyond the 111 handle, largely influenced by lower-than-expected US Retail sales. Although the move generated seller interest, there wasn't much follow-through action seen. This was, as far as we can see, due to the US consumer sentiment index measured by Reuters/Michigan coming in a 95.3 against an expected reading of 95.1.
Suggestions: The H4 selling wicks chalked in around 111 have likely stirred candlestick traders – but we would advise treading carefully here! Both weekly and daily price suggest that further upside may be on the horizon. Therefore, we have absolutely no plans to sell this market anytime soon. In fact, similar to the GBP analysis above, we will be watching for the H4 candles to run above 111 and hold firm as support. Should this occur and price prints a full, or near-full-bodied bull candle following the retest, we would look to long this market up to the 111.80ish area (see daily resistances noted above).
Data points to consider: Japanese banks will be closed in observance of Respect-for-the-Aged Day. No US events on the docket today.
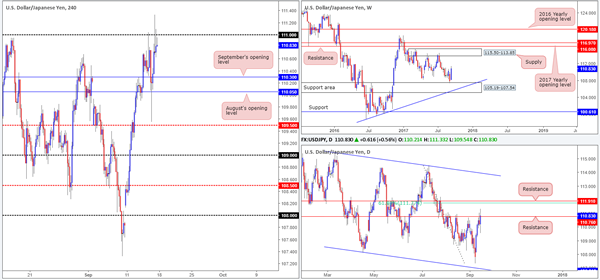
Levels to watch/live orders:
- Buys: Watch for H4 price to engulf 111 and then look to trade any retest seen thereafter ([waiting for a H4 confirming bull candle to form following the retest is advised] stop loss: ideally beyond the candle's tail).
- Sells: Flat (stop loss: N/A).
USD/CAD:
Weekly gain/loss: + 40 pips
Weekly closing price: 1.2196
The USD/CAD closed marginally stronger last week after crossing paths with weekly demand fixed at 1.1919-1.2074. Why we have not seen a more explosive move transpire from here, at least from a technical standpoint, likely comes down to three things:
The strong downtrend that has been in play since the beginning of May. Notice price only managed to correct once over five months, and this only lasted two weeks!
There is also the fact that daily price is seen capped below a broken Quasimodo line at 1.2201. What's more, a break above here will only free price up to nearby resistance area at 1.2303-1.2423.
Weakness seen from USDX weekly resistance at 11854 – notice last week's selling wick and room to move lower.
Moving across to the H4 timeframe, we can see that the pair dipped to a fresh session low of 1.2119 on Friday following a disappointing US retail sales print. Price did, however, manage to recover relatively quickly, posturing itself back above the mid-level support 1.2150 and rallying to the 1.22 handle into the close. The other key thing to note here is the clear range that has been forming since the 13th September between 1.2215-1.2144 (yellow area).
Suggestions: On the account of weekly and daily structure, this is a somewhat difficult market to trade at this time. Yes, the overall trend is facing south, but we don't want to become a seller when a weekly demand is in play!
Even with a decisive close above the current H4 consolidation, buyers then have to contend with potential offers from the H4 mid-level resistance 1.2250. It will only be once this line is cleared will the path north be clear up to the 1.23 neighborhood, which also happens to intersect with the underside of the aforementioned daily resistance area. So, intraday longs could be a possibility above 1.2250 up to 1.23. With that being said, nevertheless, do consider the risk/reward element here. Try to pin down a setup that'll allow for at least two times your risk. If not, it might be worth passing.
Data points to consider: No high-impacting events on the docket today.
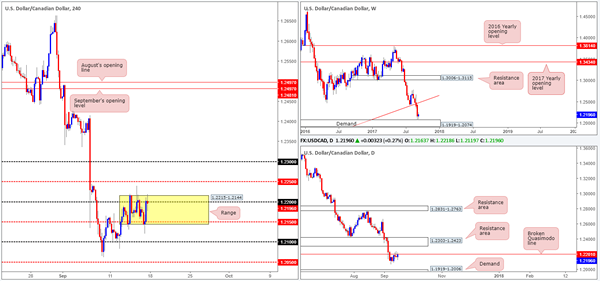
Levels to watch/live orders:
- Buys: Watch for H4 price to engulf 1.2250 and then look to trade any retest seen thereafter (stop loss: ideally beyond the rejection candle's tail).
- Sells: Flat (stop loss: N/A).
USD/CHF:
Weekly gain/loss: + 152 pips
Weekly closing price: 0.9590
The weekly support area at 0.9443-0.9515, as you can see, remains in play. Irrespective of last week's end-of-week correction, if the bulls push higher this week this could see the unit challenge a weekly trendline resistance extended from the low 0.9257. One other thing to keep in mind here though is weekly USDX price sold off from resistance at 11854 last week and printed a strong-looking selling wick.
Turning our attention to the daily timeframe, Thursday's movement chalked up a nice-looking bearish selling wick around supply penciled in at 0.9699-0.9641, which encouraged further selling on Friday and placed price within striking distance of support at 0.9546. Also of particular interest is the daily USDX showing space to trade down to demand at 11681-11749 (fuses with a channel support taken from the low 12352).
Looking at Friday's action on the H4 timeframe, price settled for the week just beneath the 0.96 handle, following a modest bid from demand pegged at 0.9546-0.9568 (sits on top of the daily support mentioned above at 0.9546). A sell from current price would be challenging not only because of the aforesaid demand, but also July's opening level at 0.9580. A long above 0.96 on the other hand may be something to consider, but the move may only be good for 30 pips up to nearby supply at 0.9647-0.9633.
Suggestions: Personally, we do not see much to hang our hat on here at the moment, and as such, remaining on the sidelines may be the better route to take today.
Data points to consider: No high-impacting events on the docket today.
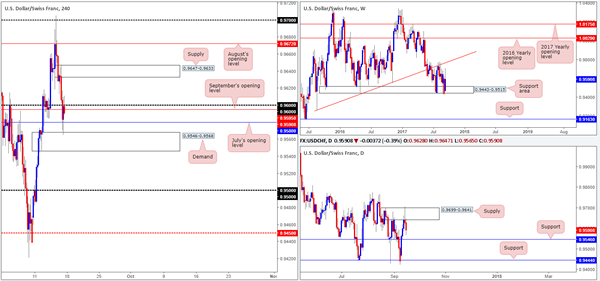
Levels to watch/live orders:
- Buys: Flat (stop loss: N/A).
- Sells: Flat (stop loss: N/A).
DOW 30:
Weekly gain/loss: + 448 points
Weekly closing price: 22256
After price struck weekly demand at 21462-21645 five weeks ago, US equities eventually printed a fresh record high of 22256 last week. With absolutely no overhead resistance on the horizon, further buying could be seen this week. On the whole, traders have largely shrugged off latest North Korean tensions and the terrorist attack in London.
Down on the daily timeframe, nonetheless, we may see the index correct should price join with the 161.8% Fib ext. point at 22274 extended from the low 21645. On this scale, the next downside support target can be seen at 22076-21979.
In the event that price reverses from record highs today, the H4 demand zone at 22187-22221 will be the first port of call to keep an eye on. A violation of this area, however, likely opens the door for a test of the broken Quasimodo line at 22138, which happens to sit just above the noted daily support area.
Suggestions: As far as we're concerned, this is a buyers' market right now .Therefore, we'll be watching both the above said H4 supports for possible buying opportunities today. To be on the safe side though, waiting for a H4 bull candle to form, preferably in the shape of a full, or near-full-bodied candle, before pulling the trigger may be best, since it is difficult to know which of the two areas will hold, if any at all.
Data points to consider: No high-impacting events on the docket today.
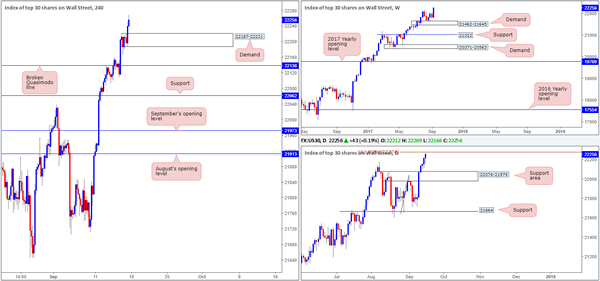
Levels to watch/live orders:
- Buys: 22187-22221 ([waiting for a reasonably sized H4 bullish candle to form – preferably a full, or near-full-bodied candle – is advised] stop loss: ideally beyond the candle's tail). 22138 ([waiting for a reasonably sized H4 bullish candle to form – preferably a full, or near-full-bodied candle – is advised] stop loss: ideally beyond the candle's tail).
- Sells: Flat (stop loss: N/A).
GOLD:
Weekly gain/loss: – $26.3
Weekly closing price: 1319.7
Following a rather decisive close above weekly resistance at 1337.3, which connected with a channel resistance extended from a high of 1295.4, the bulls generated little to no follow through last week. In fact, price erased all of the prior week's losses and now looks poised to challenge nearby support coming in at 1295.4.
On the other side of the field, daily action closed the week out forming a near-full-bodied bearish candle, and has firmly positioned price just ahead of support coming in at 1308.4 (unites with a trendline support extended from the low 1205.0).
Across on the H4 timeframe, the unit ended the week marginally closing beyond September's opening level at 1320.4. To our way of seeing things, the majority of buyers here are already likely consumed given the large consumption tail seen marked with a black arrow at 1315.4, thus the door down to the noted daily support is wide open, followed closely by a H4 Quasimodo support logged in at 1304.9.
Suggestions: Put simply, a short trade could be possible on any retest seen at September's opening level today, targeting the daily support. Our only concern is that weekly USDX price shows price selling off from resistance at 11854 in the shape of selling wick. Therefore, it may be worth waiting for a H4 bearish candle to form following a retest of 1320.4, before committing to a trade.
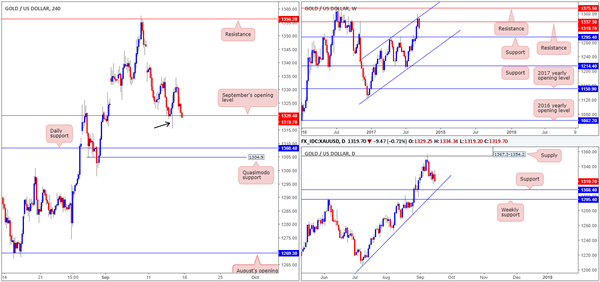
Levels to watch/live orders:
- Buys: Flat (stop loss: N/A).
- Sells: 1320.4 region ([waiting for a reasonably sized H4 bearish candle to form – preferably a full, or near-full-bodied candle – is advised] stop loss: ideally beyond the candle's wick).
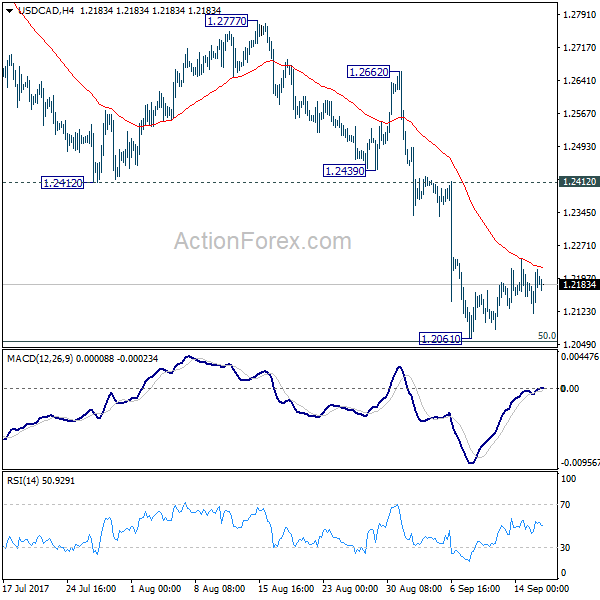
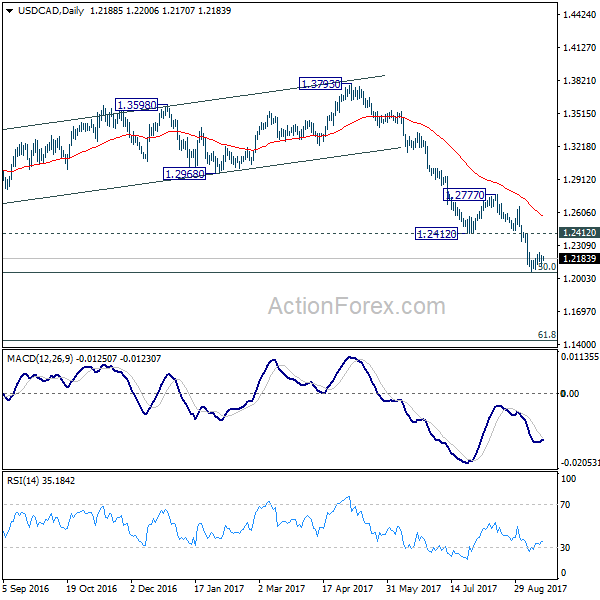
USD/CAD Daily Outlook
Daily Pivots: (S1) 1.2133; (P) 1.2175; (R1) 1.2234; More....
Intraday bias in USD/CAD remains neutral as consolidation from 1.2061 temporary low continues. The corrective price actions so far suggests that larger decline is not completed yet. And firm break of 1.2049 key fibonacci level will pave the way to next fibonacci level at 1.1424. Still, we'd remain cautious on strong support from 1.2048 to bring sustainable rebound. But still, break of 1.2439 support turned resistance is needed to be the first sign of trend reversal. Otherwise, outlook will remain bearish.
In the bigger picture, current downside acceleration is raising the chance that whole long term rise from 0.9406 (2011 low), and that from 0.9056 (2007 low) is completed at 1.4689. Focus is now on 50% retracement of 0.9406 to 1.4869 at 1.2048. As long as this level holds, we'd still favor that case that fall from 1.4689 is a correction. However, firm break of 1.2048 will indicate that fall fro 1.4689 is at least a medium term down trend and should target 61.8% retracement at 1.1424 and below.