Sample Category Title
AUD/USD Downside Pressures
AUD/USD is consolidating lower after the pair surged towards 0.8125 (08/09/2017 high). Hourly support below 0.7950 (former uptrend channel). Expected to further weaken.
In the long-term, the trend is largely negative since 2011. Key supports stands at 0.6009 (31/10/2008 low) . A break of the key resistance at 0.8295 (15/01/2015 high) is needed to invalidate our long-term bearish view.
USD/CAD Short-Term Increase
USD/CAD is consolidating. Hourly support is located at 1.2062 (08/09/2017 low). Resistance is now given at a distance at 1.2239 (intraday high). Expected to show continued short-term bullish pressures.
In the longer term, the pair has broken longterm support that can be found at 1.2461 (16/03/2015 low). Strong resistance is given at 1.4690 (22/01/2016 high). The pair is likely to head further lower. Short-term increase.
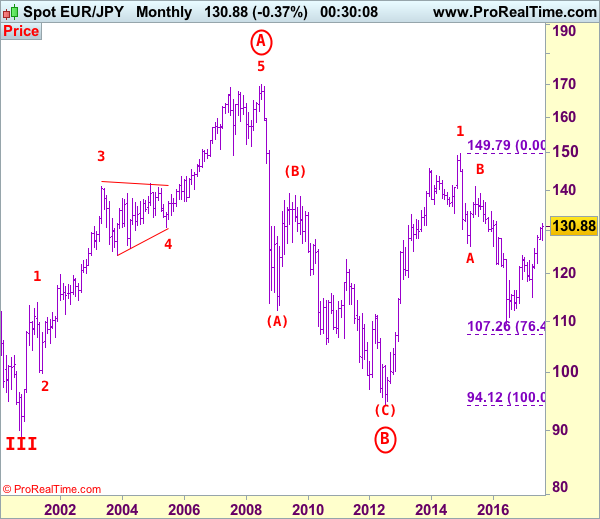
EUR/JPY Elliott Wave Analysis
EUR/JPY - 132.91
The single currency opened higher this week and has resumed recent upmove as euro broke above indicated resistance at 131.71, suggesting the major rise from 109.49 low (2016 low) is still in progress and may extend further gain to 133.50-60 and 134.00-10 but overbought condition should prevent sharp move beyond previous chart resistance at 134.59 and reckon 135.00 would hold on first testing, price should falter below 136.00-10, bring retreat later.
The daily chart is labeled as attached, early selloff from 169.97 (July 2008) to 112.08 is wave (A) of B instead of end of entire wave B and then the rebound from there to 139.26 is wave (B), hence, wave (C) has possibly ended at 94.12 with a diagonal triangle as labeled in the daily chart, hence upside bias is seen for further gain. Recent rally above indicated retracement level at 116.69 (50% Fibonacci retracement of the intermediate fall from 139.26-94.12) adds credence to this view and signal major reversal has commenced but first leg of this wave C has possibly ended at 149.79, hence wave 2 has commenced with wave A ended at 126.09, followed by wave B at 141.06, wave C commenced and could have ended at 109.49, indicated upside targets at 126.00 and 130.00 had been met and further gain to 135.00 would follow.
On the downside, whilst initial pullback to 132.00-05 is likely, reckon downside would be limited to 131.65-70 and bring another upmove later. Below 131.00 would defer and risk test of support at 130.62 but only break of latter level would suggest top is formed instead, risk weakness to 130.00, however, strong support at 129.37 should remain intact, bring another upmove later this month.
Recommendation: Buy at 132.00 for 134.00 with stop below 131.00.
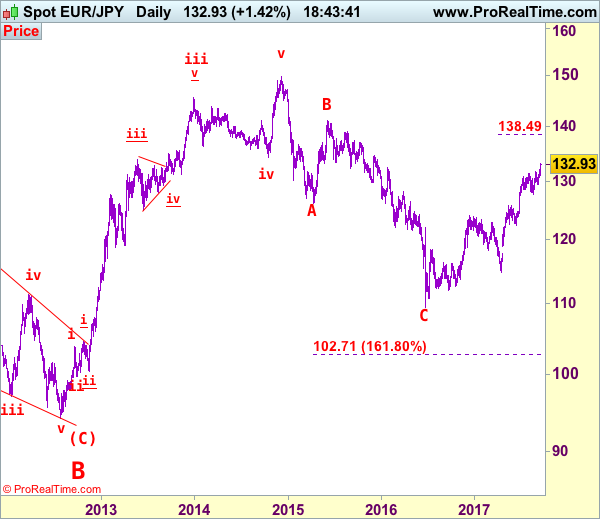
To re-cap the corrective upmove from the record low of 88.93 (18 Oct 2000), the wave A from there is subdivided as: 1:88.93-113.72, 2:99.88 (1 Jun 2001), 3:140.91 (30 May 2003), 4:124.17 (10 Nov 2003) and 5 ended at record high of 169.97 (21 Jul 2008). The brief but sharp selloff to 112.08 is viewed as a-b-c x a-b-c wave (A) of B. The subsequent rebound to 139.26 is (B) of B and (C) of (B) has possibly ended at 94.12 and in any case price should stay well above previous chart support at 88.93, bring rally in larger degree wave C towards 150.00.
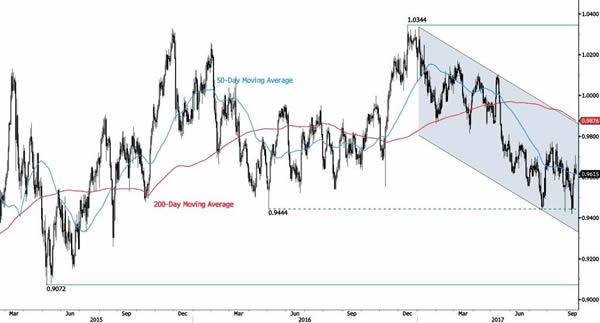
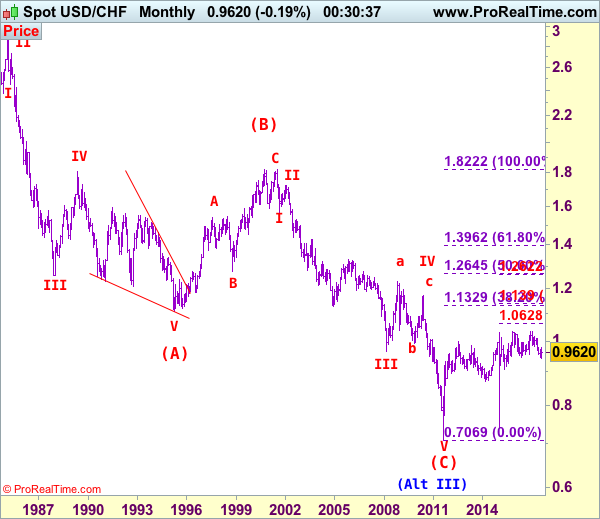
USD/CHF Sideways Price Action
USD/CHF keeps on bouncing. Strong resistance is given at 0.9771 (15/06/2017 high). The technical structure shows that the the pair is likely to head further lower below 0.9421 (03/05/2017). Expected to show renewed bearish pressures.
In the long-term, the pair is still trading in range since 2011 despite some turmoil when the SNB unpegged the CHF. Key support can be found 0.8986 (30/01/2015 low). The technical structure favours nonetheless a long term bullish bias since the unpeg in January 2015.
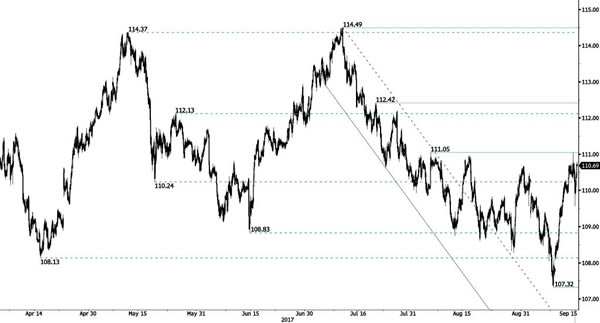
USD/JPY Monitoring Resistance Area
USD/JPY is now monitoring resistance area around 111. Strong support is located at 107.32 (08/09/2017 high). Expected to show further downside pressures if the pair fails to break resistance at 111.05 (04/08/2017 high).
We favor a long-term bearish bias. Support is now given at 99.02 (10/08/2013 low). A gradual rise towards the major resistance at 125.86 (05/06/2015 high) seems unlikely. Expected to decline further support at 93.79 (13/06/2013 low).
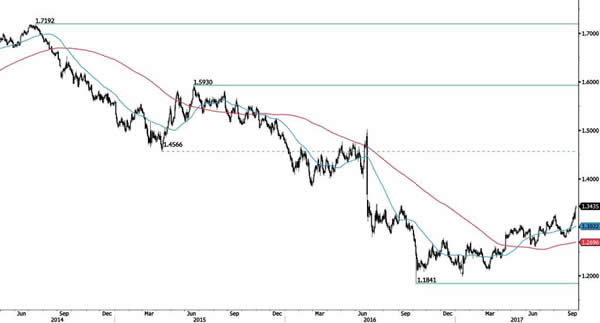
GBP/USD Surging
GBP/USD is consolidating lower. The pair has broken hourly resistance at 1.3329 (13/09/2017 high). Strong support is given at 1.2774 (24/08/2017 low). Expected to show continued bullish pressures.
The long-term technical pattern is reversing. The Brexit vote had paved the way for further decline. Long-term support can be found at 1.1841 (07/10/2017 low). Long-term resistance given around 1.35 is at stake and indicates a long-term reversal in the negative trend. Yet, it is very unlikely at the moment.
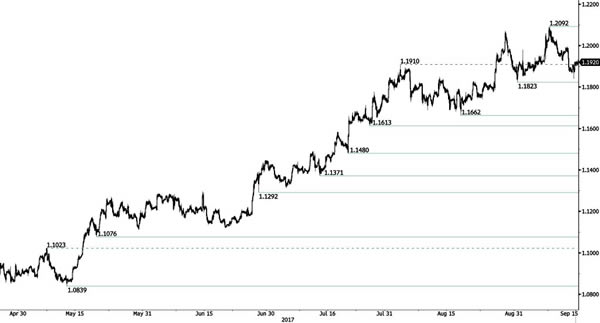
EUR/USD Consolidation
EUR/USD lies in a bullish trend despite ongoing consolidation. Hourly resistance can be found at 1.2092 (08/09/2017 high) while hourly support lies at 1.1823 (31/08/2017 low). Stronger support is given at a distance at 1.1662 (17/08/2017 low). Expected to show renewed bullish pressures.
In the longer term, the momentum is now turning largely positive. We favour a continued bullish bias. Key resistance is holding at 1.2252 (25/12/2014 high) while strong support lies at 1.0341 (03/01/2017 low).
USD/CHF Elliott Wave Analysis
USD/CHF – 0.9606
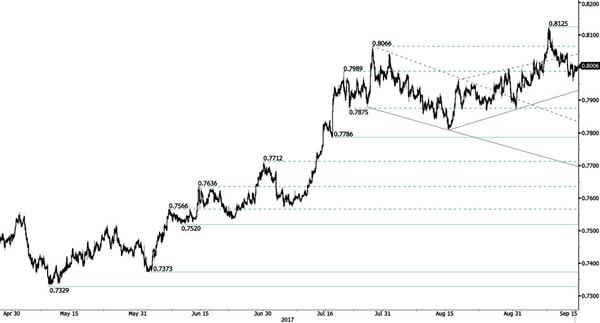
Although the greenback fell briefly below previous support at 0.9438, lack of follow through selling and the subsequent strong rebound from 0.9421 suggest a temporary low is possibly formed there and consolidation with mid upside bias is seen for gain towards resistance at 0.9773, however, a daily close above this level is needed to add credence to this view, bring retracement of recent decline to resistance at 0.9808, then test of previous support at 0.9859, having said that, near term overbought condition should limit upside to 0.9900 and price should falter well below psychological resistance at 1.0000, bring another decline later.
Our preferred count on the daily chart is that early selloff to 0.9630 is an end of the larger degree wave III and major correction is unfolding from there with a leg ended at 1.2298 (Nov 2008 with (a): 1.0625, (b):1.0011 and (c):1.2298), wave b ended at 0.9910 with (a): 1.0370, (b): 1.1967, (c): 0.9910. The rise from there to 1.1730 is the wave c which also marked the end of wave IV and wave V has possibly ended at 0.7068.
On the downside, whilst initial pullback to 0.9580 is likely, reckon downside would be limited to 0.9550 and bring another rise later. Below 0.9545-50 would risk weakness to 0.9500 but still reckon downside would be limited to 0.9455-60 and said support at 0.9421 should remain intact, bring another rebound later. A drop below said support at 0.9421 would extend recent decline from 1.0344 top (formed back in late 2016) to 0.9350 and possibly 0.9300, however, loss of downward momentum should prevent sharp fall below 0.9250-60 and 0.9200-10 should hold.
Recommendation: Buy at 0.9550 for 0.9750 with stop below 0.9450.
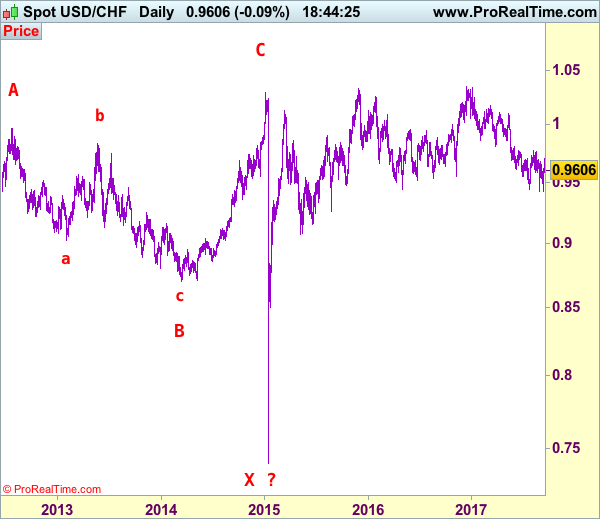
Dollar's long-term downtrend started from 2.9343 (Feb 1995) and it was unfolding as a (A)-(B)-(C) with (A): 1.1100, (B): 1.8310 (26 Oct 2000), then followed by another impulsive wave (C) with wave III ended at 0.9630 (Mar 2008). Under this count, correction in wave IV has possibly ended at 1.1730 and wave V already broke below support at 0.9630 and met indicated downside target at 0.7500 and 0.7400. The reversal from 0.7068 suggests the wave V has possibly ended and the breach of resistance at 0.9595 add credence to this view and indicated upside target at 1.0000 had been met, however, the sharp retreat from 1.0296 to 0.7401 suggests choppy trading would be seen but price should stay above said record low at 0.7068.
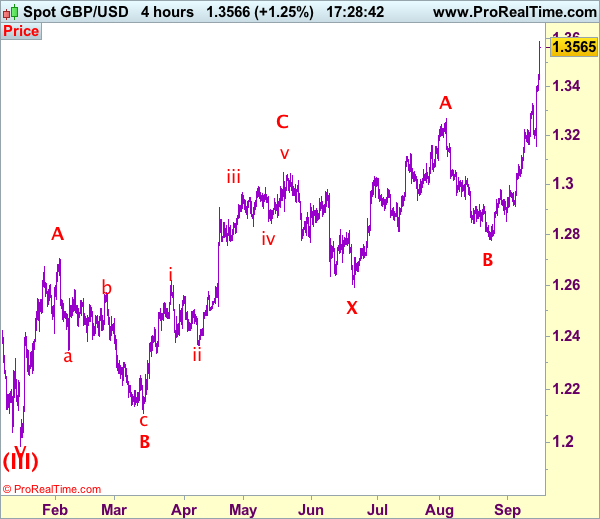
Trade Idea: GBP/USD – Buy at 1.3490
GBP/USD – 1.3572
Original strategy :
Buy at 1.3140, Target:1.3340, Stop: 1.3080
Position: -
Target: -
Stop: -
New strategy :
Buy at 1.3490, Target:1.3690, Stop: 1.3430
Position: -
Target: -
Stop:-
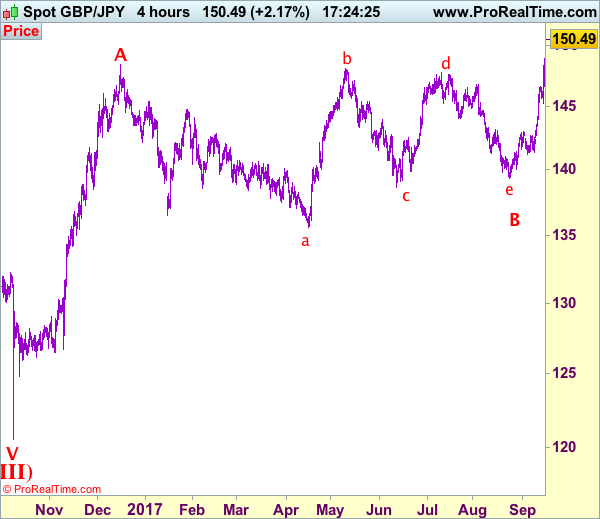
Cable only retreated to 1.3153 (missed our long entry at 1.3140) before rallying again since late NY yesterday, we have re-labeled our preferred count (pls see the attached chart) that the wave IV is unfolding as a complex double three (ABC-X-ABC) correction with 2nd wave B ended at 1.2774, hence 2nd wave C is unfolding and may extend further gain to 1.3600, then 1.3700, however, near term overbought condition should limit upside to 1.3770-75 and reckon 1.3800-10 would hold from here, bring retreat later.
In view of this, would not chase this rise here and would be prudent to buy sterling on subsequent pullback as 1.3490-00 should limit downside. Below 1.3425-30 would defer and suggest a temporary top is possibly formed, risk correction to 1.3385-90 but previous resistance at 1.3329 should remain intact, bring another upmove later.
Our preferred count on the daily chart is that cable's rebound from 1.3500 (wave (A) trough) is unfolding as a wave (B) with A ended at 1.7043, followed by triangle wave B and wave C as well as wave (B) has ended at 1.7192, the subsequent selloff is the larger degree wave (C) which is still unfolding with minor wave (III) of larger degree wave 3 ended at 1.1986, hence wave (IV) correction is in progress which could either be a triangle wave (IV) of a complex formation but upside should be limited to 1.3500 and price should falter well below 1.4000, bring another decline in wave (V) of 3 for weakness to 1.1500, then 1.1200.
Trade Idea: GBP/JPY – Buy at 149.95
GBP/JPY - 150.95
Original strategy:
Buy at 144.75, Target: 146.75, Stop: 144.15
Position: -
Target: -
Stop: -
New strategy :
Buy at 149.95, Target: 151.95, Stop: 149.35
Position: -
Target: -
Stop:-
Sterling only eased to 145.25 yesterday before staging the anticipated rally, the British pound found renewed buying interest today at 146.65 and has surged again, upmove accelerated after breaking above resistance at 148.35, adding credence to our latest preferred count that triangle wave B correction has ended at 139.35 (the final e leg of triangle), hence wave C has commenced and may extend further gain to 152.00 and 153.00, however, near term overbought condition should limit upside to 154.00-10 and price should falter below 155.00 today.
In view of this, we are still looking to buy sterling on pullback but at a higher level as 150.00 should limit downside. below 149.50 would risk correction to 149.00 but still reckon downside would be limited to previous resistance at 148.35 and 147.75-80 should hold, bring another upmove later.
Our preferred count is that larger degree wave V with circle is unfolding from 251.12 with wave (I) 219.34, (II): 241.38 and wave (III) is subdivided into 1: 192.60, 2: 215.89 (23 Jul 2008) and wave 3 ended at 118.87 earlier in 2009. The correction from there to 162.60 is wave 4 which itself is a double three and is labeled as first a-b-c ended at 151.53, followed by wave x at 139.03, 2nd a ended at 162.60, 2nd b at 146.75 and 2nd c leg of wave 4 ended at 163.00. Therefore, the decline from 163.00 to 116.85 is now treated as wave 5 which also marked the end of larger degree wave (III), hence wave (IV) major correction has commenced for retracement of the wave (III) from 241.38 and upside target at 183.95-00 (50% Fibonacci retracement of the wave (II) from 241.38) had been met, a drop below 160.00 would suggest wave (IV) has ended at 195.85, bring decline in wave (V) for initial weakness to 130 (already met) and 120.