Sample Category Title
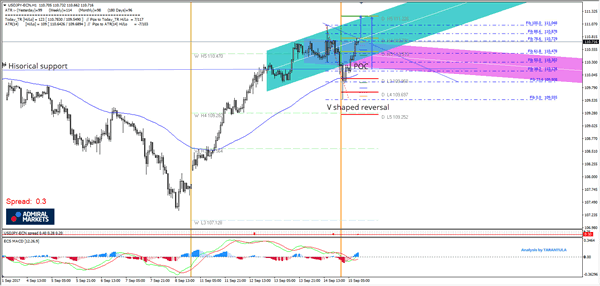
Daily Technical Analysis: USD/JPY Possible Breakout Above 110.78
Equities have been holding strong this week and USD/JPY has seen a recovery from its lows making a diving board pattern/V shaped reversal. At this point it stands at the important levels 110.70 and if we see a momentum break of 110.78 it could proceed towards 111.22-30 zone. In the case of profit taking (It's Friday) pay attention to 110.10-20 zone (historical gap support, 38.2, channel bottom, EMA89) as the POC could again spike the price towards 110.78 and above.
W L3 - Weekly Camarilla Pivot (Weekly Interim Support)
W H3 - Weekly Camarilla Pivot (Weekly Interim Resistance)
W H4 - Weekly Camarilla Pivot (Strong Weekly Resistance)
D H4 - Daily Camarilla Pivot (Very Strong Daily Resistance)
D L3 – Daily Camarilla Pivot (Daily Support)
D L4 – Daily H4 Camarilla (Very Strong Daily Support)
POC - Point Of Confluence (The zone where we expect price to react aka entry zone)
USD Rally Stalls Ahead Of FOMC Meeting, CBR Expected To Cut Rates
USD recovery was short-lived ahead of next week FOMC meeting
The US dollar got a fresh boost yesterday after the release of better-than-expected inflation report. The headline CPI gained 1.9%y/y, against median forecast of 1.8%, up from 1.7% in July. The core gauge also beat expectations of 1.6% by rising 1.7%y/y. This upside surprise may have renewed expectations of an upcoming tightening move from the Fed. However, many clouds remain on the horizon.
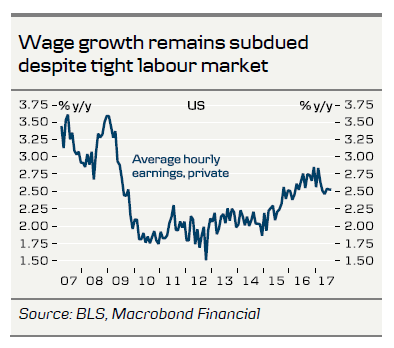
First of all, real average weekly earnings grew only 0.9%y/y, down from 1.1% in the previous month, suggesting that the significant recovery of real wage growth that started at the beginning of the year may have come to an end, which is definitely not of good omen for the Fed normalization cycle.
Second, hurricanes Harvey and Irma have substantially blurred the Fed’s vision by distorting the economic data. Unfortunately, it will take months for the dust to settle down, which could prompt the Fed to act with caution. New York fed President Dudley mentioned this point as he argued that the hurricanes could affect temporarily the timing of the next rate hike.
The dollar recovery was short-lived as the greenback reversed gains against most of its peers. The single currency rose 0.13% to $1.1940. Commodity currencies were also better bid with the AUD, NZD and CAD rising 0.25%, 0.66% and 0.16%, respectively. We believe investors will remain cautious ahead of next Wednesday FOMC meeting as there is a growing sentiment that the Fed will play for time, once again.
Russia: Markets strongly expect a rate cut
The Central Bank of Russia will decide about its key rate today. There is a significant likelihood that the central bank lower its key rate to 8.5%. In July, the CBR decided to remain on hold, markets expectations for a rate cut are now strong.
There are a major reason for that, it has been a while that Russian inflation is on its way lower. Consumer prices have increased 1.7% year-to-date. Annualized figure is 3.3% below the central bank expectations. The central bank has now some room to act to normalize its monetary policy.
Currency-wise, the ruble is trading at the highest levels for the last two years against the dollar at 52 ruble for one single dollar note. It is important to remember that before 2013, the USDRUB was trading around 30. We consider that the CBR is willing to strengthen the currency by lowering its key rate. Today’s event should not appear as a non-event but as a remainder of benefiting from the likely strengthening of the Russian currency over the medium-term.
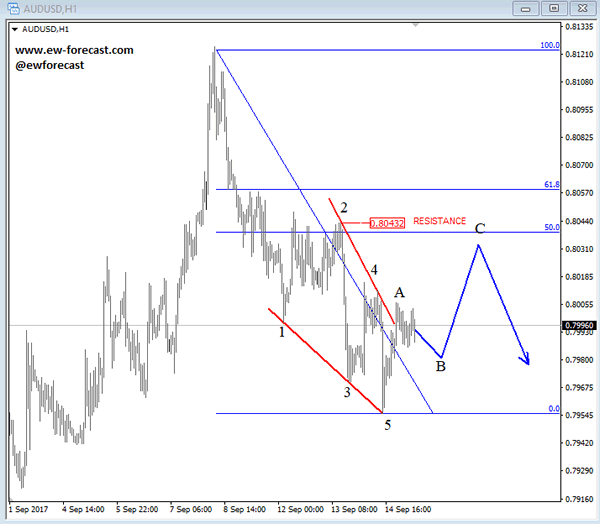
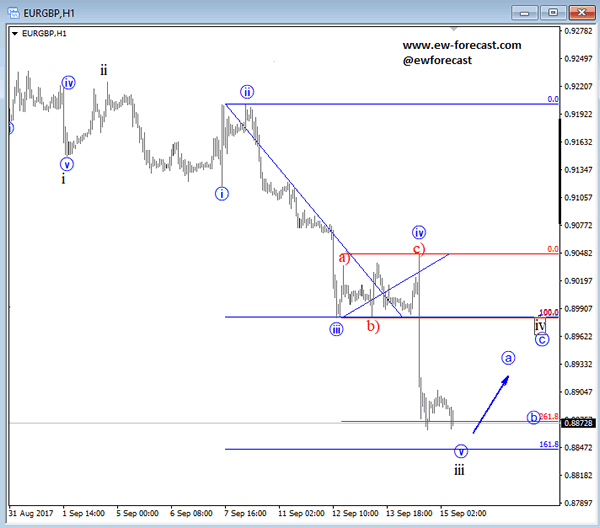
Elliott Wave Analysis: AUDUSD And EURGBP Looking For More Weakness
Aussie has been in bearish trend this week, but because of overlapping price action we suspect that breakdown may not occur just yet. But it's still a five wave decline as a leading diagonal, so be aware of a three wave rise before downtrend may resume; ideally next week from 0.8040 zone.
AUDUSD, 1H
EURGBP is at the lows after a new sharp wave down yesterday from 0.9090 which we see it as a fifth wave within extended black wave iii. We also see pair trading at some Fibonacci levels where downside can be limited for a short period of time, as we think that wave iv bounce may follow soon.
EURGBP, 1H
BoE Remains On Hold, Tilts Hawkish
The BoE kept its policy unchanged yesterday via a 7-2 vote, as was widely anticipated. In line with our view, the Bank tilted hawkish, signaling that some withdrawal of stimulus is likely over the coming months in order for inflation to return sustainably to target. In addition, officials reiterated that policy may need to be tightened faster than the market currently expects if the economy grows as expected. Sterling surged in the aftermath of the decision, as the implied probability for a rate hike by year-end rose to 68%.
Moving forward, we believe that the most important upcoming data points to watch may be wages and inflation, as they could determine whether a hike will actually materialize in the next months. Of course, business investment is critical as well, but we will not be getting updated prints for Q3 until late November. As for sterling, we think that its outlook remains positive in the near-term, as the market continues to focus on the prospect of a rate hike by the BoE soon. Looking further ahead, however, we think that the continued delays and the uncertainty surrounding the Brexit negotiations could begin to weigh once again on the currency in a few months, especially if the BoE under-delivers with any future rate hikes.
GBP/USD surged yesterday following the BoE's hawkish signals. The rate rebounded from near the 1.3160 support and rallied to break above the 1.3360 (S1) hurdle. The price structure on the 4-hour chart continues to suggest a short-term uptrend and thus, we believe that the break above 1.3360 (S1) may have opened the way for our next obstacle of 1.3450 (R1). Having said that though, given that the rally appears overextended, we would stay careful of a corrective setback before the bulls take charge again.
As for the bigger picture, the rate continues to trade above the medium-term upside support line taken from back at the low of the 7th of October. Actually, the latest recovery started after the rate rebounded from that line. This is another point enhancing our view that the rate could continue trading north for a while, perhaps until it tests the long-term downside resistance line, drawn from the peaks of July 2014.
North Korea strikes again, but JPY can't hold onto gains
Overnight, North Korea launched yet another missile that flew over Japan to land in the Pacific Ocean. The yen strengthened on the news, but quickly gave back its gains to trade relatively unchanged in the following minutes. We see three potential reasons for this rapid pullback.
Firstly, this strike probably came as a surprise to nobody given North Korea's provocative warnings in recent days. As early as yesterday, the regime threatened to sink Japan and turn the US to “ashes and darkness”. What's more, there may be a diminishing impact to any market reaction given how frequently this has occurred in recent weeks. Finally, the inability of the JPY to hold onto gains may be partly due to USD dip-demand, amid encouraging signals about tax reform. Overnight, US Secretary Treasury Mnuchin said that tax plan details will be released in the week September 25-29. We see the prospect for the dollar to continue recovering overall in the next days, potentially fueled by optimistic remarks on this subject.
USD/JPY tumbled overnight following North Korea's missile launch. However, the bulls were quick to take advantage of the dip and drive the battle higher. The rate recovered all the missile-related losses and during the European morning Friday, it looks to be headed towards the 111.00 (R1) key resistance.
The pair continues to trade within the sideways range that's been in place since the 28th of July, between that key resistance and the support zone of 108.70 (S1). As such, we still believe that the short-term outlook is flat for now. We would like to see a decisive break above 111.00 (R1) before we get confident on larger bullish extensions.
Today's highlights:
In the US, the headline retail sales rate for August is expected to have declined, while the core one is anticipated to have held steady. This combination could weigh on the dollar somewhat, but given the recent theme of tax reform, any dip in USD could remain relatively short-lived. We also get the nation's NY Fed manufacturing and U of M consumer sentiment indices, both for September, as well as industrial production for August.
There's only one major speaker on the schedule: BoE MPC member Gertjan Vlieghe.
GBP/USD
Support: 1.3360 (S1), 1.3320 (S2), 1.3225 (S3)
Resistance: 1.3450 (R1), 1.3500 (R2), 1.3550 (R3)
USD/JPY
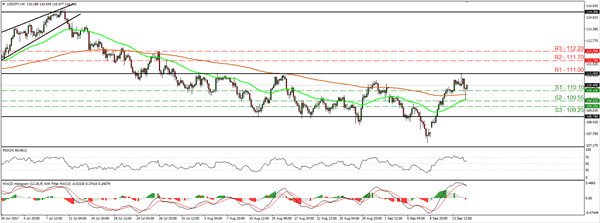
Support: 110.10 (S1), 109.55 (S2), 109.25 (S3)
Resistance: 111.00 (R1), 111.70 (R2), 112.20 (R3)
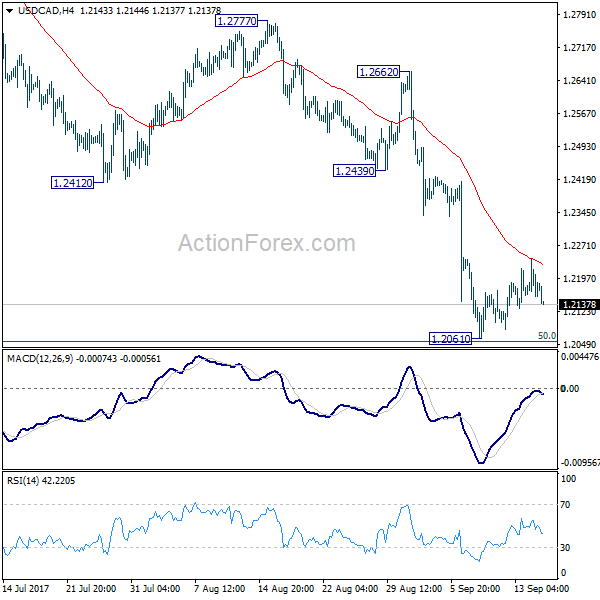
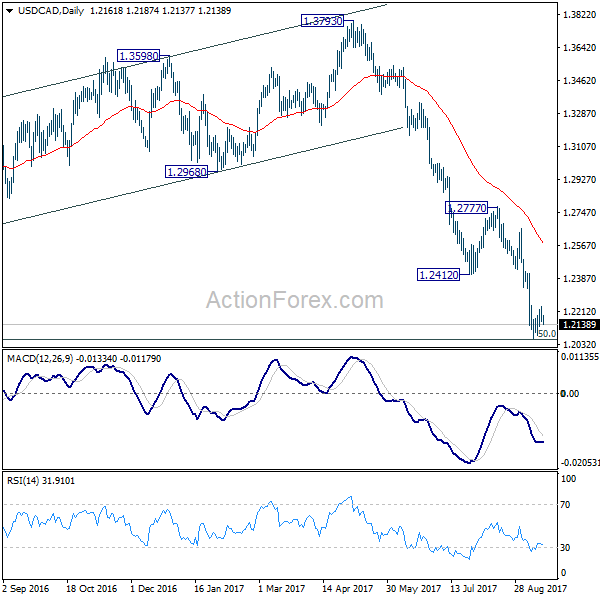
USD/CAD Daily Outlook
Daily Pivots: (S1) 1.2132; (P) 1.2186; (R1) 1.2215; More....
USD/CAD fails to take out 4 hour 55 EMA and weakens. But intraday bias stays neutral first. We'll stay cautious on strong support from 1.2048 long term fibonacci level to bring sustainable rebound. But still, break of 1.2412 support turned resistance is needed to be the first sign of trend reversal. Otherwise, outlook will remain bearish. Firm break of 1.2048 will pave the way to next fibonacci level at 1.1424.
In the bigger picture, current downside acceleration is raising the chance that whole long term rise from 0.9406 (2011 low), and that from 0.9056 (2007 low) is completed at 1.4689. Focus is now on 50% retracement of 0.9406 to 1.4869 at 1.2048. As long as this level holds, we'd still favor that case that fall from 1.4689 is a correction. However, firm break of 1.2048 will indicate that fall fro 1.4689 is at least a medium term down trend and should target 61.8% retracement at 1.1424 and below.
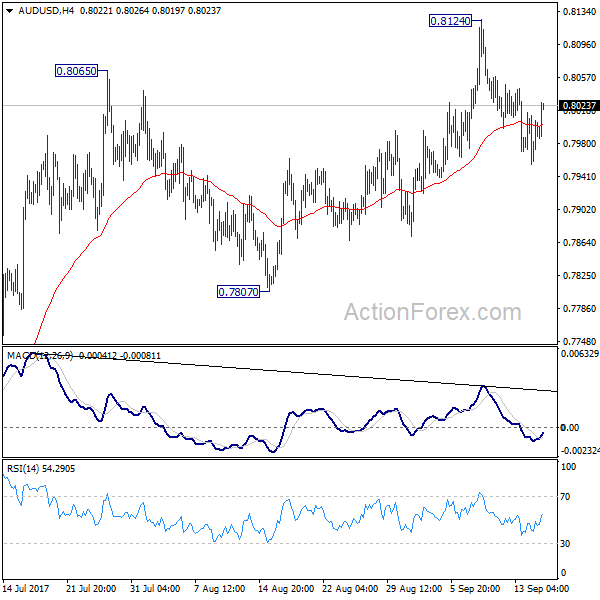
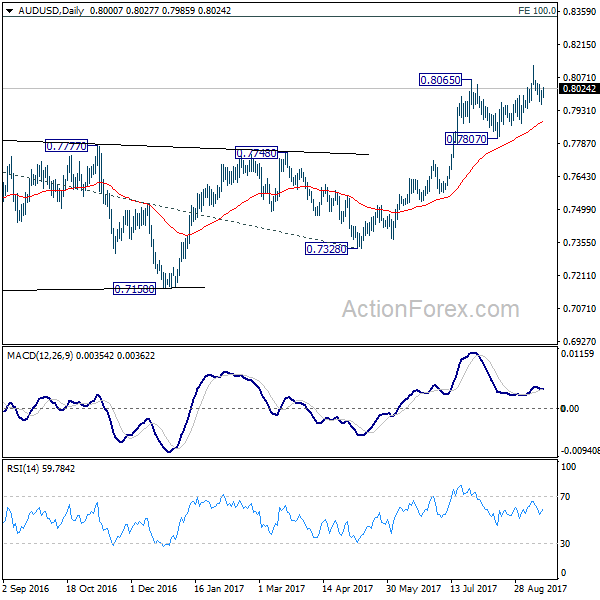
AUD/USD Daily Outlook
Daily Pivots: (S1) 0.7968; (P) 0.7992; (R1) 0.8028; More...
No change in AUD/USD's outlook as it's staying in consolidation below 0.8124. Intraday bias remains neutral at this point. And with 0.7807 support intact, outlook stays bullish for another rally. Above 0.8124 will target 100% projection of 0.6826 to 0.7833 from 0.7328 at 0.8335 next. However, considering bearish divergence condition in 4 hour MACD, firm break of 0.7807 will indicate near term reversal and turn bias back to the downside for 0.7328 key support.
In the bigger picture, rise from 0.6826 medium term bottom is still in progress. At this point, there is no confirmation of trend reversal yet and we'll continue to treat such rebound as a corrective pattern. But in any case, break of 55 month EMA (now at 0.8090) will target 38.2% retracement of 1.1079 to 0.6826 at 0.8451. Break of 0.7807 support is needed to to be the first sign of completion of the rebound. Otherwise, further rise is now in favor.
FOMC Preview: Fed To Announce QT And Still Signal One More Hike This Year
- No hike but Fed will announce it will begin shrinking its balance sheet in October. This is widely expected and should not have a major impact on Treasury yields.
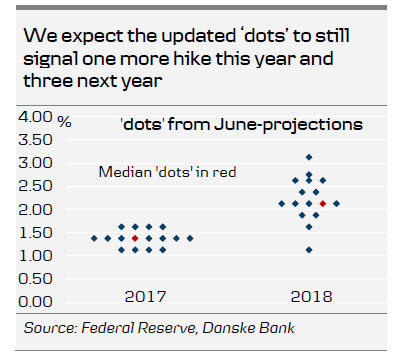
- We expect the median 'dots' to still signal one more hike this year and three hikes next year. The longer-run median 'dot' may be revised down from 3% currently.
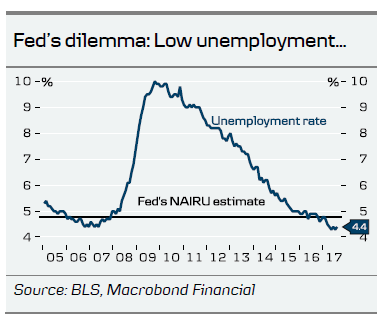
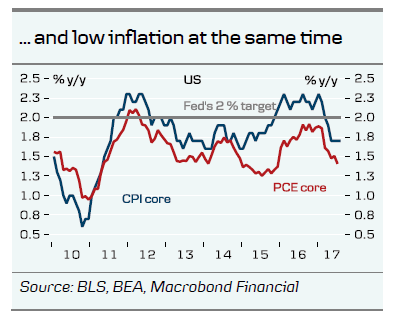
- We do not expect major changes to the statement, as it already says the Fed monitors inflation 'closely'. We are looking forward to hearing Janet Yellen's view on the dilemma with low inflation and unemployment at the same time.
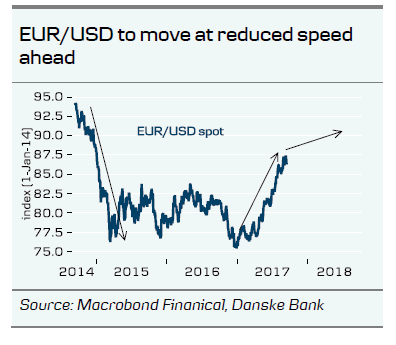
- Any dips in EUR/USD will be shallow and short-lived but we emphasise that the speed with which EUR/ISD is set to move higher will be reduced going forward.
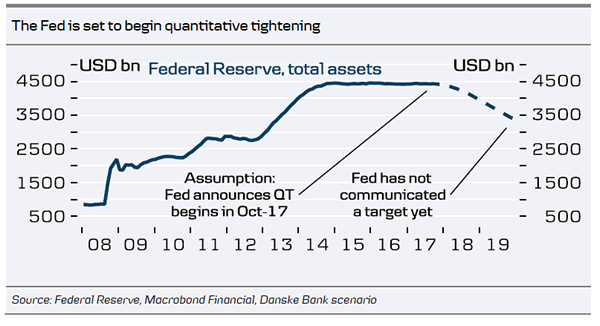
No Fed hike but announcement on balance sheet reduction
Next week's meeting is one of the so-called big meetings, which means that we get updated projections and there will be a press conference after the policy announcement. We do not expect the Fed to increase the target range but instead expect it to announce that 'quantitative tightening' is set to begin in October. This is widely expected and should not by itself lead to significant market reaction, as the Fed has outlined most details already. The Fed is expected to decrease reinvestments by gradually increasing caps on the amount of bonds that will be allowed to run off each month and only reinvest the amounts that exceed the caps each month. For Treasuries, the cap will begin at USD6bn per month and increase by USD6bn at three-month intervals until it reaches USD30bn per month. For mortgage-backed securities, the cap will be set at USD4bn per month initially and increase USD4bn at three-month intervals until it reaches USD20bn per month. We do not expect quantitative tightening to have a major impact on Treasury yields like the taper tantrum in 2013. The Fed will still have a significant reinvestment need in 2018, but there is a risk that quantitative tightening could lead to an unwarranted tightening of financial conditions. The reason is that we still do not know what level the Fed targets for the balance sheet, which, in our view, is not a trivial question due to increasing regulation, something the Fed has also touched upon previously.
Fed likely to still signal a third hike
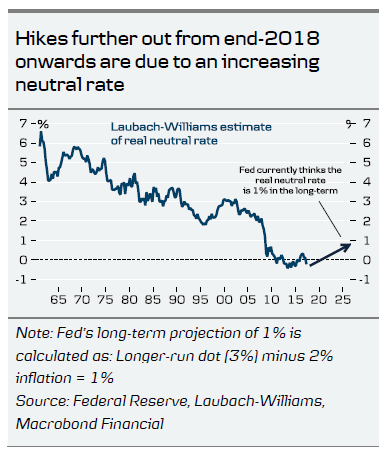
Besides the announcement on quantitative tightening, focus is on changes to the so-called 'dot'plot and the FOMC statement, mainly because of the Fed's dilemma with low inflation and low unemployment at the same time. While the dovish and hawkish camps have drifted further apart, we expect the median 'dot' to still signal a third hike this year, as we do not think four Fed members will lower their forecast (which is the necessary number in order to lower the median 'dot'). In June, there were already four members (probably Bullard, Brainard, Evans and Kashkari, in our view) indicating no further hike this year but based on recent speeches it seems like only Kaplan may have joined them, although not all Fed members have expressed their opinions lately. In our view, Dudley's support for further tightening was key, as he is one of the core members of the FOMC (number three after Yellen and Fischer). Dudley argued that financial conditions are very easy and that above-trend growth should put upward pressure on inflation due to the tighter labour market. For the same reason, we think the median 'dot' will continue signalling three hikes next year. That said, it is important to stress that while all FOMC participants are submitting their projections, only nine of them have voting rights, meaning that the 'dots' are likely to be biased in a hawkish direction, as many of the most hawkish Fed members are non-voters. Also, note that we for the first time will get 'dots' for 2020.
With respect to the longer-run dot, it is interesting to take note of the theoretical debate within the Fed about the level of the so-called neutral rate (simply put, it is the rate which should prevail when the output gap is closed and growth is on trend), which the longer-run dot should reflect. In his most recent speech, Kaplan mentioned he believes the long-term neutral rate is closer to 2.25% than 3.0% (the current median longer-run median dot). This statement could be an indication that the longer run 'dots' may be revised down. This is very interesting, as it says something about how high the Fed thinks the interest rates should go eventually (unless the Fed at some point feels the need to increase the Fed funds rate above the neutral rate) and hence at what levels US yields should trade. Estimates of the current level of the neutral rate are lower than the 3% and Fed Chair Yellen has also said that the 3% is based on the expectation of an increasing neutral rate due to higher productivity growth. As Yellen thinks monetary policy is currently close to neutral (meaning that the current Fed funds rate is close to the current neutral rate), hikes further out from end-2018 onwards are due to an increasing neutral rate. If the neutral rate does not increase, it means that the hiking cycle may end sooner than most analysts expect. It seems like markets buy into that story given the very soft pricing of the Fed, partly reflecting that investors do not expect a pickup in the neutral rate in coming years.
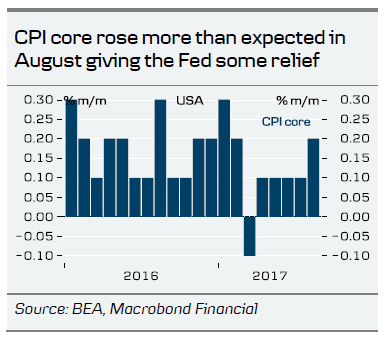
No major changes to inflation wordings despite low inflation
In the FOMC statement, we will look for any new wordings on inflation, as low inflation remains the biggest obstacle for hiking further since growth remains above trend and employment continues to rise. In July, the statement was changed from saying inflation 'is running SOMEWHAT below' 2% (our own emphasis) to just 'running below', which was interpreted as a smidgen dovish. Since then PCE core inflation has moved lower but the CPI data for August were more promising, as CPI core rose +0.2% m/m (and close to 0.3%), the biggest increase since February. Statements do not change much from meeting to meeting and we do not expect major changes at this meeting either, although risk is skewed towards a more dovish stance. We think the statement will continue to say that the Fed is monitoring inflation 'closely'. More interesting is Yellen's press conference as in June she expressed confidence in the Phillips curve. However, if inflation continues to disappoint while labour market continues to tighten, it may be harder for her to justify this conviction. We do not expect big changes to the statement with respect to growth and the labour market.
We expect the Fed to hike in December
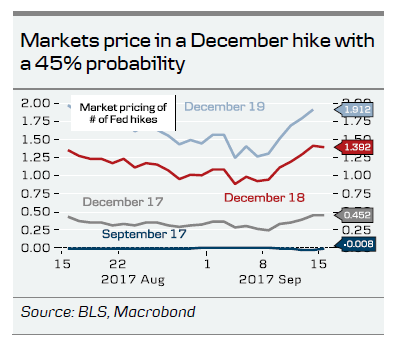
Our base scenario is that the Fed will hike in December, mainly because the Fed puts more weight on labour market data relative to inflation. However, as we already mentioned after the June hike (see FOMC Review: Hawkish Yellen ignores inflation and weaker data, 15 June), a December hike is a close call and we estimate the hike probability to be 55% currently, as inflation remains low despite the stronger-than-expected CPI data for August. That is why since the June meeting, we have argued that risk is skewed towards the Fed pausing its hiking cycle due to low inflation, which may not be just 'transitory' given the low inflation expectations. In our view, the problem is that the tightness of the labour market is not the only factor determining wage growth, as second-round effects after many years with low inflation have hit wage growth. When employees expect inflation to remain low, they can live with low wage growth, as real wage growth may still be solid, making it less likely inflation will reach the target (see also Strategy: Central banks consider leaving the party, 30 June). In this regard, it is interesting that four FOMC members indicated that they do not expect the Fed to hike more this year in the June projections. Markets price in a December hike with a 45% probability. Less than 1.5 hikes are priced in by the end of next year.
Uncertainty about Fed policy next year
On at different note, it has become more difficult to say what the Fed will do next year. With Stanley Fischer stepping down on or around 13 October, there will be four vacant seats (Randal Quarles has been nominated but not approved yet) and possibly five if Yellen is not reappointed Fed Chair, which is not our base case. This means Trump has the power to shape the Federal Reserve in the way he wants (although the Senate has to approve his nominations). Although Trump does not seem very interested in monetary policy, the Republican Party certainly is, as many Republicans are dissatisfied with the Fed's low rate policy. Many Republicans want a more rule-based Fed, which bases its monetary policy decisions on a policy rule (a simple Taylor rule suggests the Fed funds rate should be around 3% at the moment). In other words, we might see a more hawkish and rule-based Fed next year but the uncertainty is high.
FX: Fed to cap EUR/USD upside near term
With a Fed set to confirm its intentions to hike rates once more this year and in light of a market that is clearly not prepared for this, it would be tempting to conclude that EUR/USD should come lower near term. But not so fast: relative short-end rates have not been a key driver of the FX market in the year so far – rather 'euro optimism' and an associated shift in ECB policy have been essential for the cross. That said, speculative positioning is closing in on stretched levels for EUR/USD longs, suggesting the vulnerability of the FX market to USD-positive news is greater than 'normal' at present. Thus, if US activity continues to surprise on the upside in Q4 – as our quantitative business-cycle model suggests it will – the pricing of a December hike could gain traction, and the FX market is unlikely to be immune to this. Fed balance-sheet reduction should not play a major role for USD crosses spot near term as it is well anticipated and as a rebuild of the Treasury cash buffer (which could add to tighter USD liquidity) has now been postponed, see FX Strategy: The return of USD scarcity - postponed, 7 September 2017. Even if 'pockets' of USD strength could materialise near term, we note that it is currently somewhat difficult for the market to send US yields higher due to the weak inflation prints recently, i.e. a key Fed obstacle. Thus, we reiterate our call that any dips in EUR/USD will be shallow and short-lived, but, at the same time, emphasise that the speed with which EUR/USD is set to move higher will be reduced going forward.
EUR/USD Daily Outlook
Daily Pivots: (S1) 1.1862; (P) 1.1892 (R1) 1.1947; More...
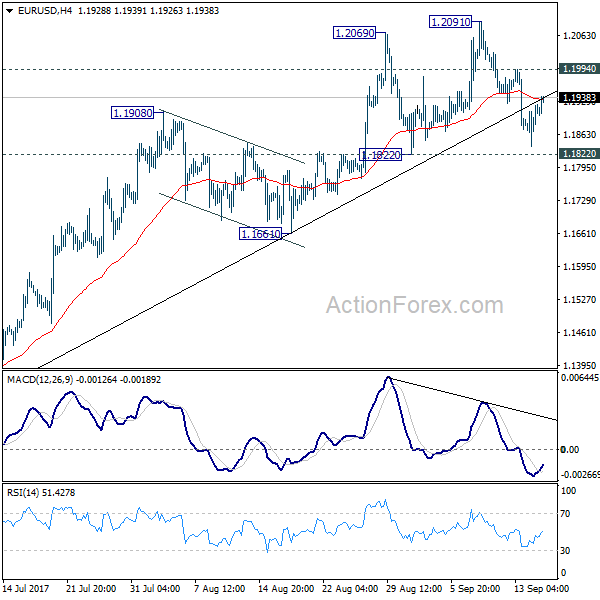
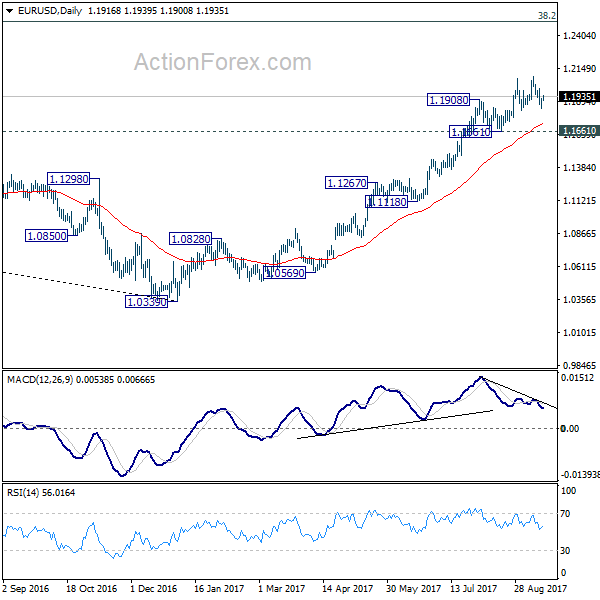
EUR/USD recovers ahead of 1.1822 minor support and intraday bias remains neutral first. Near term outlook remains bullish for another rally. Above 1.1994 minor resistance will turn bias to the upside for 1.2091 resistance first. Break will extend larger rise from 1.0339 and target next key fibonacci level at 1.2516. But considering bearish divergence condition in 4 hour MACD, break of 1.1822 will confirm short term topping and bring deeper fall back to 1.1661 support and below.
In the bigger picture, rise from medium term bottom at 1.0339 is still in progress for 38.2% retracement of 1.6039 (2008 high) to 1.0339 (2017 low) at 1.2516. However, it should be noted that there is no confirmation of trend reversal yet. That is, such rebound from 1.0399 could be a correction. And the long term fall fro 1.6039 (2008 high) could resume. Hence, we'd be cautious on strong resistance from 1.2516 to limit upside. But after all, break of 1.1661 is needed to indicate medium term topping. Otherwise, outlook will remain bullish in case of pull back.
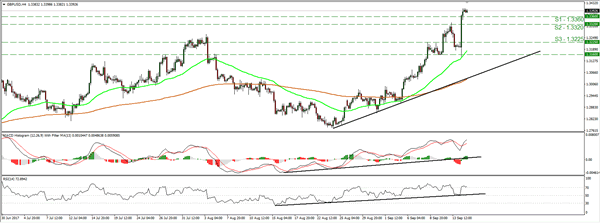
GBP/USD Daily Outlook
Daily Pivots: (S1) 1.3224; (P) 1.3315; (R1) 1.3485; More...
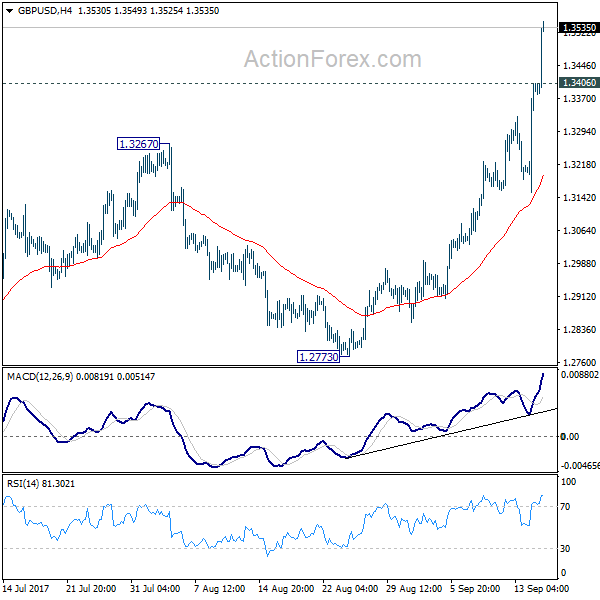
GBP/USD surges to as high as 1.3528 today. The strong break of 1.3444 key resistance carries larger bullish implication. Intraday bias remains on the upside and current rally should target 1.3835 support turned resistance next. On the downside, below 1.3406 minor support will turn intraday bias neutral and bring consolidations, before staging another rally.
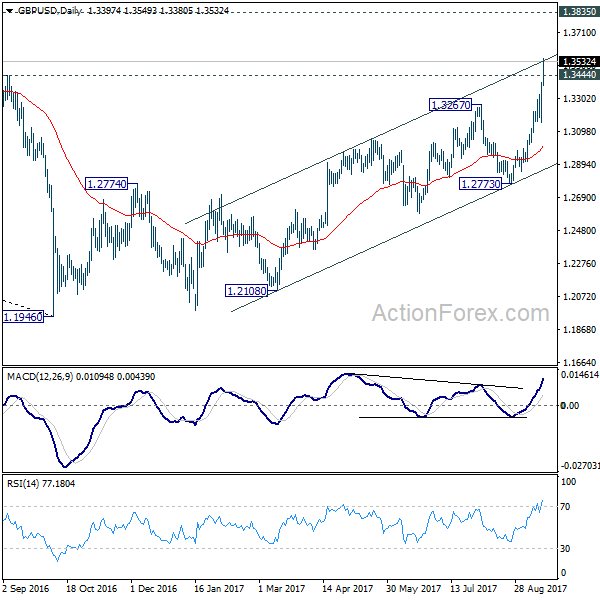
In the bigger picture, the strong break of 1.3444 key resistance now argues that the long term trend in GBP/USD has reversed. That is a key bottom was formed back in 1.1946 on bullish convergence condition in monthly MACD. Current rise from 1.1946 will target 38.2% retracement of 2.1161 to 1.1946 at 1.5466 next. In any case, medium term outlook will now stay bullish as long as 1.2773 support holds.
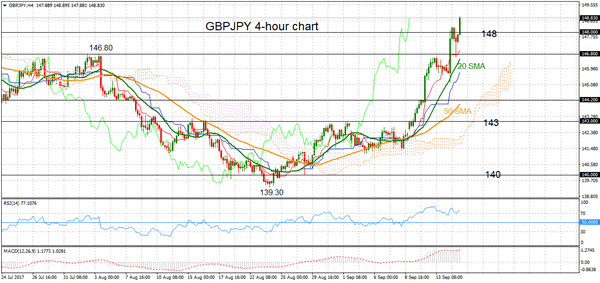
GBPJPY Trending Higher, Risk Of Correction In Short Term As Market Has Become Overbought
GBPJPY is strongly bullish in the short-term after breaking above the key 143.00 level earlier this week. This was a key resistance level which has held since August. The pair reached as high as 148.90 in early European session trading, a level not seen since June 2016.
There is risk that the rally may stall and prices could retreat as there are signs the market has reached overbought conditions since RSI has risen above 70. Meanwhile, MACD has flattened, which also is an indication that upside momentum has fizzled out.
Immediate support is expected at 148.00 as it is seen as a psychological level. A break below this would trigger a move towards the 146.80 – 146.62 area. Failure to rebound from this support zone may add to near-term corrective risks and a push GBPJPY lower towards 144.20 which acted as both support and resistance in the recent past. A move below this would trigger a deeper decline and shift the focus towards the key 140.00 level with scope to see a re-test of the 139.30 low.
The trend higher in GBPJPY remains intact for the short-term and is well-supported by a bullish alignment of trend indicators such as moving averages and Ichimoku cloud analysis. On the 4-hour chart there was a bullish crossover of the 20- and 50-period moving averages, which are both rising. The market is above the cloud while the Tenkan-sen and Kijun-sen lines are positively aligned.