Sample Category Title
GBPUSD Analysis: Surges By 124 Pips Amid BoE Decision
A decision of the BoE not to change the Official Bank Rate was expected to lead to sharp depreciation of the Pound. This assumption was based not only on historical market reaction on similar fundamental event but also technical analysis. Namely, on a daily chart prior to release the currency pair hit the upper edge of a long-term rising wedge and, in essence, had to make a rebound. Contrary to expectations, bulls pushed the pair in the opposite direction. As a result, the Pound has appreciated against the Greenback by 1.40% just in couple of hours, in the process leaving the dominant formation. Now the pair faces only two barriers on its way, i.e. the weekly and monthly R2 at 1.3425 and 1.3485. Thus, a short-term rebound might follow. But, generally, the pair is expected to continue to move to the top.
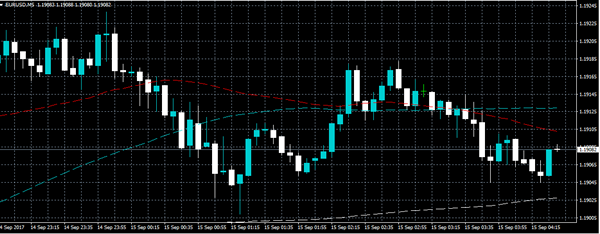
EUR/USD Analysis: Fails To Pass 55-Hour SMA
As it was expected, first half of the previous trading session the currency pair spent near the monthly PP at 1.1881. Unfortunately, a release of better than expected data on the US inflation did not cause any notable volatility in the markets even though initially traders tried to push the pair through the bottom trend-line of a medium-term ascending channel. A fully-fledged rebound did not happen as well, as the surge was quickly neutralized by the 55-hour SMAs. Taking into account that the northern side is secured by the 100- and 200-hour SMAs, while the southern side by the above monthly PP, the pair is expected to continue to more relatively horizontally at least until a release of information on the US Core Retail Sales.
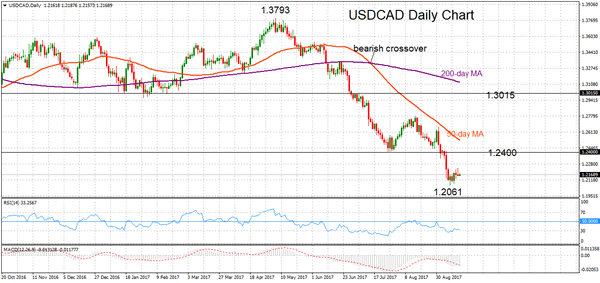
USDCAD Retains Bearish Technical Picture, More Downside Seen After Brief Corrective Move
USDCAD maintains a bearish trend but its downward trajectory has slowed after touching a more than 2-year low of 1.2061 on September 8. The market became overextended as indicated by the RSI oscillator which reached oversold conditions below 30 last week. This suggested that prices were due for a pullback or a consolidation phase in the near term.
The underlying downtrend remains intact as trend indicators are bearish. The 50-day and 200-day moving averages are negatively aligned after a bearish crossover on July 13. MACD – a momentum indicator – is bearish as it is below zero and falling. The odds for another leg lower are high.
Immediate support is expected at 1.2061 (September 8 low). This level was last seen in May 2015 and a break below this would trigger another move down to the next low at 1.1919.
The spike to 1.2238 yesterday was very brief and prices are heading lower again today, possibly indicating that the corrective move has ended. To confirm a lower top is in place USDCAD has to move below 1.2061 to see a resumption of the longer-term downtrend.
Only a move above 1.3000 would shift focus to the upside. For now, there are no signs of a reversal in the bearish trend. The risk is strongly to the downside based on trend and momentum signals. The small correction off 1.2061 suggests USDCAD is likely pausing ahead of another push lower.
Dollar Posts Short-Lived Losses After North Korea’s Missile, Focus On US Retail Sales
North Korea carried a second missile test in less than a month early on Friday, lifting risk-off sentiment and pushing the dollar lower against its safe-haven counterparts. However, the currency managed to reverse its losses immediately, with investors turning their focus on US retail sales after CPI readings came in higher than expected on Thursday.
During early Asian trading hours, officials from South Korea and Japan reported that North Korea fired a ballistic missile that crossed over Japan's northern island of Hokkaido and launched into the Pacific Ocean. This came after a day the regime threatened to “sink” Japan and turn the US into “ashes and darkness” over their supporting stance on additional sanctions imposed by the UN Security Council on Monday. In response to the latest nuclear test, which could easily reach the US Pacific territory of Guam, the Secretary of State Rex Tillerson said that “new measures” should be taken against Pyongyang.
The dollar index ticked down by 0.17%, from a high of 92.10 to a low of 91.92, but it immediately rose to 92.03 as investors were getting used to North Korea's actions with the regime having already fired more than a dozen nuclear weapons this year.
The safe-haven yen and swiss franc posted short-lived gains versus the dollar. Dollar/yen touched a session-low of 109.54 but managed to climb to 110.48 afterwards, while dollar/swissie retreated to 0.9612 before it jumped to 0.9637.
Gold, which is positively correlated with rising geopolitical tensions, moved up by 0.36% to $1,334.16 per ounce but fell immediately to $1,329.67.
Throughout the day, markets will be focused to see whether August US retail sales and industrial production released later today would come lower relative to the previous month, as forecasts suggest, after consumer prices, published on Thursday, showed a surprising upward movement and increased the odds for a third rate hike this year. Note that inflation rose from 1.7% to 1.9% on a yearly basis, in August, while analysts anticipated price growth to touch 1.8%
The pound continued its uptrend breaking above the $1.34 key-level for the first time this year after the BOE meeting minutes published yesterday hinted a potential rate hike in the “coming months”. The MPC members, with the majority voting for rates to remain steady at the moment, supported that if economic conditions evolve in line with the central bank's projections, a tighter monetary policy might be needed to drive inflation, which currently stands at 2.9%, back to the BOE's target of 2%.
The euro posted little gains, edging up to $1.1924. The German Finance Minister Wolfgang Schaeuble supported in a newspaper interview early today that the ECB should approach its exit from ultra-easy monetary policy in caution in order to avoid any potential noise in financial markets.
The aussie was weaker versus the greenback as investors were forming their bets for rate increases in the US, slipping by 0.11% to $0.7996.
The kiwi surged by 0.30% on the day to $0.7242 after manufacturing PMI readings for the month of August increased by 2.5 points to 55.4 following two consecutive months of declines. Moreover, the currency found support on the latest election polls which showed that the leading National Party moved to the front position.
Dollar/loonie was slightly up at $1.2171. Oil prices headed lower during the Asian session, negatively affecting the oil-linked loonie. WTI crude was down by 0.66% at $49.56 per barrel and Brent fell by 0.50% to $55.20.
Can US Dollar Break 100-Day SMA Vs Japanese Yen?
Key Highlights
- The US Dollar after forming support near 107.50 against the Japanese Yen recovered well.
- There was a break above a major bearish trend line with resistance near 110.00 on the daily chart of USD/JPY.
- The US Consumer Price Index in August 2017 increased 0.4%, more than the forecast of +0.3% (MoM).
- The US Retail Sales for August 2017 will be released today, which is forecasted to increase by 0.1% (MoM).
USDJPY Technical Analysis
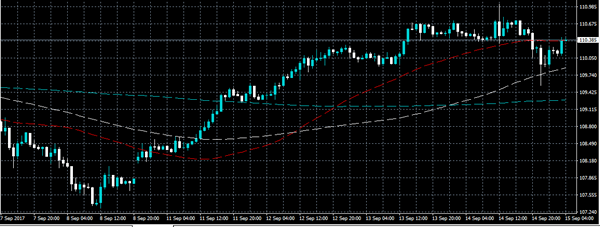
The US Dollar after a bear trend against the Japanese Yen found support at 107.50 and recovered. The USD/JPY pair needs to clear the 100-day simple moving average and 111.00 to gain further traction.
The past few days were decent for USD/JPY, as the pair recovered well from 107.50 and traded above the 109.00 and 110.00 resistance levels. During the upside move, there was also a break above a major bearish trend line with resistance near 110.00 on the daily chart.
However, the pair is currently trading below a crucial resistance at 111.00. The mentioned 111.00 is the 50% Fib retracement level of the last decline from the 114.49 high to 107.32 low. Moreover, the 100-day simple moving average is also at 111.10 to act as a key resistance.
Once there is a proper close above 111.00 and the 100-day SMA, the pair might continue gaining momentum in the near term.
US Consumer Price Index
Recently in the US, the Consumer Price Index for August 2017 was released by the US Bureau of Labor Statistics. The forecast was slated for an increase of 0.3% in the CPI compared with the previous month.
However, the actual result was better than the forecast, as the CPI posted an increase of 0.4%, compared with the last +0.1%. Looking at the yearly change in the CPI, there was a rise of 1.9%, more than the forecast of +1.8% and better than the last +1.7%.
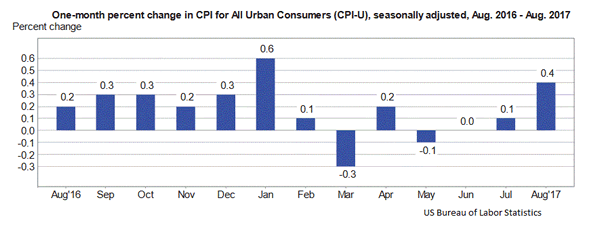
The US CPI Ex Food & Energy also posted a better than the forecast increase of +1.7%, but similar to the last +1.7%.
The report added that:
The energy index rose 2.8 percent in August as the gasoline index increased 6.3 percent. The shelter index rose 0.5 percent in August with the rent index up 0.4 percent. The food index rose slightly in August, with the index for food away from home increasing and the food at home index declining.
Overall, it seems like the recent events in Japan, North Korea and the CPI release in the US might lift the USD/JPY pair above 110.50. However, a convincing break above the 100-day SMA and 111.00 is needed for sustained gains.
USDJPY Steadies After North Korea Missile Launch
The USDJPY pair has stabilized around the 110.30 level, after earlier dropping to 109.54, as North Korea fired another missile over Japan, which landed into the Pacific Ocean, sparking financial markets fears over escalating geopolitical tensions.
Yesterday, the USDJPY pair moved to a six-week trading high, hitting 111.04 during the U.S session, following a stronger than expected increase in August CPI data from the United States economy.
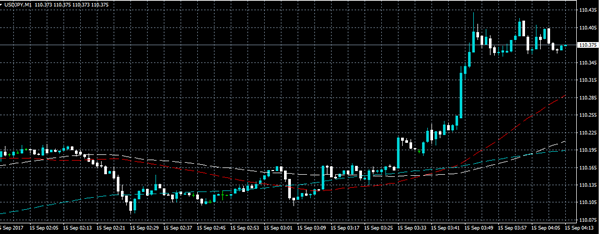
Going forward, a higher time-frame close below the 109.90 level should accelerate USDJPY selling, whilst a higher time-frame close above the 110.68 level should accelerate buying above the 111.04 level.
To the upside, key technical USDJPY resistance is found at 110.68, 110.80 and the 111.04 level. Once above 111.04, key weekly resistance is found at 111.40 and 111.65.
Key intraday technical support is located at the daily pivot point, at 110.18 and the key 50-day moving average, at 109.95.
Below the 109.95 level, further support is found at the daily low, at 109.54, and the 200-hour moving average, at 109.28.
EURUSD Risk Rebound
The EURUSD pair has rebounded above the 1.1900 handle, after yesterday falling to a ten-day trading low, hitting 1.1838, following the release of much better than expected August U.S inflation data.
Risk-off trading sentiment has also returned to financial markets, following North Korea's latest missile launch, which is helping to push the U.S dollar index lower.
Later today, the EURUSD pair should find an intraday directional trading bias, following the release of U.S retail sales and industrial production data.
To the upside, EURUSD resistance is located at 1.1938, 1.1957 and the key 1.1979 level. Above 1.1979, further key resistance is found at the weekly pivot point, at 1.1999 and the key 1.2030 Fibonacci level.
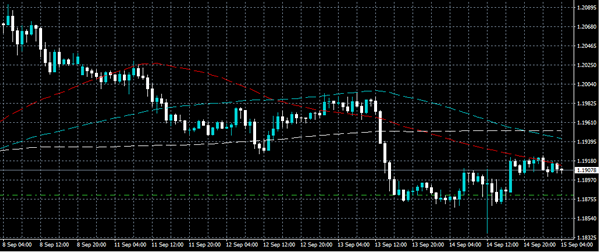
To the downside, key EURUSD intraday support is found at the daily pivot point, at 1.1893, and the monthly time frame 50-period moving average, at 1.1870. Below the 1.1870 level, further losses can be seen towards 1.1851 and 1.1823.
US Data To Close Out An Active Week In The Market
A steady stream of economic data will make its way through the markets on Friday, giving investors key insight into the US and Eurozone economies. The North American session will be especially active, with reports on consumer spending and industrial production set to make headlines.
The data wire begins at 10:00 GMT with a report on Eurozone trade. The Eurozone’s non-adjusted trade surplus is forecast to drop to €21.4 billion in July from €26.6 billion the previous month.
One hour later, the Bank of England (BOE) will issue its Quarterly Bulletin, which provides regular commentary on market developments in the British economy. The BOE left interest rates on hold Thursday, but sent a strong signal that changes are afoot.
Several high-profile releases headline the North American session, beginning at 12:30 GMT with retail sales. Receipts at retail stores are forecast to rise 0.1% in August after climbing 0.6% the month before. Excluding automobiles, sales are projected to rise 0.5%.
At the same time, the New York Federal Reserve Bank will release the monthly Empire State manufacturing index, which gauges business conditions for regional manufacturers.
Factory data will be front and centre at 13:15 GMT when the Fed reports on industrial production for the month of August. Output is forecast to rise 0.1% from July, following an increase of 0.2% the month before. The capacity utilization rate is expected to edge up slightly to 76.8%.
The University of Michigan will unveil its closely-watched consumer sentiment index at 14:00 GMT. The preliminary September report is expected to show a decline in consumer confidence.
The Commerce Department will report on business inventories at 14:00 GMT. Three hours later, Baker Hughes Inc. will release its weekly rig-count data.
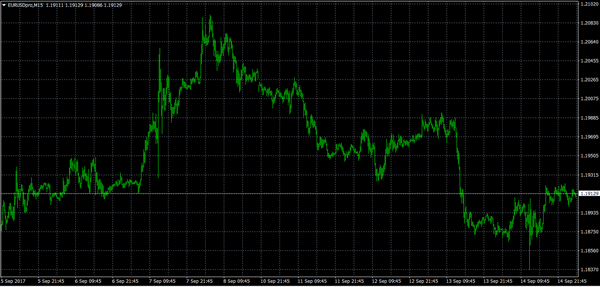
EUR/USD
The euro stabilized on Thursday after a series of sharp declines pulled prices away from new multiyear highs. The EUR/USD exchange rate was last seen trading at 1.1911, where it was little changed. The EUR/USD remains well supported, as traders continue to buy on the dips. This is likely to continue in the short term.
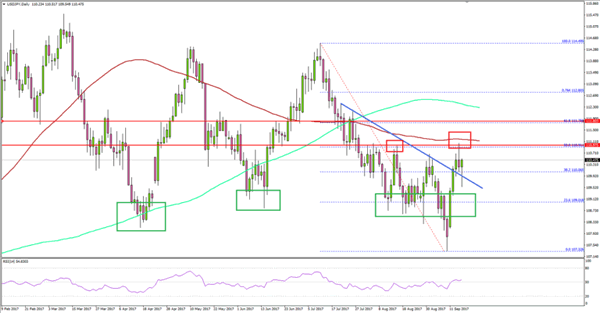
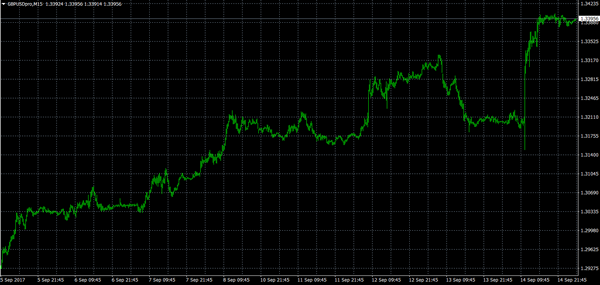
GBP/USD
The British pound put up a massive rally on Thursday after the BOE said a rate hike could be warranted in the coming months. The GBP/USD gained nearly 200 pips for the day. Cable is now eyeing the 6 September 2016 high of 1.3447 as the next target. Immediate support is located in the mid-1.31 region, which corresponds with the low from 8 September.
GOLD
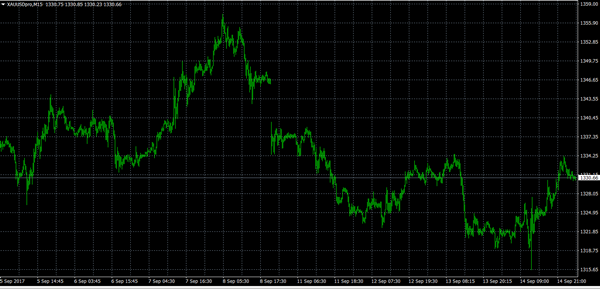
Gold prices are on track for a large weekly decline, as the US dollar stabilized and risk appetite returned to the financial markets. Spot gold was last seen trading around $1,331.00 a troy ounce. Bullion maintains a bullish outlook after a convincing rally pushed prices north of $1,300.00 – a level that had proven difficult to penetrate all year long.
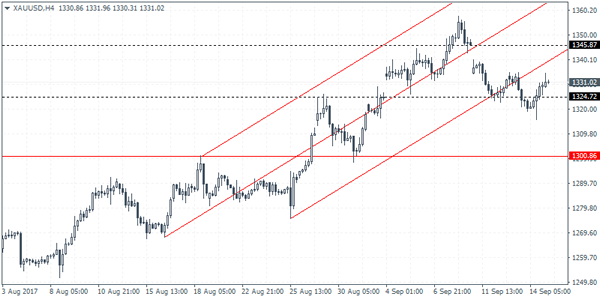
XAUUSD Intraday Analysis
XAUUSD (1331.02): Gold prices continue to remain trading flat with price action seen trading subdued. Yesterday's session saw gold prices supported near 1324.72. This puts the bias to the upside with the target of 1345.87 in sight. Given that there is an unfilled gap at this level, gold prices could be aiming to close this gap. However, the gains are likely to come by next week, closer to the FOMC meeting. To the downside, the support at 1324.72 remains a key level as a break down below could signal further decline towards 1300.86.
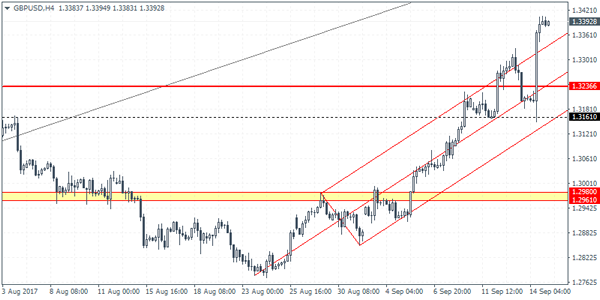
GBPUSD Intraday Analysis
GBPUSD (1.3392): The British pound continued to push higher as price rallied close to the 1.3400 handle. Support at 1.3236 remains a level area which could be tested on a decline as this level previously served as resistance. To the upside, the momentum could be seen easing off into the weekend. With the downside well supported, the GBPUSD could remain biased to the upside. However, watch for the support at 1.3236 which will be critical for price action. Failure to hold the declines here could push GBPUSD back lower to test the support at 1.3161 initially.