
Sample Category Title
XAUUSD Intraday Analysis
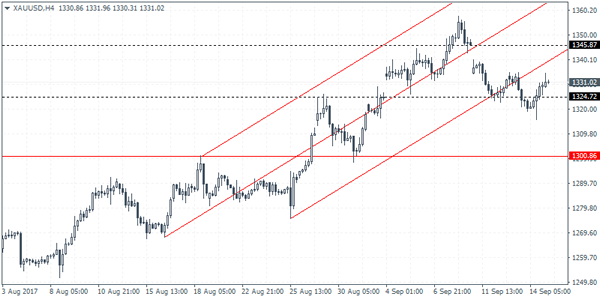
XAUUSD (1331.02): Gold prices continue to remain trading flat with price action seen trading subdued. Yesterday's session saw gold prices supported near 1324.72. This puts the bias to the upside with the target of 1345.87 in sight. Given that there is an unfilled gap at this level, gold prices could be aiming to close this gap. However, the gains are likely to come by next week, closer to the FOMC meeting. To the downside, the support at 1324.72 remains a key level as a break down below could signal further decline towards 1300.86.
GBPUSD Intraday Analysis
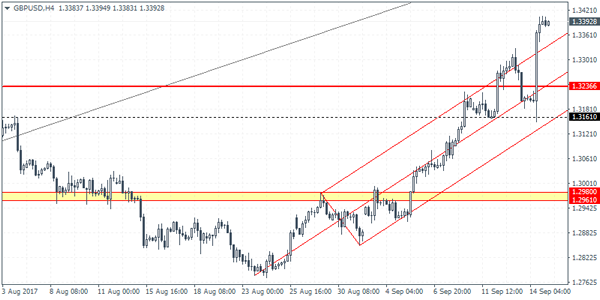
GBPUSD (1.3392): The British pound continued to push higher as price rallied close to the 1.3400 handle. Support at 1.3236 remains a level area which could be tested on a decline as this level previously served as resistance. To the upside, the momentum could be seen easing off into the weekend. With the downside well supported, the GBPUSD could remain biased to the upside. However, watch for the support at 1.3236 which will be critical for price action. Failure to hold the declines here could push GBPUSD back lower to test the support at 1.3161 initially.
EURUSD Intraday Analysis
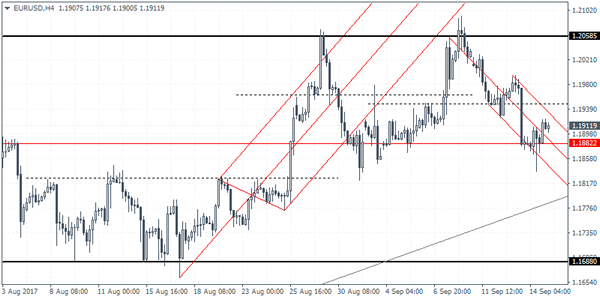
EURUSD (1.1911): The EURUSD posted a 10-day intraday low yesterday before pulling back to close on a bullish note. Price action remains strongly consolidated above the support level of 1.1882. The bounce off this level yesterday marks a test of support at this level. Further declines can only be expected on a breakdown of this support level. This puts EURUSD on a likely sideways range in the near term above 1.1822 and below 1.2058. Any near term gains will, however, struggle to breakout from the minor resistance seen at 1.1962 and 1.1947.
GBP Soars On BoE, US Inflation Picks Up
The British pound rallied to post a fresh one-year high, riding on the back of hawkish comments from the Bank of England. Despite the weak wage growth dampening investor sentiment, the Bank of England said that interest rates like to rise in the coming months. The comments helped fuel the rally in the British pound which was seen briefly trading at $1.3400.
In the US trading session, the monthly inflation data showed an increase in headline consumer prices. Rising at a pace of 0.4%, it was the largest monthly increase since January this year. On a year over year basis, US consumer prices were seen rising 1.9% in August. While the US dollar managed to post some gains, the currency was still trading weaker against its peers.
Looking ahead, the last trading day of the week will see the release of the monthly retail sales figures from the US Core retail sales are expected to rise 0.5% on the month, while headline retail sales are expected to moderate, rising 0.1%. This comes after the retail sales surged 0.6% the month before.
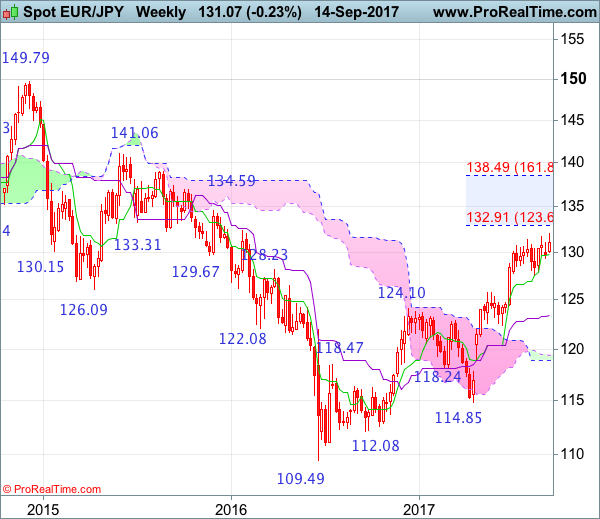
EUR/JPY Candlesticks and Ichimoku Analysis
Weekly
• Last Candlesticks pattern: Window
• Time of formation: 24 April 2017
• Trend bias: Up
Daily
• Last Candlesticks pattern: Hammer
• Time of formation: 18 May 2017
• Trend bias: Up
EUR/JPY – 131.50
As the single currency staged a strong rebound after holding above support at 129.37 and broke above previous resistance at 131.71, signaling recent upmove has once again resumed and upside risk remains for further gain to 132.50-60, however, near term overbought condition should limit upside to 133.10-15 (61.8% projection of 122.40-131.40 measuring from 127.56) and reckon 133.50-60 would hold from here, price should falter well below 134.00-10, risk from there has increased for a retreat to take place later.
On the downside, whilst initial pullback to 131.00 is likely, reckon the Tenkan-Sen (now at 130.69) would limit downside and bring another rise later. Below 130.25-30 would bring test of the Kijun-Sen (now at 129.79) but only break of said support at 129.37 would signal top is formed instead, bring retracement of recent rise to 129.00, then towards 128.45-50, however, break of latter level is needed to retain bearishness and encourage for subsequent weakness towards support at 127.56 which is likely to hold from here.
Recommendation: Stand aside for this week.
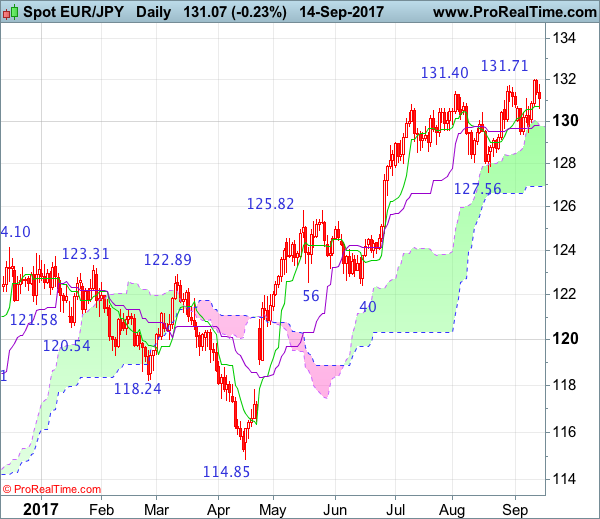
On the weekly chart, despite last week’s retreat to 129.37, as the single currency found decent demand there and has risen again, suggesting the erratic upmove from 109.49 (2016 low) is still in progress and may extend headway to previous chart resistance at 132.33, however, overbought condition should limit upside to 133.10-15 (61.8% projection of 122.40-131.40 measuring from 127.56) and reckon 134.40 (61.8% Fibonacci retracement of entire fall from 149.79-109.49) would hold, price should falter well below135.00-10, risk from there is seen for a retreat to take place later.
On the downside, expect pullback to be limited to 130.90-00 and the Tenkan-Sen (now at 129.79) should hold, bring another rise later. A drop below said support at 129.37 would suggest a temporary top is possibly formed, bring weakness to 128.90-00, then towards 128.00-10 but only break of previous support at 127.56 would confirm, bring retracement of recent upmove to 126.70-80, then towards 126.00-10 but previous resistance at 125.81 should turn into support and limit euro’s downside.
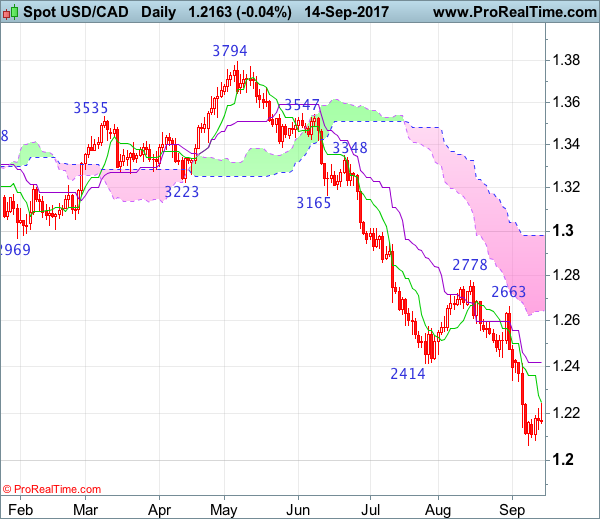
USD/CAD Candlesticks and Ichimoku Analysis
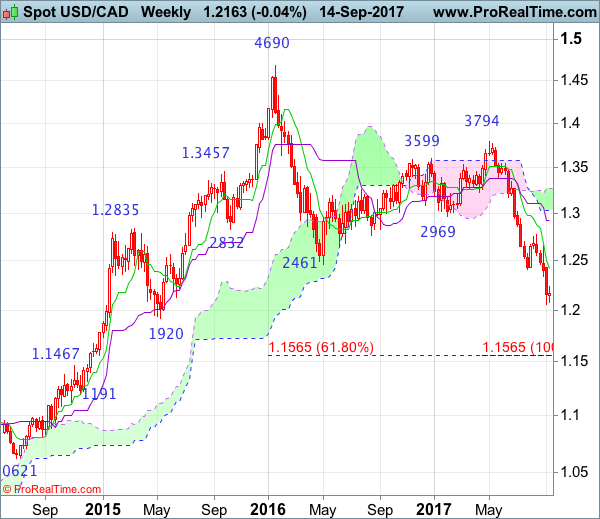
Weekly
• Last Candlesticks pattern: Shooting doji
• Time of formation: 01 May 2017
• Trend bias: Sideways
Daily
• Last Candlesticks pattern: Bearish engulfing
• Time of formation: 5 May 2017
• Trend bias: Down
USD/CAD – 1.2203
As the greenback has recovered after falling to 1.2061 late last week, suggesting consolidation above this level would be seen and test of the Tenkan-Sen (now at 1.2245) cannot be ruled out, however, reckon upside would be limited to 1.2300 and renewed selling interest should emerge around 1.2340-50, bring another decline later, below 1.2080-85 would bring retest of 1.2061 but break there is needed to confirm recent downtrend has resumed and extend further weakness to psychological level at 1.2000, having said that, oversold condition should prevent sharp fall below 1.1920-25 (61.8% projection), risk from there has increased for a rebound to take place later.
On the upside, whilst initial recovery to 1.2245-50 cannot be ruled out, reckon 1.2340-50 would limit upside and bring another decline later to aforesaid downside targets. A daily close above resistance at 1.2415 would defer and risk a stronger rebound to the Kijun-Sen (now at 1.2420) but only a sustained breach above this level would abort and signal a temporary low is formed instead, bring retracement of recent decline to 1.2520-25, then towards 1.2600 but said resistance at 1.2663 should remain intact, bring retreat later.
Recommendation: Sell again at 1.2340 for 1.2100 with stop above 1.2440.
On the weekly chart, last week’s selloff formed another black candlestick, adding credence to our view that recent decline from 1.3794 top is still in progress and may extend weakness towards psychological support at 1.2000, however, reckon downside would be limited to 1.1920-25 (61.8% projection of 1.3794-1.2414 measuring from 1.2778) and reckon 1.1840-50 would hold from here, price should stay above 1.1750-60, bring rebound later this month.
On the upside, although initial recovery to 1.2240-50 and then 1.2300 cannot be ruled out, reckon upside would be limited to 1.2340-50 and bring another decline. A weekly close above previous support at 1.2414 would risk test of last week’s high at 1.2429 (this would also penetrate the Tenkan-Sen at 1.2420) but upside should be limited to 1.2500. Only a break above resistance at 1.2663 would suggest recent decline has ended instead, bring subsequent bounce to 1.2700 and later towards previous resistance at 1.2778.
A Stronger Picture For The UK?
North Korea fired another missile over Japan into the Pacific Ocean on Friday. The regimes defiance towards recent UN sanctions has had a mooted effect on the markets as many are growing accustomed to Pyongyang’s actions.
In an unsurprising move on Thursday, the Bank of England’s Monetary Policy Committee voted 7-2 to keep UK interest rates at 0.25%. The minutes of the meeting commented that there is a “slightly stronger picture” for the UK Economy with a strong labour market, continued housing demand and the recent improvement in retail sales. Such rhetoric has many believing that, if wage growth continues to rise, the possibility of a rate hike may occur earlier than expected. Following the meeting, GBPUSD rose over 1.4% to reach 1.34038 – a level last seen 12 months ago.
On Thursday, data from the US Labour Department revealed a rise to 0.4% in August in the Consumer Price Index – bettering July’s insipid 0.1% increase. Core CPI is running at 1.7%, which is likely to provide some much-needed assistance to the Fed and its 2% inflation target. Following the data release, the likelihood of a US rate hike in December increased to 50.9% from 41.3%, per CME#’s FedWatch Tool. More data showed the US Labour market staying strong, as initial claims for unemployment benefits declined 14K. The seasonally adjusted rate of 284K (week ending September 9th) is below the 300K threshold for 132 weeks – the longest such run since 1970. The strong labour market appears to be helping, finally, push inflation higher. Market focus will now center around next week’s FOMC meeting for more clues on US economic policy and the timing of tightening in the months ahead.
EURUSD climbed, after hitting a 2-week low on Thursday, to currently trade around 1.1920.
USDJPY is little changed and currently trades around 110.40.
GBPUSD hit a 1-year high on Thursday and has maintained upwards momentum overnight to currently trade around 1.3410.
Gold was relatively flat and currently trades around $1,330.
WTI slipped overnight, after gaining over 1% on Thursday. Currently, WTI is trading around $50.20.
Major economic data releases for today:
At 11:00, Eurostat will release Eurozone Trade Balance for July. Consensus is suggesting €21.4B from the previous release of €26.6B. With relatively good economic growth in the Eurozone the markets will likely only react if the data is significantly different than expected.
At 13:30, the US Census Bureau will release the “much anticipated” Retails Sales (MoM) report for August. The previous strong reading of 0.6% is not expected to be beaten with the release today – consensus is suggesting a figure of 0.1%. As a good indicator of consumer spending, the markets will be hoping that the release stays in positive territory. A negative release will cause a weakening in USD and add volatility into the markets.
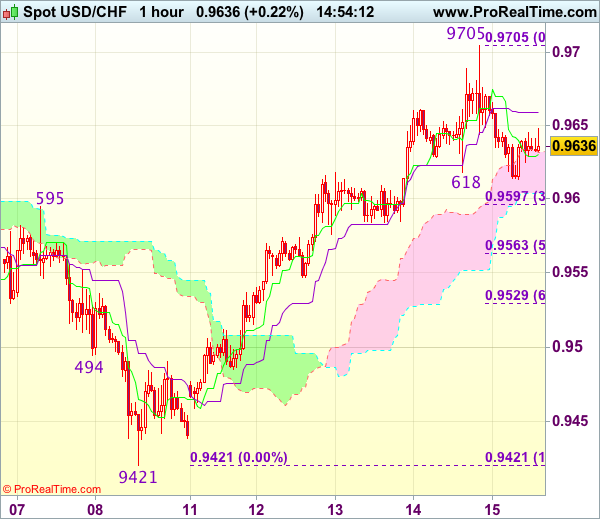
Trade Idea : USD/CHF – Hold short entered at 0.9680
USD/CHF - 0.9633
Most recent candlesticks pattern : N/A
Trend : Near term up
Tenkan-Sen level : 0.9662
Kijun-Sen level : 0.9658
Ichimoku cloud top : 0.9598
Ichimoku cloud bottom : 0.9552
Original strategy :
Sold at 0.9680, Target: 0.9580, Stop: 0.9705
Position : - Short at 0.9680
Target : - 0.9580
Stop : - 0.9705
New strategy :
Hold short entered at 0.9680, Target: 0.9580, Stop: 0.9680
Position : - Short at 0.9680
Target : - 0.9580
Stop : - 0.9680
Although the greenback surged to as high as 0.9705 yesterday, the subsequent retreat has retained our near term bearishness and consolidation with mild downside bias is seen for weakness to 0.9595-00 (38.2% Fibonacci retracement of 0.9421-0.9705), however, break of 0.9560-65 (50% Fibonacci retracement) is needed to signal top is formed, bring further fall towards 0.9525-30 (61.8% Fibonacci retracement).
In view of this, we are holding on to our short position entered at 0.9680. Only above said resistance at 0.9705 would extend gain to 0.9725-30 but still reckon upside would be limited and 0.9761-66 (50% Fibonacci retracement of 1.0100-0.9421 and previous resistance) should hold, risk remains for another retreat to take place soon.
North Korea Missile Launch Not Entirely Unexpected, Reaction Calm
US Dollar Stabilizes After Sharp Fall. North Korea fired a missile on Friday that flew over Japan’s northern Hokkaido far out into the Pacific Ocean, South Korean and Japanese officials said, further ratcheting up tensions after Pyongyang’s recent test of a powerful nuclear bomb. The U.S. dollar fell sharply against the safe-haven yen and Swiss franc in early Asian hours, though it stabilized quickly, as the missile launch did not catch the market entirely off guard, as North Korea was expected to react after the latest U.N. Security Council sanctions.
British Pound Runs Higher on Carney Comments. Sterling climbed to fresh one-year high of $1.3407 against the Dollar and near-two-month highs against the Euro after Bank of England Governor Mark Carney gave his positive comments on the possibility of the first U.K. interest rate hike in a decade.
Oil Prices Set for Weekly Gains as Demand Outlook Brightens. Oil prices jumped, with international benchmark Brent futures hitting a five-month high, supported by a string of reports forecast the market would tighten further as fuel demand increased.
Elliott Wave View: DXY
DXY Dollar Index Short Term Elliott Wave view suggests that the Index ended Primary wave ((3)) at 91.01. Primary wave ((4)) bounce is proposed complete at 92.66 as a double three Elliott Wave structure. Wave (W) of ((4)) ended at 92.01, wave (X) of ((4)) ended at 91.71, and wave (Y) of ((4)) is proposed complete at 92.66. Down from there, Intermediate wave (1) ended at 91.97. Intermediate wave (2) bounce is in progress in 3, 7, or 11 swing to correct cycle from 9/14 peak. While bounces stay below there, expect Index to extend lower. We don’t like buying the Dollar Index.
DXY 1 Hour Elliott Wave Chart
