
Sample Category Title
Following The Upward Surprise In US CPI Inflation Yesterday
Market movers today
Following the upward surprise in US CPI inflation yesterday, focus on the macro front today turns to US retail sales for August, which we estimate increased by 0.3%. Preliminary consumer confidence for September from the University of Michigan is also released. Like business confidence, consumer confidence is still very high, but Hurricane Harvey and an unstable political environment within the US may have weighed on it and we estimate a slight fall to 95.0. Also, keep an eye on the five- to 10-year inflation expectations in the survey. They trended lower during 2015 and 2016 but have moved sideways at around 2.5% for a year now.
The US Empire index (business confidence) is likely to retreat a bit in September after hitting the highest level in three years in August. The indicator is quite volatile and the August level was likely to be ‘too strong’ relative to the underlying development. US industrial production for August is also due and estimated to increase 0.1% m/m.
On the central bank front, we have speeches today by ECB members Nouy (8:00 CEST), Visco (09:00 CEST) and Lautenschläger (10:15 CEST).
With the German parliamentary election less than 10 days away, we have published another German election monitor No. 2, 14 September, looking at some of the most pressing issues that politicians will have to deal with in the future.
Selected market news
US stock futures and Asian shares dipped after North Korea fired another Intercontinental Ballistic Missile over Japan into the Pacific Ocean this morning, demonstrating its defiance to new UN sanctions agreed on 3 September. Save haven assets were consequently in demand this morning, with gold firmer and USD/JPY dipping back below 110. The launch is likely to weigh on risk sentiment today, but the market impact should be short-lived unless the conflict escalates, given that we have already seen similar launches from North Korea in past weeks and months.
As we expected, the Bank of England (BoE) left its policy unchanged at the meeting yesterday, but it surprised with a warning of a possible forthcoming rate hike ‘over coming months’ if underlying inflation moves higher and the unemployment rate moves lower. The comment fuelled a GBP rally (see FX section). We think a hike in November is a close call but given that one condition is ‘a gradual rise in underlying inflationary pressure’, which we interpret as higher wage growth, we still think the BoE will stay on hold this year. Our base case is now a hike in Q1 18, as the BoE is less worried about political uncertainty and more focused on economic data.
Japanese manufacturers' confidence worsened for the first time in four months in September from the previous month's decade high. Manufacturing PMIs have shown similar signs of a slowdown, but we still expect the recent growth momentum to continue in 2017, supported by a very strong labour market, the global economic recovery and extremely accommodative economic policies.
EUR/JPY Daily Outlook
Daily Pivots: (S1) 131.07; (P) 131.41; (R1) 131.72; More...
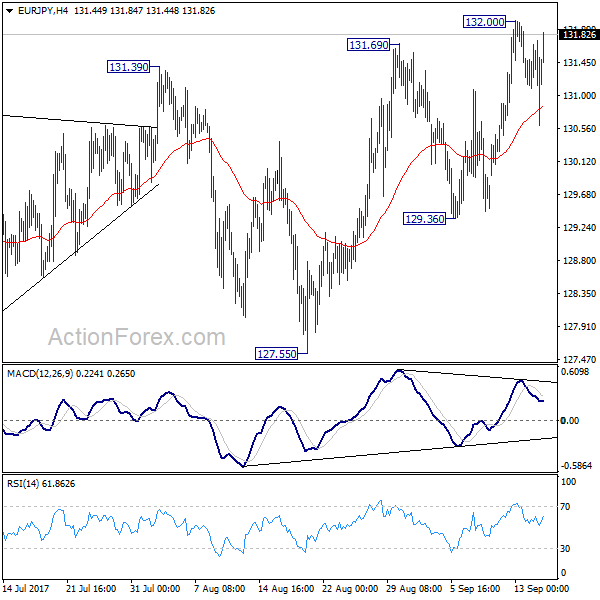
Intraday bias in EUR/JPY remains neutral for the moment. Near term outlook remains bullish with 129.36 support intact and further rise is expected. Break of 132.00 will turn bias back to the upside and target 134.20 fibonacci level next. However, considering bearish divergence condition in 4 hour MACD, break of 129.36 will indicate short term topping and turn bias to the downside for 127.55 support instead.
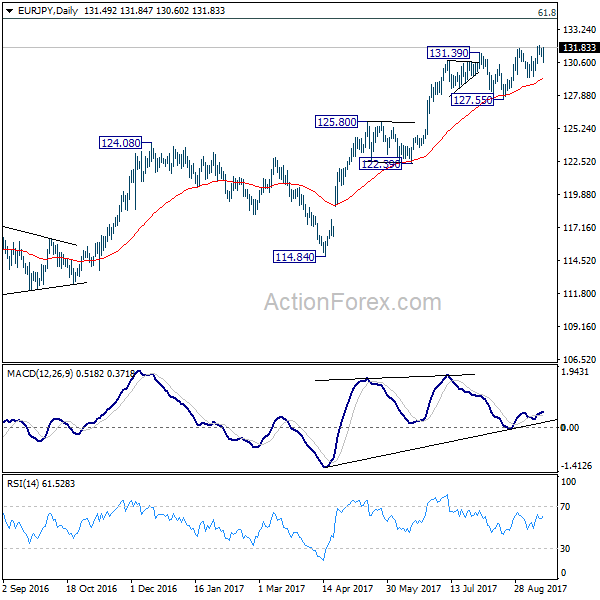
In the bigger picture, current rise from 109.03 is seen as at the same degree as the down trend from 149.76 (2014 high) to 109.03 (2016 low). as long as 124.08 resistance turned support holds, further rise is expected to 61.8% retracement of 149.76 to 109.03 at 134.20. Sustained break there will pave the way to key long term resistance zone at 141.04/149.76. However, firm break of 124.08 will argue that rise from 109.03 is completed and turn outlook bearish.
EUR/CHF Daily Outlook
Daily Pivots: (S1) 1.1437; (P) 1.1482; (R1) 1.1528; More... .
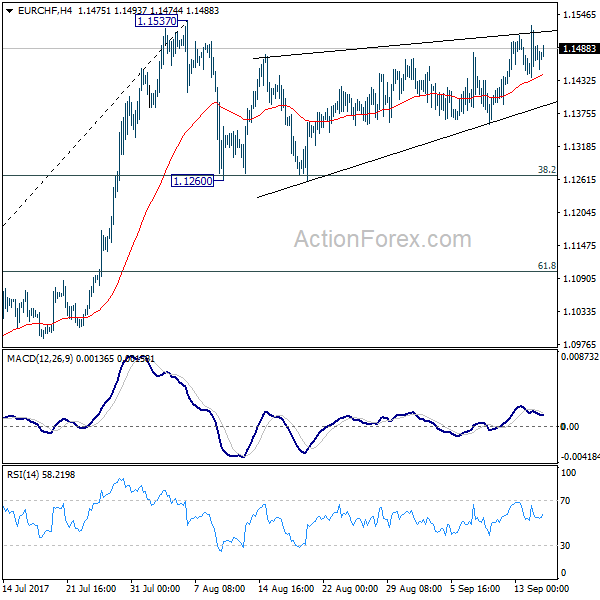
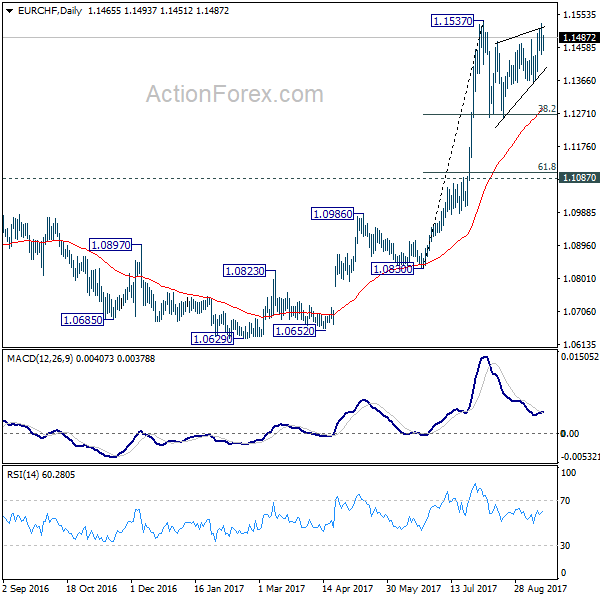
Intraday bias in EUR/CHF remains neutral as consolidation from 1.1537 is still in progress. Another fall cannot be ruled out. In that case, downside should be contained by 38.2% retracement of 1.0830 to 1.1537 at 1.1267 to bring rebound. On the upside, break of 1.1537 resistance will confirm resumption of larger rally from 1.0629. In that case, EUR/CHF should target 1.2 key resistance level next.
In the bigger picture, long term rise from SNB spike low back in 2015 is still in progress. EUR/CHF should now be heading back to prior SNB imposed floor at 1.2000. For now, this will be the favored case as long as 1.1087 resistance turned support holds.
EUR/AUD Daily Outlook
Daily Pivots: (S1) 1.4823; (P) 1.4872; (R1) 1.4933; More....
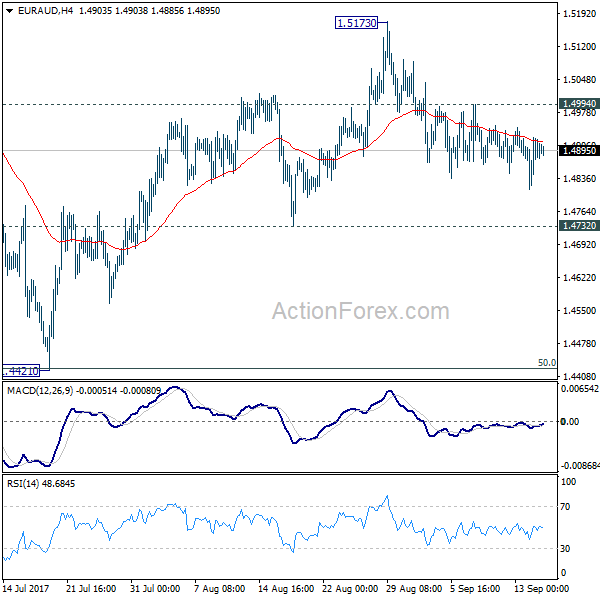
No change in EUR/AUD's outlook. With 1.4994 minor resistance intact, deeper fall is expected to 1.4732 support. Decisive break there will confirm that fall from 1.5173 is the third leg of consolidation pattern from 1.5226. In that case, further fall should be seen to 1.4421 again. But we'd expect strong support from there to contain downside and bring rebound. On the upside, above 1.4994 minor resistance will turn bias back to the upside for 1.5173/5226 resistance zone instead.
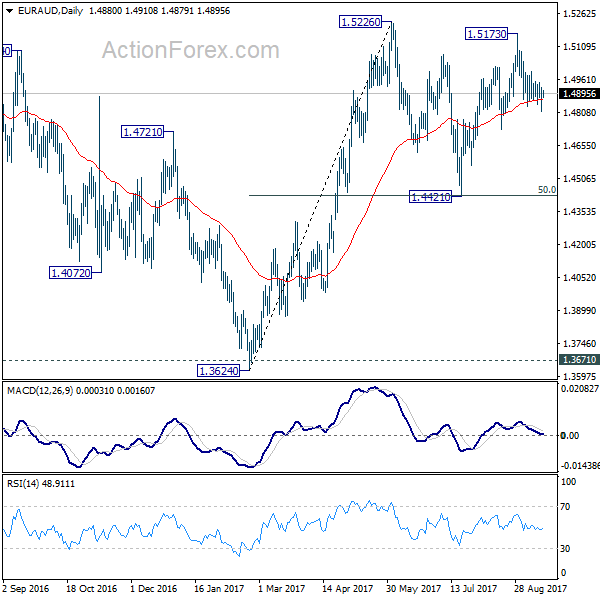
In the bigger picture, we're holding on to the view that corrective decline from 1.6587 medium term has completed at 1.3624. Rise from 1.3624 is expected to extend to retest 1.6587. The corrective structure of the price actions from 1.5226 is affirming this view. Above 1.5226 will target a test on 1.6587 key resistance. However, break of 1.4421 support will dampen our view and would drag EUR/AUD lower to retest key support zone around 1.3624.
EUR/GBP Daily Outlook
Daily Pivots: (S1) 0.8827; (P) 0.8935; (R1) 0.9003; More
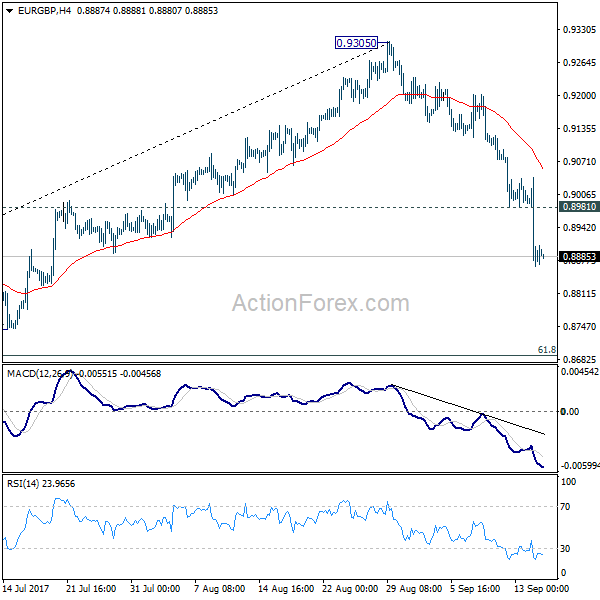
Intraday bias in EUR/GBP remains on the downside as fall from 0.9305 is still in progress. Current decline is seen as the third leg of the consolidation pattern from 0.9304. Deeper fall should be seen to 61.8% retracement of 0.8312 to 0.9305 at 0.8691 and below. We'll look for bottoming signal again at it approaches 0.8303 support. On the upside, above 0.8981 minor resistance will turn intraday bias neutral and bring recovery, before staging another fall.
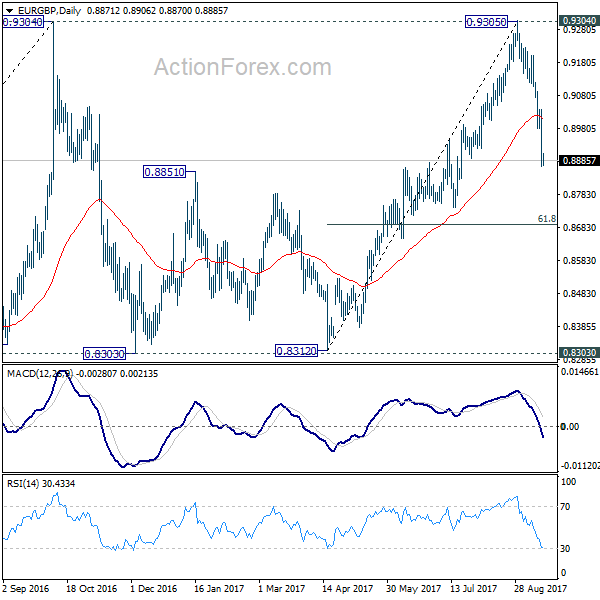
In the bigger picture, price actions from 0.9304 are viewed as a medium term corrective pattern. It's uncertain whether it is finished yet. But in case of another fall, we'd expect strong support from 0.8116 cluster support (50% retracement of 0.6935 to 0.9304 at 0.8120) to contain downside and bring rebound. Whole up trend from 0.6935 is expected to resume after consolidation from 0.9304 completes. Firm break of 0.9799 high will target 61.8% projection of 0.5680 to 0.9799 from 0.6935 at 1.1054.
Markets Yawn Another North Korea Missile Launch, Sterling and Dollar to End the Week Strong
North Korean launched another missile test before the weekend. Even though it proves its capability of reaching Guam, market reactions are very muted this time. Japanese yen Yen and Swiss Franc remain the weakest major currencies for the week. And Nikkei maintains earlier gains and is trading up 0.5% at the time of writing. Sterling is set to end the week as the strongest one, riding on the hawkish BoE message that tightening would come within months. Dollar follows as the second strongest as supported by expectation of a tax reform plan later this month, and pick up in inflation. Indeed fed fund futures are now pricing in 52.9% chance of a Fed hike in December, up from 31% a week ago.
North Korea proves that Guam is reachable
North Korea fired another ballistic missile over the northern Japanese island of Hokkaido today. It's the second one that flied over Japan in less than a month. The missile reached an altitude of 770km and traveled 3700km before landing in the Pacific Ocean. It should be noted that the range of this missile test now proves that Guam is reachable. This came just after the United Nations Security Council approved fresh sanction earlier this week. US President Donald Trump hasn't responded to the missile test yet. Instead, Secretary of State Rex Tillerson said in a statement that "these continued provocations only deepen North Korea's diplomatic and economic isolation." Tillerson also urged China and Russia to take actions as "China supplies North Korea with most of its oil. Russia is the largest employer of North Korean forced labor."
South Korean President Moon Jae-in condemned the latest test and warned "we have the power to smash North Korea into powder and put it beyond recovery if it provokes us or our alliance." Japan Prime Minister Shinzo Abe said the launch was "totally unacceptable" and went against "the international community's strong, united will for a peaceful solution." Abe urged the international community to "unite and send clear message after North Korea's dangerous provocation." And, "We must let North Korea understand there is no bright future for North Korea if it continues in this way."
Business leaders to urge speedy and pragmatic Brexit talks
As in a draft letter published by the media, UK trade group Confederation of British Industry is drawing support from business leaders to urge speedy and pragmatic progress of Brexit negotiation by October. The letter is organized by CBI, and is supposed to be signed by business leaders that "employ nearly one million people in the UK and EU." It emphasized the need to "make decisions now about investment and employment". And warned that "continuing uncertainty will adversely affect communities, employees, firms and our nations in the future." It called fall both sides to be "pragmatic and determined to move to the next stage of the negotiations." That is, "ensure that substantive progress is achieved during the upcoming negotiations." And, "enable discussion of transitional arrangements in October and trade, by the end of the year."
Market pricing in 50% chance on BoE hike in November
Overshooting of inflation has led BOE to turn more hawkish. As revealed at the September meeting minutes, "a majority of MPC members judge that, if the economy continues to follow a path consistent with the prospect of a continued erosion of slack and a gradual rise in underlying inflationary pressure then, with the further lessening in the trade-off that this would imply, some withdrawal of monetary stimulus is likely to be appropriate over the coming months in order to return inflation sustainably to target". Yet, it stressed that any rate hike "would be expected to be at a gradual pace and to a limited extent". The members forecast headline CPI would rise above 3% next month, following the stronger-than-expected 2.9% in September. The market has priced in about 50% of a rate hike in November, while the chance for a hike in February next year is fully priced in. More in Eyebrows Raised as BOE signaled to Hike Rates in Coming Months
On the data front
New Zealand business manufacturing index rose to 57.9 in August. Eurozone will release trade balance today. But main focus will be on US data including retail sales, industrial production, U of Michigan confidence and business inventories.
EUR/GBP Daily Outlook
Daily Pivots: (S1) 0.8827; (P) 0.8935; (R1) 0.9003; More
Intraday bias in EUR/GBP remains on the downside as fall from 0.9305 is still in progress. Current decline is seen as the third leg of the consolidation pattern from 0.9304. Deeper fall should be seen to 61.8% retracement of 0.8312 to 0.9305 at 0.8691 and below. We'll look for bottoming signal again at it approaches 0.8303 support. On the upside, above 0.8981 minor resistance will turn intraday bias neutral and bring recovery, before staging another fall.
In the bigger picture, price actions from 0.9304 are viewed as a medium term corrective pattern. It's uncertain whether it is finished yet. But in case of another fall, we'd expect strong support from 0.8116 cluster support (50% retracement of 0.6935 to 0.9304 at 0.8120) to contain downside and bring rebound. Whole up trend from 0.6935 is expected to resume after consolidation from 0.9304 completes. Firm break of 0.9799 high will target 61.8% projection of 0.5680 to 0.9799 from 0.6935 at 1.1054.
Economic Indicators Update
| GMT | Ccy | Events | Actual | Forecast | Previous | Revised |
|---|---|---|---|---|---|---|
| 22:30 | NZD | Business NZ Manufacturing Index Aug | 57.9 | 55.4 | 55.5 | |
| 9:00 | EUR | Eurozone Trade Balance (EUR) Jul | 22.1B | 22.3B | ||
| 12:30 | USD | Empire State Manufacturing Sep | 18 | 25.2 | ||
| 12:30 | USD | Advance Retail Sales Aug | 0.10% | 0.60% | ||
| 12:30 | USD | Retail Sales Less Autos Aug | 0.50% | 0.50% | ||
| 13:15 | USD | Industrial Production Aug | 0.10% | 0.20% | ||
| 13:15 | USD | Capacity Utilization Aug | 76.80% | 76.70% | ||
| 14:00 | USD | U. of Michigan Confidence Sep P | 95.6 | 96.8 | ||
| 14:00 | USD | Business Inventories Jul | 0.20% | 0.50% |
Daily Technical Outlook And Review: EUR/USD, GBP/USD, AUD/USD, USD/JPY, USD/CAD, USD/CHF, DOW 30, GOLD
A note on lower timeframe confirming price action...
Waiting for lower timeframe confirmation is our main tool to confirm strength within higher timeframe zones, and has really been the key to our trading success. It takes a little time to understand the subtle nuances, however, as each trade is never the same, but once you master the rhythm so to speak, you will be saved from countless unnecessary losing trades. The following is a list of what we look for:
- A break/retest of supply or demand dependent on which way you're trading.
- A trendline break/retest.
- Buying/selling tails ... essentially we look for a cluster of very obvious spikes off of lower timeframe support and resistance levels within the higher timeframe zone.
- Candlestick patterns. We tend to only stick with pin bars and engulfing bars as these have proven to be the most effective.
We typically search for lower-timeframe confirmation between the M15 and H1 timeframes, since most of our higher-timeframe areas begin with the H4. Stops are usually placed 1-3 pips beyond confirming structures.
EUR/USD
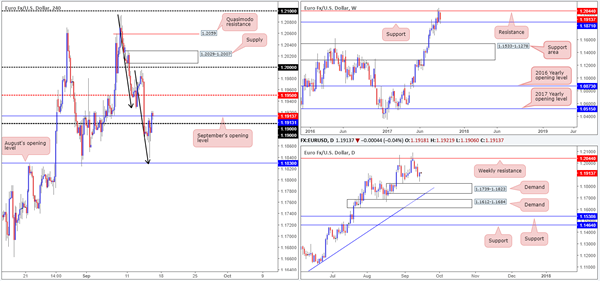
In recent news, US inflation data reported a hotter-than-expected month, instantly sending the single currency lower and dollar higher. In spite of this the pair was unable to hold its bearish tone, and reversed immediate losses in a matter of minutes from just ahead of August’s opening level pegged at 1.1830.
For those who follow our analysis regularly you may recall that 1.1830 was labeled a high-probability buy zone on Thursday. Not only is the number positioned a few pips above daily demand at 1.1739-1.1823, it also converged with a H4 AB=CD bullish formation (see black arrows). Well done to anyone who managed to get on board this move – we unfortunately missed it since 1.1830 was never filled.
Technically speaking, we believe the recent upside move is likely due to weekly buyers flooding the market from support at 1.1871, and dollar sellers chomping lower from weekly resistance at 11854.
Suggestions: Near-term action shows H4 price trading marginally above September’s opening line at 1.1913. While this potentially clears upside to at least the mid-level resistance 1.1950, traders may want to note that USDX H4 candles are trading from demand (a push higher from here could send the EUR lower). Overall however, we still feel upside is the more likely route given the technicals on the EUR along with its underlying trend. Be that as it may, longing this market with 1.1950 so close is not something our team is willing to commit to at this time.
Data points to consider: US Retail sales figures at 1.30pm; US Prelim UoM Consumer report at 3pm GMT+1.
Levels to watch/live orders:
- Buys: Flat (stop loss: N/A).
- Sells: Flat (stop loss: N/A).
GBP/USD:
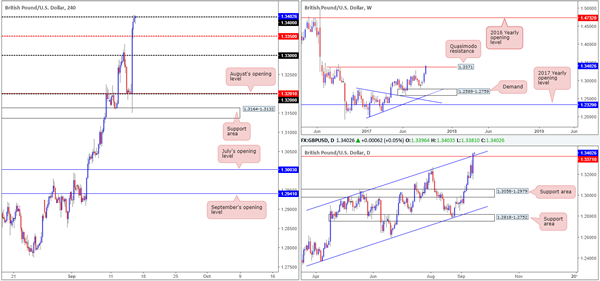
The British pound launched itself north after the Bank of England gestured it could hike interest rates sooner than planned. Whipsawing through the 1.32 handle and bringing in the H4 support area at 1.3164-1.3132, the pair advanced more than 200 pips on the day, closing just ahead of the 1.34 handle.
While every man and his dog are now long GBP, it might be worth noting where the unit is trading over on the bigger picture. The weekly timeframe highlights the Quasimodo resistance at 1.3371. Although price has peeked above this number, it’d be unwise to count this area out as the major has yet to engulf its apex at 1.3445. Along similar lines, daily price shows the candles marginally breached a channel resistance extended from the high 1.2965. Again though, we feel it unwise to count this ascending resistance out just yet. Conversely however, the USDX is seen trading from a weekly resistance line at 11854, thus adding to the possibility of further upside being seen on the GBP.
Suggestions: Admittedly, the bulls certainly have an edge this morning where fundamentals are concerned. However, we cannot ignore the pair’s technical position, which leaves us little choice but to remain flat at this time.
Data points to consider: MPC Member Vlieghe speaks at 9.50am. US Retail sales figures at 1.30pm; US Prelim UoM Consumer report at 3pm GMT+1.
Levels to watch/live orders:
- Buys: Flat (stop loss: N/A).
- Sells: Flat (stop loss: N/A).
AUD/USD
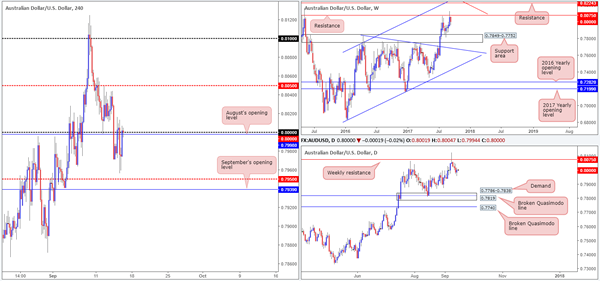
In early trading, upbeat Aussie employment figures saw the commodity currency take off north and crunch its way through the key 0.80 level. Shortly after, however, price began paring gains on weaker Chinese data. Despite all of this, the pair ended the day closing in the green, breaking a three-day bearish phase.
On the whole, the market remains entrenched within a relatively strong uptrend, but has recently begun stalling at weekly resistance carved from 0.8075. Should the sellers move it up a gear from here, the next downside target does not come into view until we reach the weekly support area fixed at 0.7849-0.7752.
Suggestions: As of current price, we can see the H4 candles trading marginally above the 0.80 handle. In such a strong trending environment, this would typically be considered a bullish sign. But, considering weekly price is having a hard time mustering enough strength to breach weekly resistance at the moment; it might not be the best of times to long the Aussie. That is unless you fancy a possible drawdown of around 150 pips down to the noted weekly support area!
Data points to consider: US Retail sales figures at 1.30pm; US Prelim UoM Consumer report at 3pm GMT+1.
Levels to watch/live orders:
- Buys: Flat (stop loss: N/A).
- Sells: Flat (stop loss: N/A).
USD/JPY
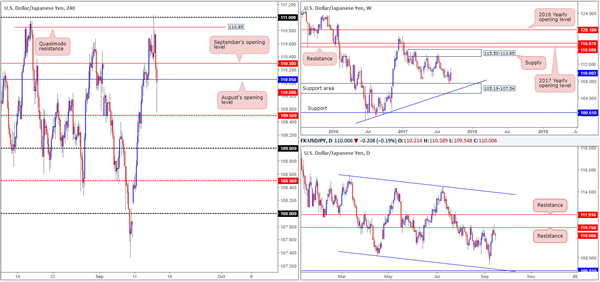
US inflation data came in better than expected on Thursday, consequently forcing the H4 candles to whipsaw through the Quasimodo resistance at 110.85 and bring the 111 handle into the picture. This – coupled with daily resistance plotted at 110.76 was enough to bring the unit lower during the later hours of NY.
Given how well the daily resistance held during the month of August, the unit could possibly see further selling. While this may be true, weekly buyers may have something to say about that as price is seen bolstered from a support area coming in at 105.19-107.54.
Suggestions: To be completely honest, this, like the three other majors analyzed above, are tricky markets to trade at the moment. A short would have you going up against possible weekly buying, and a long places you in direct conflict with daily sellers! Alongside this, there is really not anything tasty cooking on the H4 chart at the moment. With that being said, we will continue to remain flat and look to reassess structure going into Monday’s open.
Data points to consider: US Retail sales figures at 1.30pm; US Prelim UoM Consumer report at 3pm GMT+1.
Levels to watch/live orders:
- Buys: Flat (stop loss: N/A).
- Sells: Flat (stop loss: N/A).
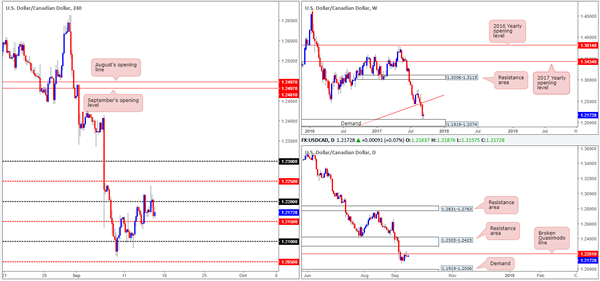
USD/CAD
Weekly buyers, as you can see, remain undecided after crossing swords with demand at 1.1919-1.2074. This is likely due to two things: the strong downtrend this pair has been in since May and daily price finding a pocket of offers around the broken Quasimodo line at 1.2201 (notice the bearish pin bar formed from here yesterday).
Across on the H4 timeframe, price failed to sustain gains beyond the 1.22 handle despite upbeat US inflation. Given the weakness seen around weekly demand at the moment and USDX weekly price trading from resistance at 11854, a H4 close beyond the mid-level support at 1.2150 would be interesting.
Suggestions: A H4 close below 1.2150 will, in our view, help confirm bull weakness at the current weekly demand, and at the same time demonstrate bearish intent from the daily broken Quasimodo resistance. A retest at 1.2150, coupled with a lower-timeframe sell signal (see the top of this report), would be sufficient enough to trade short, targeting 1.21 as an INITIAL take-profit zone. Ultimately though, we would be aiming for the daily demand drawn from 1.1919-1.2006.
Data points to consider: US Retail sales figures at 1.30pm; US Prelim UoM Consumer report at 3pm GMT+1.
Levels to watch/live orders:
- Buys: Flat (stop loss: N/A).
- Sells: Watch for H4 price to engulf 1.2150 and then look to trade any retest seen thereafter ([waiting for a lower-timeframe sell signal to form following the retest is advised] stop loss: dependent on where one confirms this level).
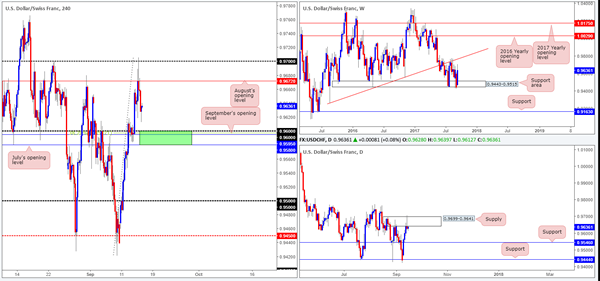
USD/CHF
During the course of yesterday’s sessions H4 price sliced through August’s opening level at 0.9672, and brought in the 0.97 handle. The move, influenced by optimistic US inflation figures, failed to generate much follow-through action beyond the 0.97 mark, thus forcing the pair lower on the day.
From the weekly timeframe, price continues to reflect a strong bullish stance after shaking hands with the support area seen at 0.9443-0.9515. Despite room being seen for the bulls to extend gains here, the weekly USDX chart shows price selling off from resistance at 11854.
Turning our attention to the daily timeframe, recent movement chalked up a nice-looking bearish pin bar around supply penciled in at 0.9699-0.9641. In the event that this candle formation is respected, a push back down to support at 0.9546 could be on the cards.
Suggestions: We really like the look of the green H4 zone for potential longs. Comprised of both July and September’s opening levels at 0.9580/0.9595, a round number 0.96 and a 38.2% Fib support taken from the low 0.9420, this has the makings of a reasonably decent area. A long from here, however, should only be considered if, and only if, there’s additional candle confirmation seen. The reason for this is simply because by entering long from here you are effectively going up against daily sellers from supply and possibly weekly USDX sellers from resistance mentioned above at 11854. Assuming there is no H4 supplies formed on approach, our first port of call, should a trade from 0.9580/0.96 come to fruition, would be August’s opening level.
Data points to consider: US Retail sales figures at 1.30pm; US Prelim UoM Consumer report at 3pm GMT+1.
Levels to watch/live orders:
- Buys: 0.9580/0.96 ([waiting for a H4 bullish candle to form – preferably in the shape of a full, or near full-bodied candle – is advised] stop loss: ideally beyond the candle’s tail).
- Sells: Flat (stop loss: N/A).
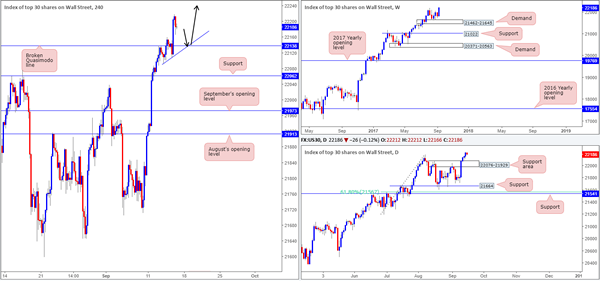
DOW 30
US equities surged to a record high of 22218 on Thursday amid US trading. In recent hours, nevertheless, gains have mildly been pared bringing the unit down to a low of 22166. With this recent movement in mind, we feel stocks are a good buy at this time, at least from a technical standpoint. An ideal buy zone, for us, would be the H4 broken Quasimodo line at 22138, which happens to be joined together with a minor H4 trendline support etched from the low 22092.
Suggestions: To help avoid being whipsawed out of a trade from 22138 we would strongly recommend waiting for additional confirmation to prove that there is buyer intent present. Similar to yesterday’s trade call from 22138, the beautiful thing about this setup is that there is effectively no clear take-profit target, meaning that we could potentially join, what seems to be, a never-ending bull run.
Data points to consider: US Retail sales figures at 1.30pm; US Prelim UoM Consumer report at 3pm GMT+1.
Levels to watch/live orders:
- Buys: 22138 region ([waiting for a reasonably sized H4 bullish candle to form – preferably a full, or near-full-bodied candle – is advised] stop loss: ideally beyond the candle’s tail).
- Sells: Flat (stop loss: N/A).
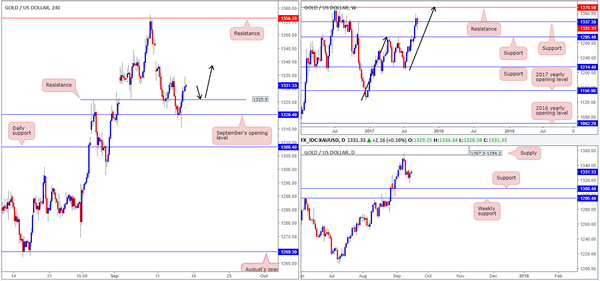
GOLD
With weekly candles seen trading back below USDX resistance at 11854, it was no surprise to see the H4 gold candles extend higher and crush offers at resistance drawn from 1325.9 (now acting support). With this in mind, we are now looking at the possibility of a long trade on any retest seen at 1325.9 today. However, as discussed in Thursday’s report this does not come without risk. Not only do we have weekly price trading below support at 1337.3, we also see little support on the daily timeframe until reaching the 1308.4 mark.
Suggestions: In light of the recent advance, our analysis is simple. Look to trade any retest seen from 1325.9 IF H4 price prints a reasonably sized bull candle, preferably in the shape of a full, or near-full-bodied formation. Should the trade come to realization, we do not see much upside resistance until the underside of daily supply at 1354.2.
Levels to watch/live orders:
- Buys: 1325.9 region ([waiting for a reasonably sized H4 bullish candle to form – preferably a full, or near-full-bodied candle – is advised] stop loss: ideally beyond the candle’s tail).
- Sells: Flat (stop loss: N/A).
European Open Briefing: USD/JPY Had Plenty Of Action Early On Friday
Global Markets:
- Asian stock markets: Nikkei rose 0.51 %, Shanghai Composite fell 0.32 %, Hang Seng up 0.41 %, ASX 200 fell 0.69 %
- Commodities: Gold at $1334.16 (0.37 %), Silver at $17.85 (0.38 %), WTI Oil at $49.76 (-0.26 %), Brent Oil at $55.30 (-0.31%)
- Rates: US 10-year yield at 2.18, UK 10-year yield at 1.23, German 10-year yield at 0.41
News & Data:
- (CHF) Libor Rate -0.75 % vs -0.75 % expected
- (GBP) MPC Official Bank Rate Votes 2-0-7 vs 2-0-7 expected
- (GBP) Official Bank Rate 0.25 % vs 0.25 % expected
- (USD) CPI m/m 0.4 % vs 0.3 % expected
- (USD) Core CPI m/m 0.2 % vs 0.2 % expected
- (USD) Unemployment Claims 284 K vs 303 K expected
- (NZD) Business NZ Manufacturing Index 57.9 vs 55.5 previous
- Japan PM Abe: Calling On UN To Hold Emergency Security Council Meeting. N Korea Threatening World Peace Through Provocation
- Trump says no decision yet on Fed chair; 'respects' Yellen- RTRS
Markets Update:
Asian equity markets were broadly lower following North Korea's latest missile launch over Japan early on Friday. The unidentified missile flew over Japan before landing 2,000 km east of Hokkaido, Reuters said, citing Japanese broadcaster NHK. The launch came just days after the U.N. Security Council approved new sanctions against Pyongyang for its Sept. 3 nuclear test, but markets are growing accustomed to North Korea's sabre-rattling.
USD/JPY had plenty of action early on Friday, Price dropped like a rock below 109.60 at one stage as the Yen gained as much as 0.6 percent, however almost instantly recovered most of its losses rallying back toward 110 rapidly. Currently the Yen is seen trading around 110.40 against the US dollar. Similar to the USD/JPY most of the Yen crosses went lower and then these, too, bounced recovering most of their losses.
EUR/USD is seen trading range bound around 1.1910 as the Euro steadied against the US dollar up from Thursday's two-week low of $1.18365. The dollar index measured against a basket of six major currencies fell 0.1 percent, following a 0.3 percent drop on Thursday and is currently valued at 92.13.
AUD/USD is net more or less unchanged on the session, the Aussie Dollar is currently seen trading at 0.7995 against the US dollar bound to a very small range. On the other hand, the NZD/USD is a few tics higher as the Kiwi is seen trading at around 0.7237 against the US Dollar, but similar to the Aussie, the gain is very limited.
Upcoming Events:
- 08:50 GMT – (GBP) MPC Member Vlieghe Speaks
- 12:30 GMT – (USD) Core Retail Sales m/m
- 12:30 GMT – (USD) Retail Sales m/m
- 12:30 GMT – (USD) Empire State Manufacturing Index
- 13:15 GMT – (USD) Capacity Utilization Rate
- 13:15 GMT – (USD) Industrial Production m/m
- 14:00 GMT – (USD) Prelim UoM Consumer Sentiment
Aussie Dollar Trading On A Weaker Footing This Morning
For the 24 hours to 23:00 GMT, the AUD rose 0.29% against the USD and closed at 0.8008.
LME Copper prices declined 1.7% or $108.5/MT to $6418.5/MT. Aluminium prices declined 0.9% or $18.0/MT to $2065.0/MT.
In the Asian session, at GMT0300, the pair is trading at 0.7992, with the AUD trading 0.2% lower against the USD from yesterday’s close.
The pair is expected to find support at 0.7985, and a fall through could take it to the next support level of 0.7979. The pair is expected to find its first resistance at 0.8004, and a rise through could take it to the next resistance level of 0.8017.
Next week, investors will await comments from the Reserve Bank of Australia’s (RBA) Governor, Philip Lowe as well as the latest RBA meeting minutes.
The currency pair is trading below its 20 Hr and 50 Hr moving average

Euro Trading On A Stronger Footing In The Asian Session
For the 24 hours to 23:00 GMT, the EUR slightly rose against the USD and closed at 1.1894.
The greenback lost ground against its key peers, after North Korea issued an explicit threat to the US, stating that it will use nuclear weapons to reduce US to “ashes and darkness” for leading the latest UN Security Council sanctions imposed on the country.
Earlier in the session, the US Dollar advanced, after a larger-than-expected rise in US inflation reignited hopes of another Federal Reserve interest rate hike in December.
Data indicated that the consumer price index (CPI) in the US advanced more-than-expected by 0.4% on a monthly basis in August, accelerating to a seven-month high level, suggesting that the recent weakness in inflation was temporary and that the US central bank would tighten monetary policy before the year-end. The CPI had recorded an advance of 0.1% in the prior month, while markets were anticipating for a gain of 0.3%. Additionally, on an annual basis, the nation’s CPI jumped more-than-anticipated by 1.9% on an annual basis in August, compared to an increase of 1.7% in the prior month. Market participants had envisaged the CPI to rise 1.8%.
In other economic news, first time claims for the US unemployment benefits unexpectedly fell to a level of 284.0K in the week ended 09 September, defying market consensus for an advance to a level of 300.0K, thus highlighting that the trend of a tightening labour market continues. Initial jobless claims had registered a reading of 298.0K in the prior week.
In the Asian session, at GMT0300, the pair is trading at 1.1913, with the EUR trading 0.16% higher against the USD from yesterday’s close.
The pair is expected to find support at 1.1880, and a fall through could take it to the next support level of 1.1847. The pair is expected to find its first resistance at 1.1932, and a rise through could take it to the next resistance level of 1.1951.
Moving ahead, investors will look forward to the Euro-zone’s trade balance figures for July, slated to release in a few hours. Moreover, the US advance retail sales, industrial as well as manufacturing production data, all for August, followed by the nation’s flash Michigan consumer confidence index for September, due to release later in the day, will keep investors on their toes.
The currency pair is trading above its 20 Hr moving average and showing convergence with its 50 Hr moving average.
