Sample Category Title
EUR/USD Extends The Sell-Off
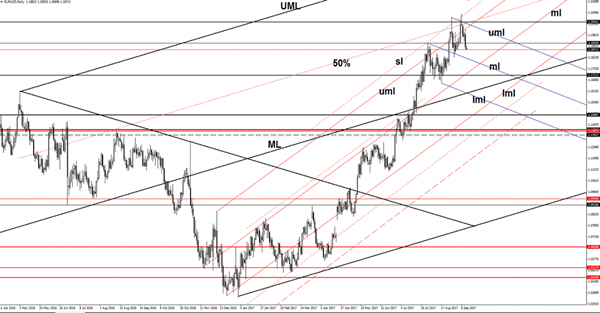
EUR/USD has finally started another leg lower on the Daily chart. Is trading in the red and should hit fresh new lows in the upcoming period. The net downside target will be at the median line (ml) of the minor descending pitchfork, could be attracted by the confluence area formed at the intersection between the median lines (ml).
EUR/GBP Attracted By A Confluence Area
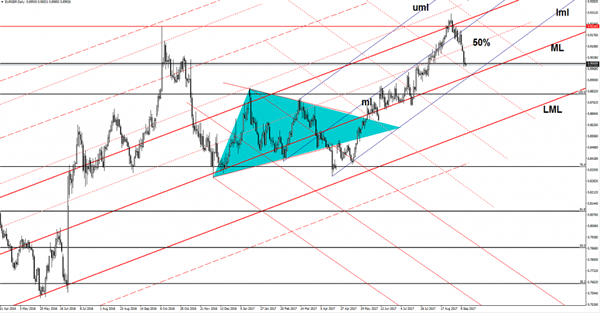
EUR/GBP changed little in the Asian session, but most likely we’ll have a significant move in the upcoming hours as the fundamental factors will take the lead again. Price is pressuring the 0.9000 psychological level, could still be attracted by the confluence area formed at the intersection between the lower median line (lml) and with the median line (ML) of the ascending pitchfork.
GBP/USD Is This Really The End?
The GBP/USD has dropped sharply in the yesterday's trading session and seems poised to start a corrective phase. Price is going down as the USD has managed to increase after the USDX's rebound. The pair is trading in the red on the short term and could hit fresh new lows in the upcoming hours if the United States data will come in line with expectations or better in the afternoon. Technically, a retreat is natural after the failure to close above a dynamic resistance.
We may have some volatility later after the UK and the US data will be sent to the public, the BOE is to release the Official Bank Rate, which is expected to remain steady at 0.25%, while the Asset Purchase Facility shouldn't suffer any change.
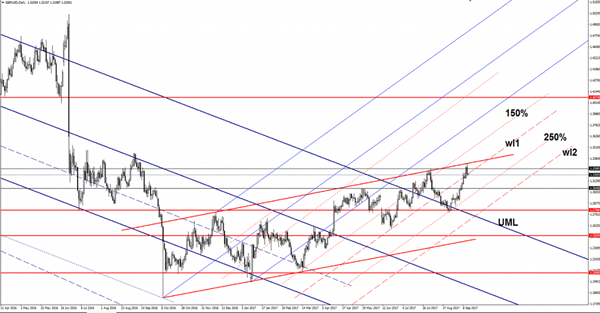
Price continues to be trapped within the ascending channel's body, has retested the upside line and now could drop again. Technically, it could drop again after another failure to close above the red up sloping line. Now is pressuring the warning line (wl1) of the ascending pitchfork, a valid breakdown will confirm a further drop. The next downside targets will be at the 1.3046 level, actually could be attracted by the confluence area formed between the 250% Fibonacci line with the 1.3046 horizontal obstacle.
Is premature to talk about a broader drop because is located above some important support levels, only a breakdown below the 250% Fibonacci line will confirm a larger decrease.
Increased Focus On Tax Reform And Upbeat CPI Expectations Keep U.S. Dollar Up For The Third Day In A...
Another Positive Day for The Greenback. US dollar was able to stay in the green for another day as most market watchers focus on U.S. CPI data due later on Thursday by the U.S. Federal Reserve as it considers when to next raise interest rates. The market focus has also shifted to President Trump’s tax-reform plan, which helped to rejuvenate appetite for the US dollar and riskier assets.
Dollar Holds Near 4-week High vs Yen. The dollar held steady near a four-week high against the yen on Thursday, with traders looking to U.S. consumer inflation data later in the day for clues on the possible timing of the Federal Reserve’s next rate rise. The dollar last stood at 110.59 yen, trading within sight of its highest level since Aug. 16 of 110.69 yen.
Sterling Steady Before BoE Monetary Policy Decision. Sterling held steady at $1.3211 after setting a one-year high of $1.3329 On Wednesday, as investors took profits before the Bank of England policy decision and the Swiss National Bank due later on Thursday.
Crude Oil Chalks Up More Gains. Crude oil prices surged over 2% as the International Energy Agency (IEA) noted that the combination of the output drop from the OPEC and the expected pickup in global demand could keep crude oil prices supported and rebalance inventories. The rebound in the oil price over the last few days also reflects expectations of resumed demand from Major Gulf Coast restarted operating refineries after they were shut down due to Hurricane Harvey.
Watch Out Today for:
07:30 am GMT: CHF SNB Interest Rate Decision
11:00 am GMT: GBP BoE Interest Rate Decision
12:30 pm GMT: USD Consumer Price Index
Elliott Wave View: DXY Dollar Index Zigzag Correction
DXY Dollar Index Short Term Elliott Wave view suggests that the Index ended Primary wave ((3)) at 91.01 and currently in a Primary wave ((4)) bounce. Internal of Primary wave ((4)) is unfolding as a zigzag Elliott wave structure. Preferred view suggests rally to 92.01 completed Intermediate wave (A) and dip to 91.71 ended Intermediate wave (B) as an expanded Elliott wave FLAT. Expect the Index to continue higher towards 92.71 – 92.95 area to complete Primary wave ((4)). Afterwards, the Index should resume the decline lower or at least pullback in 3 waves. We don’t like buying the Dollar Index. Expect sellers to appear at 92.71 – 93.33 area for a 3 waves reaction lower at least. If the rally in the Dollar Index extends beyond 93.33 (1.168 extension), the move from 9/8 low could unfold as impulse instead.
DXY 1 Hour Elliott Wave Chart
Ending Diagonal is an Elliott wave structure that typically happens inside wave 5 of an impulse or inside wave C of a zigzag. Ending Diagonal has 5 waves subdivision and each wave is further subdivided into 3 waves. Thus Ending Diagonal has the structure of 3-3-3-3-3. When Ending Diagonal happens within wave 5, the internal wave 1 of 5 and wave 4 of 5 can overlap. The Ending diagonal also often forms a wedge shape.
Currencies: EUR/USD And USD/JPY Are Near First Technically Relevant Levels
Sunrise Market Commentary
- Rates: End of uptrend US Treasuries since start Summer?
The US Note future dropped below first technical support levels, suggesting an end to the uptrend which started at the start of July. US CPI will be published today and have the possibility to seal the deal. The market implied probability of a December Fed rate hike increased this week from 35% to 45%. - Currencies: EUR/USD and USD/JPY are near first technically relevant levels
The dollar succeeded a new up-leg yesterday even as (US) data were mixed, at best. EUR/USD (1.1823) and USD/JPY 110.67/95 are near first important technical support/resistance. The US CPI report might help to decide on break. The BoE meets today. A hawkish BoE statement might support the recent rebound of sterling
The Sunrise Headlines
- Three main US equity indices gained up to 0.2% yesterday, succeeding a simultaneous second straight all-time closing high. Asian stock markets are mixed overnight with Japan and China slightly underperforming.
- Paul Ryan, the top Republican in Congress, has sought to quell discontent in his own party over a lack of a concrete proposals on tax reform —legislative priority — by promising to unveil the outlines of a plan before the end of this month.
- US President Trump said he would stop a $1.3 bn China-backed bid for US-based chip maker Lattice Semiconductor, citing national-security risks. The order directed the companies to take all steps to drop the deal within 30 days.
- China posted its slowest growth in fixed-asset investment in nearly 18 years along with weaker-than-expected industrial output and retail sales, suggesting the economy may be starting to lose steam as lending costs rise.
- Australia's labor market has demonstrated renewed strength, recording substantial gains in full-time employment (+40.1k) in particular; but under-employment remains stubbornly high. AUD/USD rose back above 0.80
- ECB Praet renewed his call for a "steady hand" in conducting the ECB's ultra-easy monetary policy despite a positive growth outlook, striking a cautious note as the ECB prepares to decide whether and how to wind down its stimulus.
- Today's calendar contains US CPI inflation and weekly jobless claims. ECB Weidmann and Mersch are scheduled to speak. The Bank of England holds a policy meeting and Ireland taps the bond market
Currencies: EUR/USD And USD/JPY Are Near First Technically Relevant Levels
USD maintains a good bid going into US CPI
The risk rebound slowed yesterday. Initially this was also the case for the rise in core yields and in the dollar. Eco data were few (US PPI) and close to expectations. Later in the US, yields started a new up-leg and so did the dollar. USD short-covering apparently had still some way to go. A new campaign of the Trump administration to reduce taxes maybe added to the USD positive sentiment. Contrary to what was the case earlier this week, USD/EUR this time outperformed USD/JPY. EUR/USD finished the session at 1.1885. USD/JPY ended the day at 110.49
Overnight, Asian equities are trading mixed. China and Japan mostly show modest losses. Other regional indices trade with a slightly positive bias. USD/JPY sits in the 110.50 area, nearing 110.67/95 resistance. EUR/USD (1.1875) holds near the correction low. Chinese data, including retail sales, investment and production printed weaker than expected. The yuan trades again slightly softer against the dollar. Strong Australian labour data pushed AUD/USD back above the psychological 0.80 barrier, but the move loses momentum.
The EMU eco calendar is again thin. US August CPI takes centre stage. Headline inflation is expected to rise 0.3% M/M and 1.8% Y/Y. The rise should be energyrelated. Core inflation is expected to ease from 1.7% Y/Y to 1.6%. The picture for US inflation remains soft if confirmed. That said, yesterday, mediocre US PPI didn't prevent a further rise in US yields and in the dollar. If the BoE turns more hawkish on inflation, it might be slightly supportive for global core yields, with possible positive spill-over effects for the dollar. USD momentum clearly improved this week. USD/JPY and EUR/USD are near first technical significant resistance/support at respectively 110.67/95 and 1.1823. Is a break possible, with or without strong US data? Clearing these levels in a sustainable way would call of the USD negative momentum short-term.
Global context. The euro remained strong last week even as the ECB delayed communication on APP tapering till October and as Draghi kept a soft tone. Markets apparently took the view that ECB normalisation will come anyway. At the same time, the dollar lost further interest rate support as global uncertainty kept US yields on a downward trajectory.
Finally, the decline in US yields and of the dollar had gone far enough given recent US eco data, which remained fairly good. A technical correction occurred this week. The dollar in the first place needs an improvement in global sentiment and higher yields. US data might become noisy due to the impact of the hurricanes and can cloud the Fed's outlook and complicate a USD rebound. In this context, we want more confirmation that the recent bottoming out process in US yields and in the dollar might be the start of more sustained USD gains. We keep a close eye on how the test of first important technical levels turns out (cf supra). A break of EUR/USD below 1.1823 would open the way to the 1.1662 correction low. We remain cautious on a sustained further upside break in USD/JPY
EUR/USD off recent top, nears first support at 1.1823.
EUR/GBP
BoE raising its inflation alert might support sterling
UK labour data failed to clarify the interest rate debate. The discrepancy between activity and wage data persisted. The unemployment rate dropped to 4.3%, the lowest level since 1975 and employment growth remained strong, but wage growth didn't accelerate at all. At 2.1% Y/Y, real wages move further into negative territory. This combination leaves left the market wary on today's BoE assessment and blocked the recent rebound of sterling. EUR/GBP closed the session at 0.8998 (from 0.9009). Cable finished the day at 1.3211 (from 1.3283) on overall USD strength.
The BoE decides on monetary policy today. Recent developments placed Carney and Co for a dilemma. The Bank will have to incorporate higher inflation in its assessment. At the same time, real wages remain negative and might weigh on spending and growth further down the road. A rate hike today is unlikely, but the bank will probably warn that it can't ignore inflation. A 6-3 vote instead of a 7-2 vote is possible. If so, it might support a further sterling rebound.
From a technical point of view, EUR/GBP cleared 0.8854/80 resistance (top end June), opening the way for a protracted August rebound. The move was the result of euro strength. Simultaneously, UK price data were soft enough to keep the BoE side-lined. Recent price data amended this story. Medium term, we maintain a EUR/GBP buy-on-dips approach as we expect the combination of relative euro strength and sterling softness to persist. The 0.9415 ‘flash-crash spike' is the next target on the charts. However, we let the current correction do its job, e.g. to the technical support in the 0.88/89 area, before selling sterling versus the euro.
EUR/GBP holds near 0.90 pivot ahead of BoE policy decision
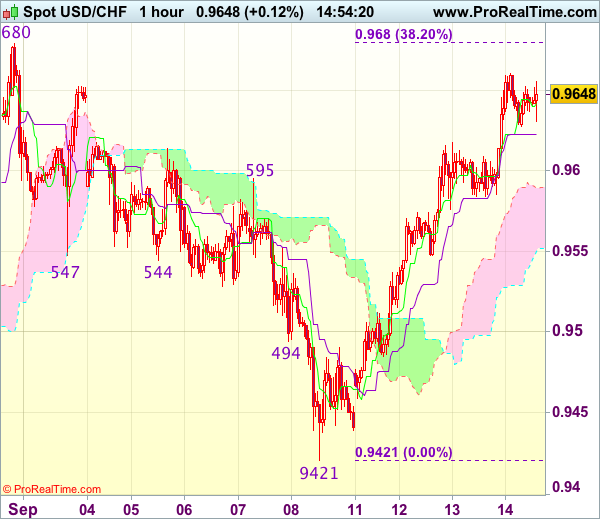
Trade Idea : USD/CHF – Sell at 0.9680
USD/CHF - 0.9650
Most recent candlesticks pattern : N/A
Trend : Near term up
Tenkan-Sen level : 0.9642
Kijun-Sen level : 0.9623
Ichimoku cloud top : 0.9589
Ichimoku cloud bottom : 0.9552
Original strategy :
Sell at 0.9680, Target: 0.9580, Stop: 0.9715
Position : -
Target : -
Stop : -
New strategy :
Sell at 0.9680, Target: 0.9580, Stop: 0.9715
Position : -
Target : -
Stop : -
Although the greenback has maintained a firm undertone after yesterday’s rise in NY and near term upside risk remains for the rally from 0.9421 low to bring retracement of early decline, overbought condition should limit upside to 0.9680 (previous resistance as well as 38.2% Fibonacci retracement of 1.0100-0.9421) and bring retreat later , below the 0.9605-10 would bring test of support at 0.9584 (yesterday’s low) but reckon downside would be limited to 0.9540-45 and 0.9515-20 should hold, bring another upmove later.
In view of this, we are inclined to turn short on further subsequent rise. Above 0.9698-99 resistance would extend gain to 0.9725-30 but still reckon upside would be limited and 0.9761-66 (50% Fibonacci retracement of 1.0100-0.9421 and previous resistance) should hold, risk remains for another retreat to take place soon.
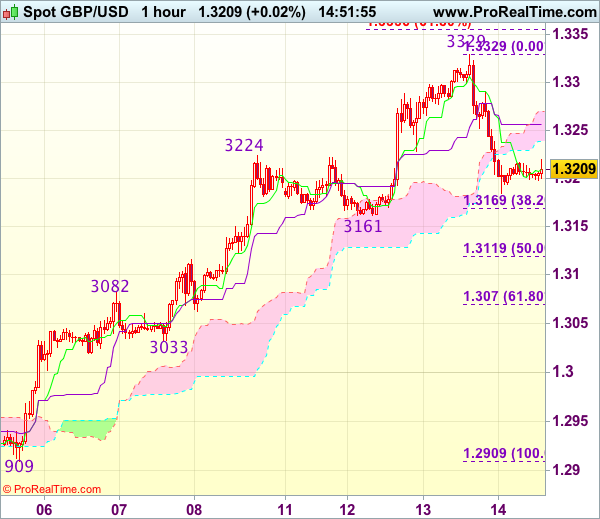
Trade Idea : GBP/USD – Sell at 1.3285 or Buy at 1.3140
GBP/USD - 1.3209
Most recent candlesticks pattern : N/A
Trend : Near term up
Tenkan-Sen level : 1.3209
Kijun-Sen level : 1.3257
Ichimoku cloud top : 1.3269
Ichimoku cloud bottom : 1.3238
Original strategy :
Sell at 1.3285, Target: 1.3185, Stop: 1.3320
O.C.O.
Buy at 1.3160, Target: 1.3260, Stop: 1.3125
Position : -
Target : -
Stop : -
New strategy :
Sell at 1.3285, Target: 1.3185, Stop: 1.3320
O.C.O.
Buy at 1.3140, Target: 1.3250, Stop: 1.3105
Position : -
Target : -
Stop : -
As cable has remained under near term pressure, adding credence to our view that a temporary top has been formed at 1.3329 yesterday, hence consolidation with downside bias is seen for correction to 1.3180-85, then towards support at 1.3161, however, near term oversold condition should limit downside to 1.3130-35 and bring recovery later to the Kijun-Sen (now at 1.3257) and then towards resistance at 1.3290 but price should falter well below said resistance at 1.3329, bring another corrective decline later.
In view of this, whilst we are still looking to buy cable on further corrective fall, we would sell sterling on recovery as said resistance at 1.3290 should cap upside, bring another corrective decline later. Only break of said resistance at 1.3329 would abort and signal recent upmove is still in progress for headway to 1.3355-60 (61.8% projection of 1.2909-1.3224 measuring from 1.3161).
Daily Technical Outlook And Review: EUR/USD, GBP/USD, AUD/USD, USD/JPY, USD/CAD, USD/CHF, DOW 30, GOLD
A note on lower timeframe confirming price action...
Waiting for lower timeframe confirmation is our main tool to confirm strength within higher timeframe zones, and has really been the key to our trading success. It takes a little time to understand the subtle nuances, however, as each trade is never the same, but once you master the rhythm so to speak, you will be saved from countless unnecessary losing trades. The following is a list of what we look for:
- A break/retest of supply or demand dependent on which way you're trading.
- A trendline break/retest.
- Buying/selling tails ... essentially we look for a cluster of very obvious spikes off of lower timeframe support and resistance levels within the higher timeframe zone.
- Candlestick patterns. We tend to only stick with pin bars and engulfing bars as these have proven to be the most effective.
We typically search for lower-timeframe confirmation between the M15 and H1 timeframes, since most of our higher-timeframe areas begin with the H4. Stops are usually placed 1-3 pips beyond confirming structures.
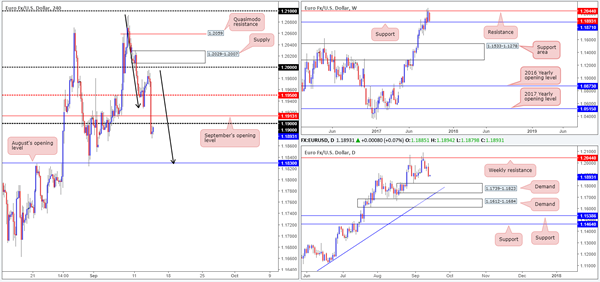
EUR/USD
Across the board, the US dollar rallied against the majority of its trading peers on Wednesday amid tax reform talks, consequently pushing the single currency south. After crushing the 1.19 handle, the pair ended the day bottoming around the 1.1873 mark.
With yesterday's aggressive slide, technical traders are likely watching for September's opening level at 1.1913/1.19 handle to hold firm as resistance. Should this come to fruition, all eyes will likely then be on August's opening line at 1.1830, which happens to not only be positioned a few pips above daily demand at 1.1739-1.1823, it also converges with a H4 AB=CD bullish formation (see black arrows). However, for price to sell off and reach 1.1830, weekly support at 1.1871 would need to be weakened.
Suggestions: We feel the best thing to do right now is be patient. It would, in our technical view, be unwise to attempt a sell at 1.1913/1.19 when weekly price is so near to support. Should price push lower and challenge 1.1830, however, then great, we have a high-probability buy zone to trade. If not, we could see the unit extend back up to the mid-level point 1.1950 or quite possibly the large number 1.20.
Data points to consider: US Inflation figures and US Unemployment claims at 1.30pm GMT+1.
Levels to watch/live orders:
- Buys: 1.1830 region ([waiting for a H4 bullish candle to form – preferably in the shape of a full, or near full-bodied candle – is advised] stop loss: ideally beyond the candle's tail).
- Sells: Flat (stop loss: N/A).
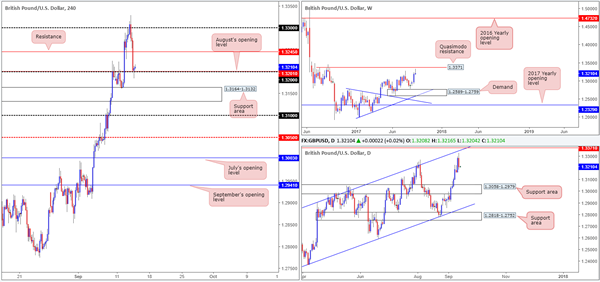
GBP/USD:
Disappointing UK employment data (+2.1% versus +2.3% expected) sent the British pound lower in early trading on Wednesday. This – coupled with a robust dollar eventually saw the pair challenge the 1.32 handle going into the closing bell. Meanwhile, over on the bigger picture, weekly price found a ceiling around 1.3328 ahead of the Quasimodo resistance level at 1.3371. Similarly, down on the daily chart price turned ahead of the channel resistance extended from the high 1.2903.
Suggestions: With cable supported by 1.32 right now, it's possible the unit will look to retest H4 resistance at 1.3245 today. This level has a high probability of bouncing price as it is effectively an ignored Quasimodo line. Be that as it may, we believe this is still a somewhat risky short for two reasons. Firstly, higher-timeframe action may look to push higher to connect with the said resistances. Secondly, we do not see much additional confirmation around the 1.3245 area. Well, not enough for us to place capital on the line anyway!
So, with the above notes in mind, we will remain flat for now.
Data points to consider: BoE takes the stage at 12pm. US Inflation figures and US Unemployment claims at 1.30pm GMT+1.
Levels to watch/live orders:
- Buys: Flat (stop loss: N/A).
- Sells: Flat (stop loss: N/A).
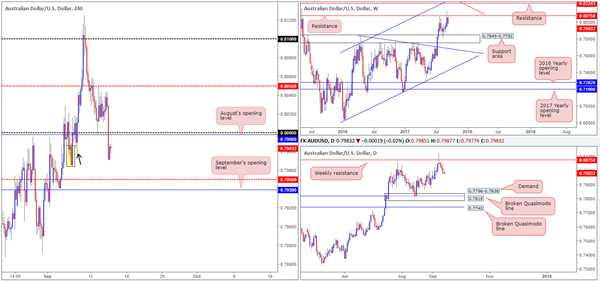
AUD/USD
In recent trading, the commodity currency stormed through the key 0.80 handle/August's opening level at 0.7998. The move, influenced by US tax reform talks, saw the pair bottom at 0.7970.
For those who read Wednesday's report you may recall us highlighting possible shorting opportunities should a decisive H4 close be seen beyond 0.80. This is due to a couple of reasons:
Weekly price currently trading from resistance at 0.8075, which shows room to extend as far down as the support area pegged at 0.7849-0.7752.
Beyond 0.80, we believe the pair could end up trading as low as September's opening level at 0.7939. This is simply because there's a high probability that the H4 demand painted in yellow at 0.7965-0.7988 has already had its orders taken by the H4 tail seen marked with a black arrow at 0.7974.
Suggestions: A retest of 0.80, coupled with a H4 bearish candle (preferably in the form of a full, or near-full-bodied candle) would, in our view, be enough to warrant an intraday sell down to at least the 0.7950 neighborhood.
Data points to consider: Australian Employment figures at 2.30am, Chinese Industrial production at 3am. US Inflation figures and US Unemployment claims at 1.30pm GMT+1.
Levels to watch/live orders:
- Buys: Flat (stop loss: N/A).
- Sells: 0.80 region ([waiting for a H4 bearish candle to form – preferably in the shape of a full, or near full-bodied candle – is advised] stop loss: ideally beyond the candle's wick).
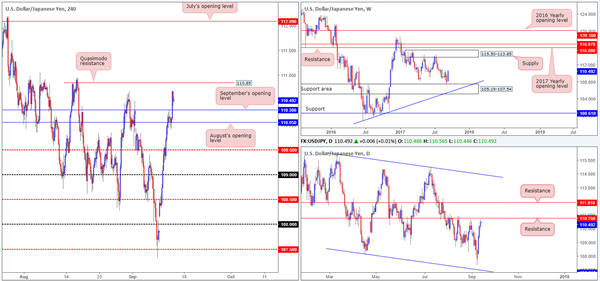
USD/JPY
Propelled by recent US tax reform talks, the USD/JPY ripped through offers positioned at September's opening level drawn from 110.30. As you can see, this has opened up the path north for the H4 candles to test the Quasimodo resistance at 110.85. Also of particular interest, daily price is now trading within touching distance of resistance registered at 110.76. On the other side of the coin, however, weekly price is seen rallying from a support area penciled in at 105.19-107.54.
Suggestions: Watch the H4 Quasimodo resistance at 110.85 for a potential sell trade. We like this level because it sits just above daily resistance at 110.76. However, in view of weekly bulls trading from a support area, additional candle confirmation would be required before a trade can be initiated from here. Should this come to realization, we would likely be looking to trail the position down to 110.30 as an initial take-profit zone.
Data points to consider: US Inflation figures and US Unemployment claims at 1.30pm GMT+1.
Levels to watch/live orders:
- Buys: Flat (stop loss: N/A).
- Sells: 110.85 region ([waiting for a H4 bearish candle to form – preferably in the shape of a full, or near full-bodied candle – is advised] stop loss: ideally beyond the candle's wick).
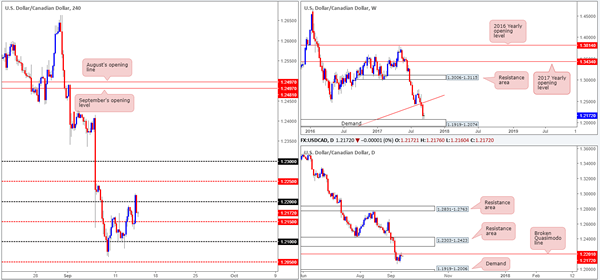
USD/CAD
On Wednesday, we set a pending sell order at 1.22 with a stop-loss order positioned 20 pips above at 1.2220. Our basis for the trade was not only the round number, but also a H4 38.2% Fib resistance at 1.22, a daily broken Quasimodo line at 1.2201 and a H4 AB=CD bearish formation topping at 1.22. Unfortunately, our stop was taken out at the pip before turning lower. It's frustrating, but this happens.
Although weekly price recently connected with demand printed at 1.1919-1.2074, we still have a bearish bias towards this market. Not only because of the current daily broken Quasimodo line mentioned above at 1.2201, but also because of the pair's strong downtrend since May.
Suggestions: To become sellers, a H4 close beyond the mid-level support at 1.2150 is required. To our way of seeing things, this will help confirm bull weakness at the current weekly demand, and at the same time demonstrate bearish intent from the daily broken Quasimodo resistance. A retest at 1.2150, coupled with a lower-timeframe sell signal (see the top of this report), would be sufficient enough to trade short, targeting 1.21 as an INITIAL take-profit zone.
Data points to consider: US Inflation figures and US Unemployment claims at 1.30pm GMT+1.
Levels to watch/live orders:
- Buys: Flat (stop loss: N/A).
- Sells: Watch for H4 price to engulf 1.2150 and then look to trade any retest seen thereafter ([waiting for a lower-timeframe sell signal to form following the retest is advised] stop loss: dependent on where one confirms this level).
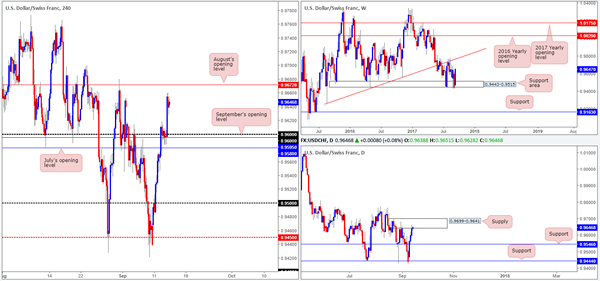
USD/CHF:
After finding support at September's opening level/0.96 handle at 0.9595/0.96 on Wednesday, the safe-haven pair extended gains to a high of 0.9659 on tax reform news. Filling the prior week's weekend gap, the H4 chart shows price now trading within a few pips of August's opening line at 0.9672. From a technical perspective, this week's advance has largely been due to the weekly support area coming in at 0.9443-0.9515. However, with daily supply at 0.9699-0.9641 now in the fight, a bearish presence may come into view.
Suggestions: Initial thinking brings us to August's opening level for possible selling opportunities, given that it is fixed within the aforementioned daily supply. There are, however, a few cautionary points to consider:
Weekly buying pressure seen from the current support area.
The daily supply may be weak due to it having already been tested.
There is little H4 confluence seen around August's opening level.
While August's opening level may very well hold price lower today, we feel it is just too much of a risk at the moment.
Data points to consider: US Inflation figures and US Unemployment claims at 1.30pm. SNB Interest-rate statement at 8.30am GMT+1.
Levels to watch/live orders:
- Buys: Flat (stop loss: N/A).
- Sells: Flat (stop loss: N/A).
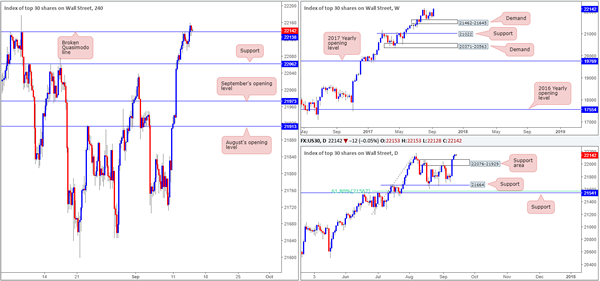
DOW 30
The DOW, as you can see on the H4 chart, edged its way above the Quasimodo resistance at 22138 on Wednesday and has maintained a bullish footing. As highlighted in yesterday's report, we believe this H4 barrier was the last remaining resistance stopping the index from achieving fresh record highs. So, with this line out of the picture and currently holding as a support, a long from here is high probability, in our opinion.
Suggestions: Keeping it nice and simply today, we're going to watch how H4 action responds at 22138 given that it is now support. To become a buyer, a H4 bullish candle needs to be seen, preferably in the shape of a full, or near-full-bodied candle. The beautiful thing about this setup is that there is effectively no clear take-profit target, meaning that we could potentially join, what seems to be, the never-ending bull run.
Data points to consider: US Inflation figures and US Unemployment claims at 1.30pm GMT+1.
Levels to watch/live orders:
- Buys: 22138 region ([waiting for a reasonably sized H4 bullish candle to form – preferably a full, or near-full-bodied candle – is advised] stop loss: ideally beyond the candle's tail).
- Sells: Flat (stop loss: N/A).
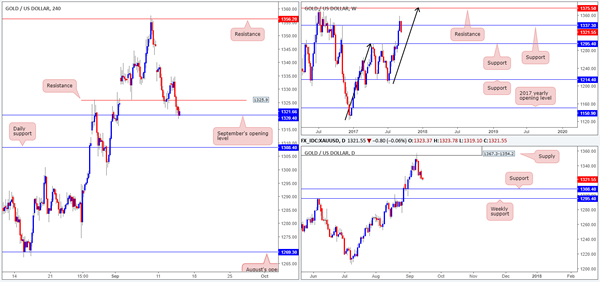
GOLD
The yellow metal, as you can see, failed to sustain Tuesday's gains on Wednesday. After topping at 1334.5, the unit headed south on strong dollar buying due to recent news on a US tax reform. H4 flow ran through bids at support drawn from 1325.9 and went on to challenge September's opening level coming in at 1320.4.
While there is absolutely no higher-timeframe support structures in view at the moment (the closest is daily support logged at 1308.4), the odds of a push lower is strong, right? While there is a chance that gold could push lower, it might be worth noting that the USDX weekly chart shows price trading around resistance at 11854. For those who do not know, there exists an inverse correlation between these two markets. Therefore, should US weekly candles hold firm at resistance and push lower, this could see the metal bid higher.
Suggestions: With the above notes taken on board, we feel it's too much of a risk to buy at this point. Nevertheless, a H4 close back above the H4 resistance at 1325.9 would, for us at least, confirm upside strength. And as such, this could be used as an entry trigger to long gold given the position of US weekly price at the moment.
Levels to watch/live orders:
- Buys: Watch for H4 price to engulf 1325.9 and then look to trade any retest seen thereafter (stop loss: ideally beyond the rejection candle's tail).
- Sells: Flat (stop loss: N/A).
Daily Technical Analysis: USD/JPY Bullish Momentum Faces Strong 111 Resistance Zone
Currency pair USD/JPY
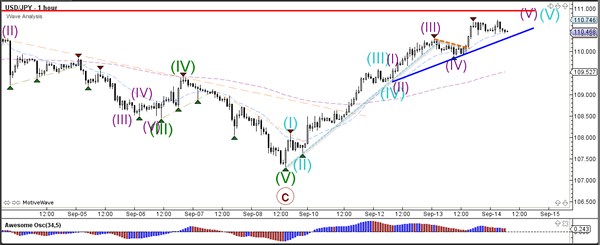
The USD/JPY bullish momentum broke above the resistance trend line (dotted brown) but price has a strong horizontal resistance level nearby (red). Price seems to be building 5 (blue) bullish waves within wave 1 or wave A.
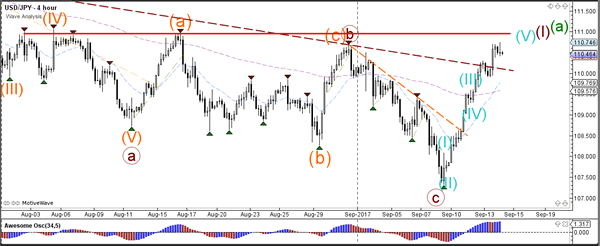
The USD/JPY is showing strong bullish momentum and is building 5 extended waves (purple). A break below support could indicate the start of a bearish correction.
Currency pair EUR/USD
The EUR/USD broke below the support trend line (dotted blue) and extended the bearish price action. The wave structure is most likely indicating a wave C (red) within a larger wave 4 (blue). The Fibonacci levels of wave C vs A are most likely bouncing spots for further upside.
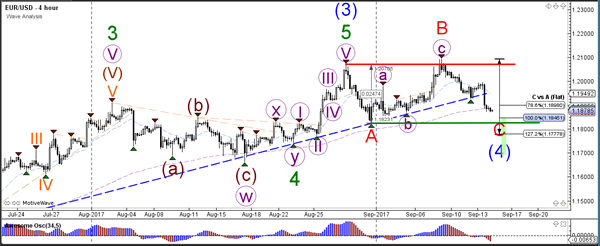
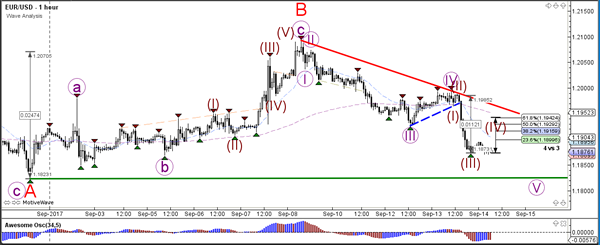
The EUR/USD broke below the minor support (dotted blue) and price is building 5 internal waves (brown) within wave 5 (purple). Price could bounce at the previous bottom (green line) of wave A for instance. A break of resistance (red) could indicate the start of a new uptrend.
Currency pair GBP/USD
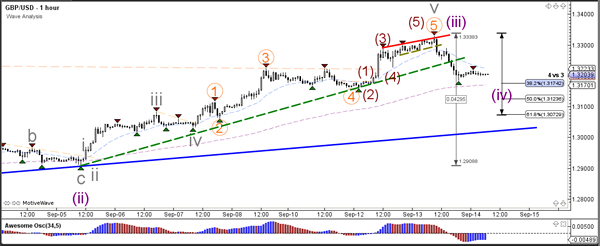
The GBP/USD broke below the support trend line (dotted green) and completed the 3rd wave (purple). Price could now be in a potential wave 4 (purple) retracement which could bounce at the Fibonacci levels of wave 4 vs 3.
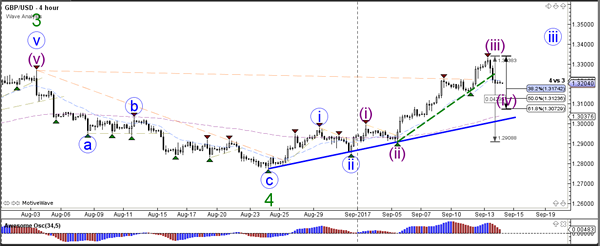
The GBP/USD did indeed complete multiple waves 5 at around 1.33. The retracement has broken below multiple support levels (dotted green) and is now testing the Fibonacci levels.