Sample Category Title
Trade Idea Wrap-up: EUR/USD – Stand aside
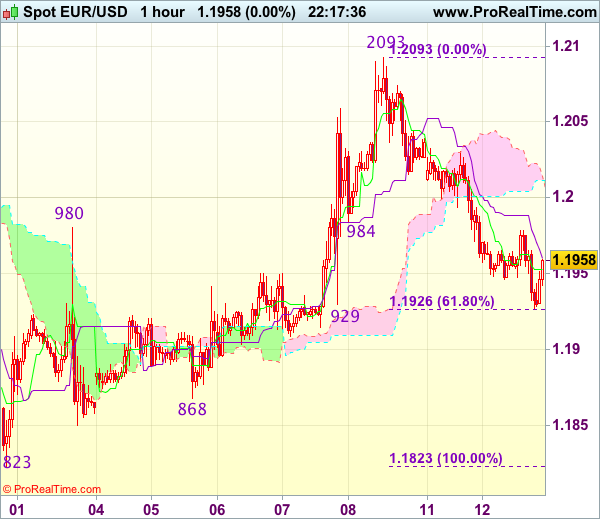
EUR/USD - 1.1954
Most recent candlesticks pattern : N/A
Trend : Up
Tenkan-Sen level : 1.1952
Kijun-Sen level : 1.1960
Ichimoku cloud top : 1.2011
Ichimoku cloud bottom : 1.2006
New strategy :
Stand aside
Position : -
Target : -
Stop : -
As the single currency has fallen again after brief recovery, suggesting the decline from last week’s high of 1.2093 is still in progress for retracement of recent rise, hence weakness to 1.1900 cannot be rule out, however, loss of near term downward momentum should prevent sharp fall below previous support at 1.1868 and price should stay well above another previous support at 1.1823, bring rebound later.
In view of this, would not chase this fall here and would be prudent to stand aside in the meantime. Above resistance at 1.1978 would bring recovery to 1.2000, however, reckon upside would be limited to resistance at 1.2030, bring another decline.
Trade Idea Wrap-up: USD/JPY – Buy at 109.00
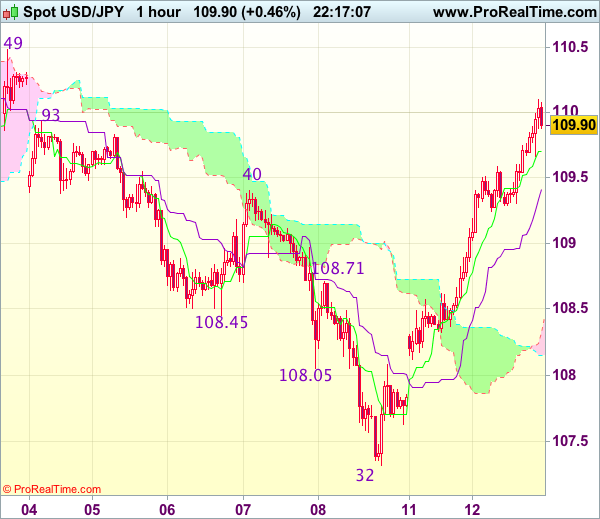
USD/JPY - 109.85
Most recent candlesticks pattern : N/A
Trend : Down
Tenkan-Sen level : 109.70
Kijun-Sen level : 109.41
Ichimoku cloud top : 108.32
Ichimoku cloud bottom : 108.14
Original strategy :
Buy at 109.30, Target: 110.30, Stop: 108.95
Position : -
Target : -
Stop : -
New strategy :
Buy at 109.00, Target: 110.20, Stop: 108.65
Position : -
Target : -
Stop : -
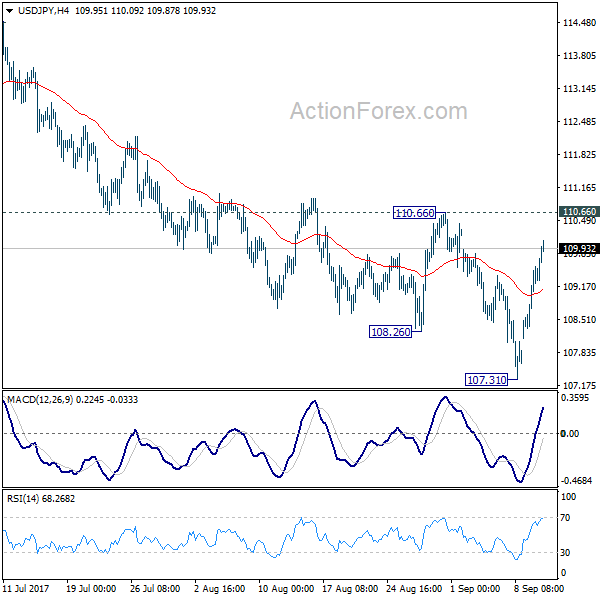
As the greenback has surged again today after brief pullback, dampening our bearishness and suggesting the rise from 107.32 low is still in progress, hence further gain towards resistance at 110.49 would be seen, however, near term overbought condition should limit upside to resistance at 110.67, risk from there has increased for a retreat to take place soon.
In view of this, would not chase this rise here and would be prudent to buy dollar on subsequent pullback as 109.00 should limit downside. Below 108.70 would defer and risk correction to 108.50 but still reckon downside would be limited to 108.30-35 and bring another rally later.
Sterling Rebound Accelerates as Inflations Jumps Higher
- European equity indices show gains of approximately 0.5% as the risk rally continues. The FTSE 100 underperforms as the strengthening of sterling weighs. US equities also start the session with modest gains.
- UK inflation is on the rise again, accelerating more than forecast in August after the biggest surge in clothes prices in almost three decades. The jump to 2.9% from 2.6% in July puts the spotlight squarely back on one of the most prominent economic repercussions of the Brexit vote in 2016.
- The 1% cap on pay rises for UK public sector workers is to be scrapped after the government agreed to a 1.7% annual pay rise for prison officers and an effective 2% rise for police officers for the current year.
- US NFIB small business optimism slightly increased from 105.2 to 105.3 in August, while consensus expected a small decline to 104.8. The outcome was too close to consensus to bother markets. The indicator remains near multiyear highs.
- OPEC crude oil production fell last month for the first time since April, in a boost to the cartel's beleaguered efforts to reduce output and rein in the global supply glut. The cartel has revised higher its global oil demand growth forecasts for this year and next as consumption in the second quarter of 2017 surpassed expectations.
- The German economy is set to grow by more than 2% this year adjusted for calendar effects, which would be the strongest rate in six years, the BDI industry association said as it lifted its growth forecast for Europe's biggest economy.
- Underlying inflation in Sweden hit the central bank's 2% target for the second straight month in August, supporting arguments that the time is right to start tightening monetary policy amid signs of an overheating economy. EUR/SEK declined from 9.59 towards 9.52.
Rates
Repositioning goes on
Global core bonds extended yesterday's decline, but the pace slowed. Risk sentiment on stock markets remained positive. Stronger than expected, but second tier, eco data (UK CPI, see FX, and US NFIB small business optimism) and EMU/US supply also weighed on core bonds. The confirmation of yesterday's technical breaks of US yields back above previous support levels (5-yr: 1.7%, 10-yr: 2.1%, 30-yr 2.68%) suggests that the downtrend since the start of the Summer is over and that we've entered a consolidation phase ahead of next week's FOMC meeting. Markets are still too dovish positioned according to us with US rate markets not even discounting a complete rate hike by the end of 2018.
At the time of writing, US yields increase by 1.2 bps (2-yr) to 2.8 bps (5-yr). Changes on the German yield curve vary between +1.7 bps (2-yr) and +3.6 bps (10-yr). On intra-EMU bond markets, 10-yr yield spread changes versus Germany narrow up to 3 bps.
The Dutch debt agency tapped the on the run 10-yr DSL (€2.2B 0.75% Jul2027). The amount sold was below the maximum targeted €3B, but that's almost every time the case at Dutch auctions. The treasury didn't disclose the bid cover. Austria launched two new bonds via syndication. A new 5-yr RAGB (Sep2022) was priced to yield MS -36 bps, tighter than guidance in the MS -35 bps area. Austria also managed to raise €1B with a centennial bond which drew in excess of €11B demand. The 100-yr RAGB printed at MS +50 bps, at the lower end of the MS+50/55 bps guidance. The US Treasury continues its refinancing operation tonight with a $20B 10-yr Note auction. The WI trades currently around 2.16%.
Currencies
Dollar extends rebound
Today, the risk rebound continued. Core yields rose further. The dollar remained the major beneficiary among the major currencies. USD/JPY outperformed and is testing the 110 barrier. The progress of the dollar against the euro remains more modest with EUR/USD trading in the 1.1940 area. There were few data to support the move, but that might change later this week with the US price data scheduled for release tomorrow and on Thursday.
The risk rebound continued in Asia this morning. Japanese equities outperformed on yesterday's decline of the yen. The dollar maintained yesterday's gains against the euro and the yen, but there was no additional progress yet. The UN security council approved a watered-down US proposal on additional sanctions against North Korea. Markets pondered the chances on a possible reaction of North Korea.
The risk rebound was also extended in Europe. There were no important data in EMU. Core German and US bond yields rose more or less in lockstep. If anything, German yields rose slightly more than US ones, but this was probably a simple catching up move on yesterday's rise in the US. Whatever, the dollar remained well bid across the board. EUR/USD hovered toward the lower barrier of the 1.1950/80 range. USD/JPY drifted higher to the 109.75 area.
The dollar comeback gained some additional momentum going into the start of the US session. The NFIB small business confidence rose slightly from 105.2 to 105.3. A limited setback to 104.8 was expected. The report was no major factor for trading, but it helped to sustain a positive sentiment both for the dollar and for risky assets. The Trump administration preparing a new campaign to win support for a substantial tax reduction was maybe also a minor USD supportive. However, for now, we consider current move in the first place an unwinding of 'excessive' USD shorts. EUR/USD trades currently in the 1.1940 area. USD/JPY is testing the 110 mark.
To conclude: the risk-on repositioning continued and the dollar still profits slightly more than the euro (and evidently also the yen). Tomorrow and on Thursday, the focus will shift to the US price data. Interesting to see whether they are good enough to reinforce the USD positive momentum.
Sterling rebound accelerates as inflations jumps higher
Of late, sterling succeeded a gradual but sustained rebound especially against the euro. There was no obvious driver. UK eco data were mixed of late. There was also very little progress in the Brexit negotiations. Today, the eco data came again in the spotlight. UK August inflation rose much more than expected from 2.6% Y/Y to 2.9%, matching the highest level in 5 year. The consensus expected a rise to 2.8%. Core inflation was also above consensus at 2.7% Y/Y. At the August policy meeting the BoE kept a wait-and-see bias even as it was aware that inflation could reach 3.0%. Even so, the current uptick will probably force the BoE to give more weight to inflation in its policy assessment, even as growth slows and as Brexit uncertainty persists. We don't expect the BoE already to change course on Thursday, but chances on a rate hike will rise of the August upward surprise will be confirmed further down the road. The sterling rebound accelerated after the CPI release. EUR/GBP dropped temporary below the 0.90 mark and trades currently around 0.9010. Cable set a minor new top at around 1.3288, even as the dollar was well bid across the board.
EUR/GBP Mid-Day Outlook
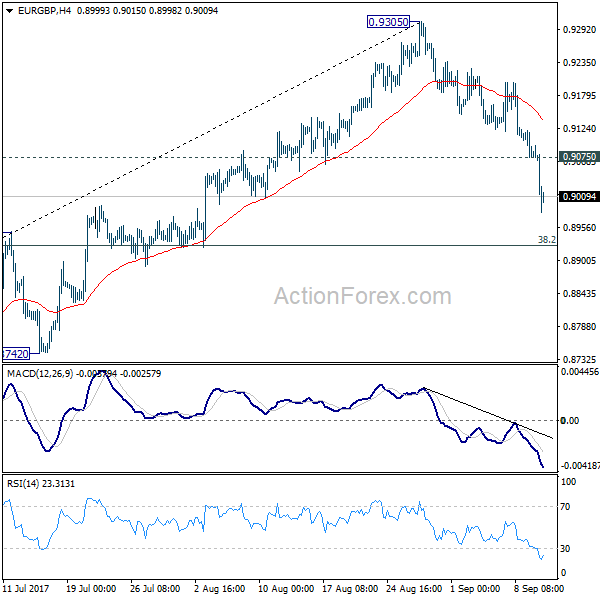
Daily Pivots: (S1) 0.9062; (P) 0.9091; (R1) 0.9108; More
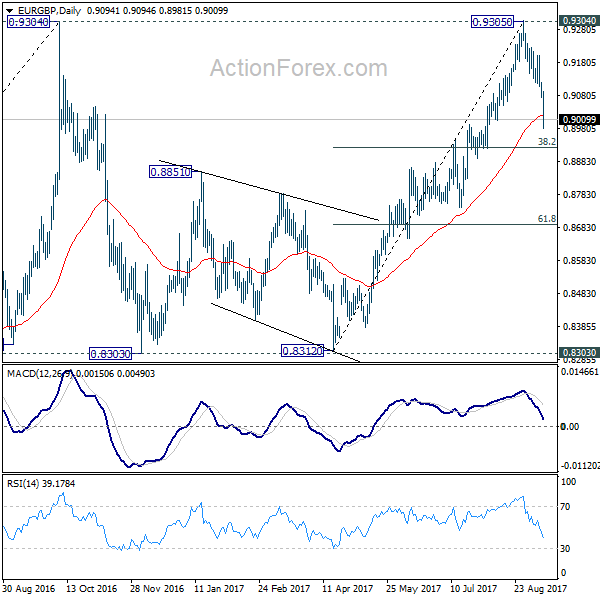
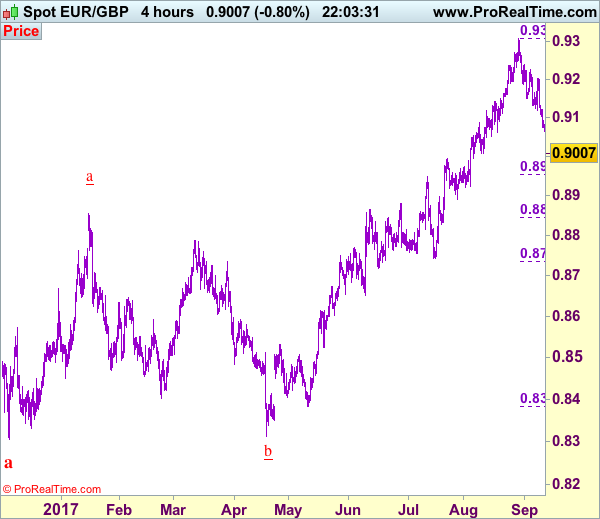
EUR/GBP's fall from 0.9305 short term top accelerates to as low as 0.8981 so far. Such decline is likely the third leg of the consolidation from 0.9304. Intraday bias remains on the downside for 38.2% retracement of 0.8312 to 0.9305 at 0.8926 first. Break will target 61.8% retracement at 8691 and below. On the upside, above 0.9075 minor resistance will turn intraday bias neutral first.
In the bigger picture, price actions from 0.9304 are viewed as a medium term corrective pattern. It's uncertain whether it is finished yet. But in case of another fall, we'd expect strong support from 0.8116 cluster support (50% retracement of 0.6935 to 0.9304 at 0.8120) to contain downside and bring rebound. Whole up trend from 0.6935 is expected to resume after consolidation from 0.9304 completes. Firm break of 0.9799 high will target 61.8% projection of 0.5680 to 0.9799 from 0.6935 at 1.1054.
GBP/JPY Mid-Day Outlook
Daily Pivots: (S1) 142.90; (P) 143.53; (R1) 144.60; More
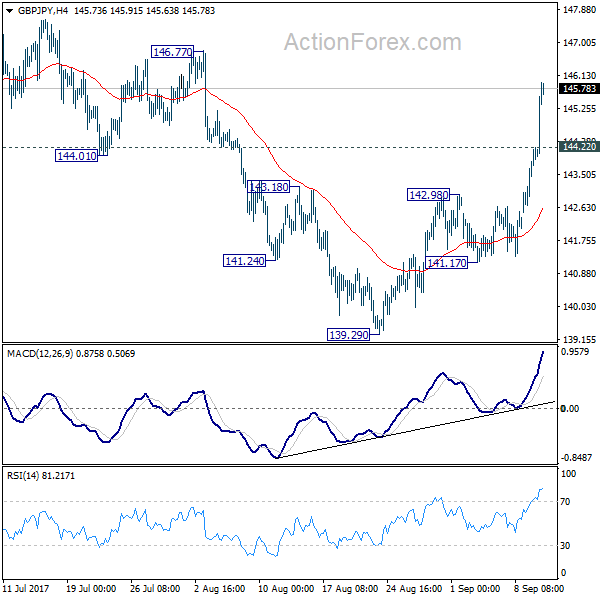
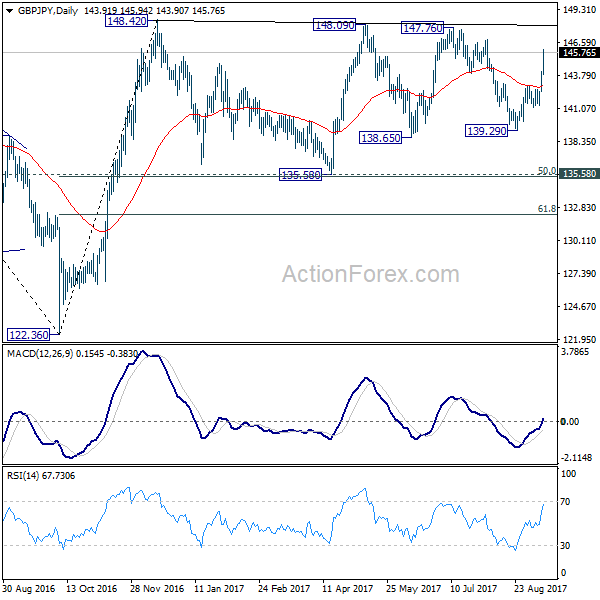
GBP/JPY surges to as high as 145.94 today and intraday bias remains on the upside. Current rise from 139.29 should target a test on 147.76/148.42 resistance zone. Decisive break there will confirm resumption of medium term rebound from 122.36. On the downside, below 144.22 minor support will turn intraday bias neutral first. Overall, for the moment, GBP/JPY is still bounded in sideway consolidation pattern from 148.42.
In the bigger picture, the sideway pattern from 148.42 is still unfolding. In case of deeper fall, we'd expect strong support from 135.58 and 50% retracement of 122.36 to 148.42 at 135.39 to contain downside. Medium term rise from 122.36 is expected to resume later. And break of 38.2% retracement of 196.85 to 122.36 at 150.43 will carry long term bullish implications. However, firm break of 135.58/39 will dampen the bullish view and turn focus back to 122.36 low.
EUR/USD Mid-Day Outlook
Daily Pivots: (S1) 1.1923; (P) 1.1976 (R1) 1.2005; More...
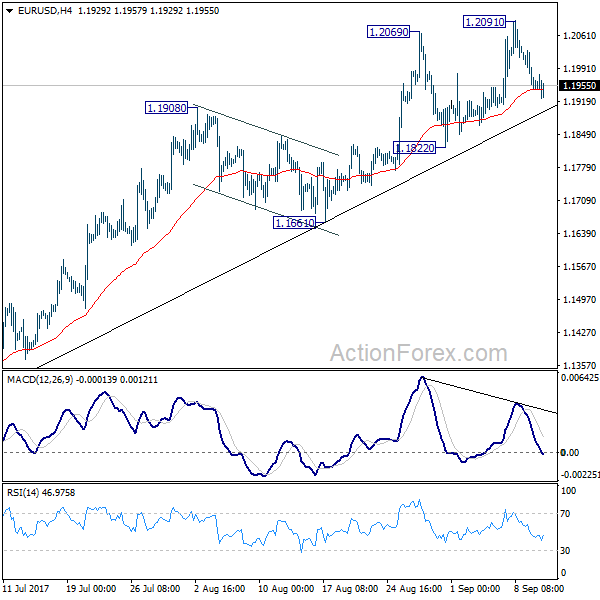
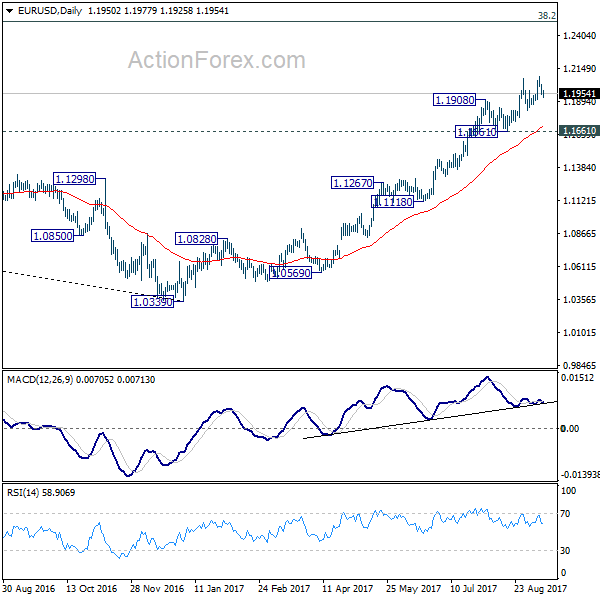
Intraday bias in EUR/USD remains neutral at this point. Overall, outlook remains bullish as long as 1.1822 support holds. Above 1.2091 will extend larger rise fro 1.0339 and target next key fibonacci level at 1.2516. But considering bearish divergence condition in 4 hour MACD, break of 1.1822 will confirm short term topping and bring deeper fall back to 1.1661 support and below.
In the bigger picture, rise from medium term bottom at 1.0339 is still in progress for 38.2% retracement of 1.6039 (2008 high) to 1.0339 (2017 low) at 1.2516. However, it should be noted that there is no confirmation of trend reversal yet. That is, such rebound from 1.0399 could be a correction. And the long term fall fro 1.6039 (2008 high) could resume. Hence, we'd be cautious on strong resistance from 1.2516 to limit upside. But after all, break of 1.1661 is needed to indicate medium term topping. Otherwise, outlook will remain bullish in case of pull back.
Trade Idea: EUR/GBP – Sell at 0.9065
EUR/GBP - 0.9011
Original strategy :
Sell at 0.9130, Target: 0.9000, Stop: 0.9170
Position : -
Target : -
Stop : -
New strategy :
Sell at 0.9065, Target: 0.8955, Stop: 0.9105
Position : -
Target : -
Stop : -
As euro’s decline has accelerated today, adding credence to our view that top has been formed at 0.9307 and bearishness remains for the fall from there to bring retracement of recent upmove, hence downside bias remains for further weakness to 0.8950-55 (38.2% Fibonacci retracement of 0.8384-0.9307), below there would extend weakness to 0.8920-25 but reckon near term oversold condition would limit downside and 0.8890-00 would hold from here.
In view of this, would not chase this fall here and we are looking to sell euro on recovery as 0.9065-70 should limit upside Above 0.9100 would defer and bring a stronger rebound to 0.9135-40, however, still reckon upside would be limited to 0.9170 and resistance at 0.9203 should remain intact, bring another decline later.
Our preferred count is that, after forming a major top at 0.9805 (wave V), (A)-(B)-(C) correction is unfolding with (A) leg ended at 0.8400 (A: 0.8637, B: 0.9491 and 5-waver C ended at 0.8400. Wave (B) has ended at 0.9413 and impulsive wave (C) has either ended at 0.8067 or may extend one more fall to 0.8000 before prospect of another rally. Current breach of indicated resistance at 0.9043 confirms our view that the (C) leg has ended and bring stronger rebound towards 0.9150/54, then towards 0.9240/50.
USD/CHF Mid-Day Outlook
Daily Pivots: (S1) 0.9491; (P) 0.9529; (R1) 0.9603; More....
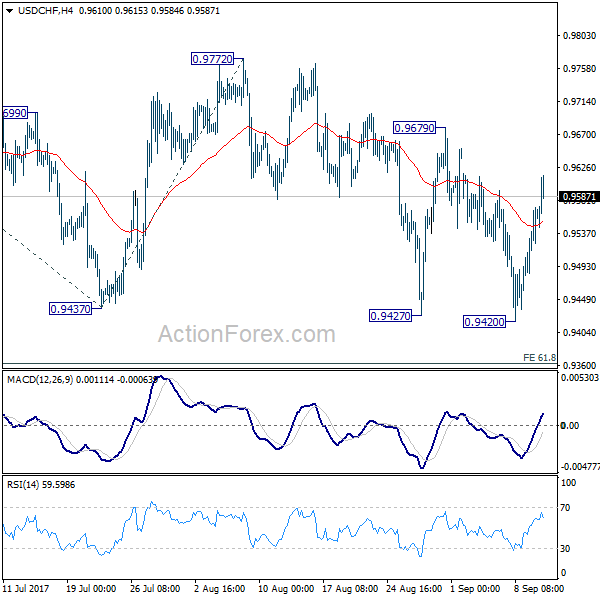
With 0.9679 resistance intact, outlook stays bearish even though rebound from 0.9420 is strong. Another fall is still expected. Sustained break of 0.9420 will target 61.8% projection of 1.0099 to 0.9437 from 0.9772 at 0.9363 first. Break will target 100% projection at 0.9110 next. However, break of 0.9679 will indicate near term reversal and turn bias to the upside for 0.9772 resistance for confirmation.
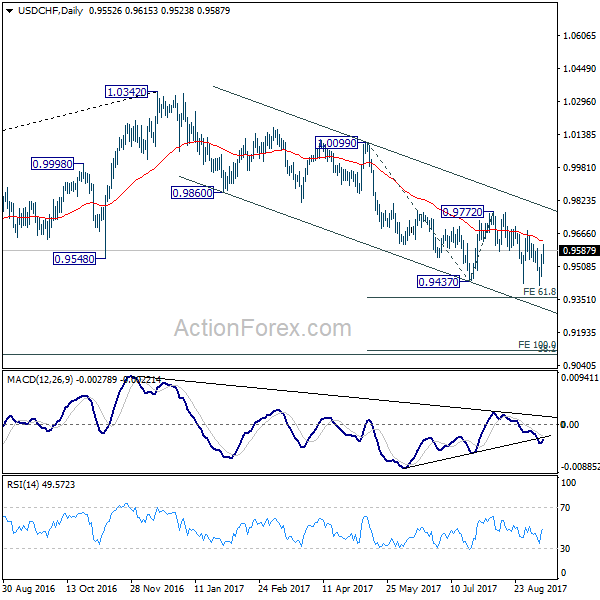
In the bigger picture, current development suggests that 0.9443 key support (2016 low) could be taken out firmly as down trend form 1.0342 extends. There are various interpretation of the price actions. But in any case, medium term outlook will stay bearish as long as 0.9772 resistance holds. Current down trend could extend to 38.2% retracement of 0.7065 (2011 low) to 1.0342 (2016 high) at 0.9090. However, break of 0.9772 will indicate that USD/CHF has successfully defended 0.9443 again and turn outlook bullish for 1.0099 resistance.
USD/JPY Mid-Day Outlook
Daily Pivots: (S1) 108.47; (P) 108.99; (R1) 109.88; More...
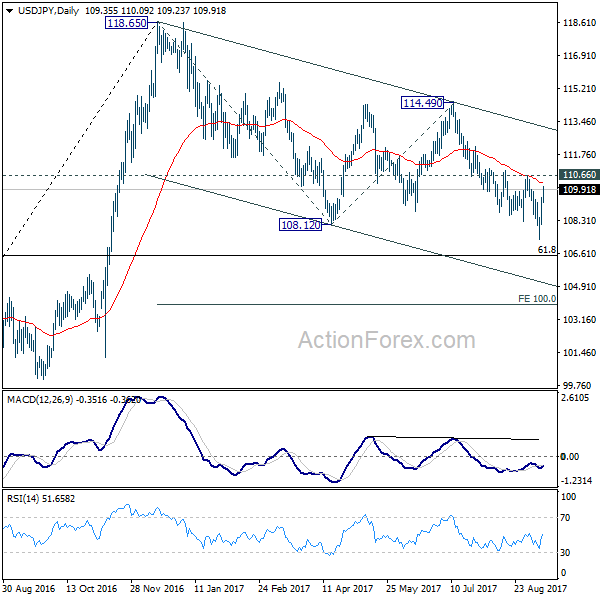
No change in USD/JPY's outlook. While the rebound from 107.31 is strong, it's limited below 110.66 resistance so far. Outlook remains bearish and another fall is still expected. Break of 107.31 will extend the whole fall from 118.65 to 61.8% retracement of 98.97 to 118.65 at 106.48 first. We'd look for support from there to bring rebound. But firm break of 106.48 will extend the decline to 100% projection of 118.65 to 108.12 from 114.49 at 103.96 or below. On the upside, firm break of 110.66 will confirm short term bottoming and turn bias back to the upside.
In the bigger picture, rise from 98.97 (2016 low) is now seen as the second leg of the corrective pattern from 125.85 (2015 high). It's unclear whether this this second leg has completed at 118.65 or not. But medium term outlook will be mildly bearish as long as 114.49 resistance holds. And, there is prospect of breaking 98.97 ahead. Meanwhile, break of 114.49 will bring retest of 125.85 high. But even in that case, we don't expect a break there on first attempt.
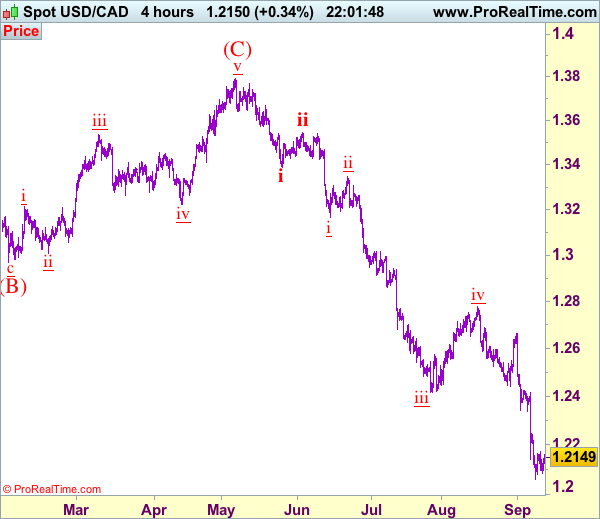
Trade Idea: USD/CAD – Sell at 1.2240
USD/CAD - 1.2145
Trend: Down
Original strategy :
Sell at 1.2240, Target: 1.2080, Stop: 1.2300
Position: -
Target: -
Stop: -
New strategy :
Sell at 1.2240, Target: 1.2080, Stop: 1.2300
Position: -
Target: -
Stop:-
As the greenback has recovered again after finding support at 1.2082, retaining our view that further consolidation above last week’s low at 1.2061 would take place and another bounce to 1.2200 cannot be ruled out, however, reckon resistance at 1.2245 would limit upside and bring another decline later, below 1.2097 would bring a retest of said support at 1.2061, break there would signal recent decline is still in progress and may extend further weakness towards psychological support at 1.2000 but loss of downward momentum should prevent sharp fall below 1.1950-60, bring rebound later. We are keeping our count that wave v as well as wave (C) ended at 1.3794 and impulsive wave (i ii, i ii) is now unfolding with minor wave iii ended at 1.2414, followed by wave iv correction ended at 1.2778, wave v has reached our indicated downside target at 1.2100 and may extend to 1.2000.
In view o this, would not chase this fall here and would be prudent to sell on recovery as 1.2245 should limit upside. Above 1.2300 would would defer and risk a stronger rebound to 1.2335-40 but only break of resistance at 1.2429 would signal low is formed, bring retracement of recent decline to 1.2490-00.
To recap, wave B from 1.3066 is unfolding as an a-b-c and is sub-divided as a: 1.2192, b: 1.2716 and wave c is a 5-waver with i: 1.1983, ii: 1.2506, extended wave iii with minor iii at 1.0206, wave iv ended at 1.0781 and wave v as well as wave iii has ended at 0.9931, hence the subsequent choppy trading is the wave iv which is unfolding as (a)-(b)-(c) with (a) leg of iv ended at 1.0854, followed by (b) leg at 1.0108 and (c) leg as well as the wave iv ended at 1.0674. The wave v is sub-divided by minor wave (i): 0.9980, (ii): 1.0374, (iii): 0.9446, (iv): 0.9913 and (v) as well as v has possibly ended at 0.9407, therefore, consolidation with upside bias is seen for major correction, indicated target at 1.3700 and 1.4000 had been met and further gain to 1.4700 would be seen later.