Sample Category Title
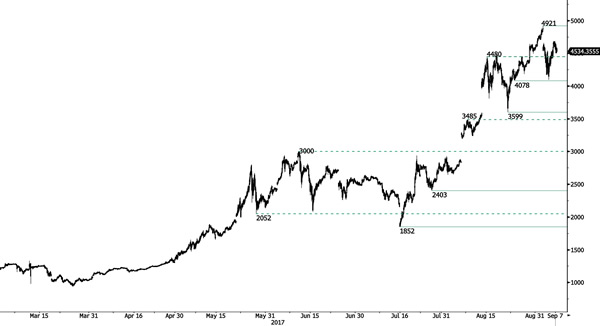
BITCOIN Weak Bounce Thus Far
Bitcoin has seen some buying interest. However, short term selling pressure suggests a limited upside potential. However, technical picture remain bullish as long as key support hold. Monitor the key support at 4480 (old horizontal resistance) then 4478. Strong support lies very far at 3599 (22/08/2017 low). Key resistance can be located at 4921.
In the long-term, the digital currency has had an exponential growth. There are decent likelihood that the asset will reach $10'000.
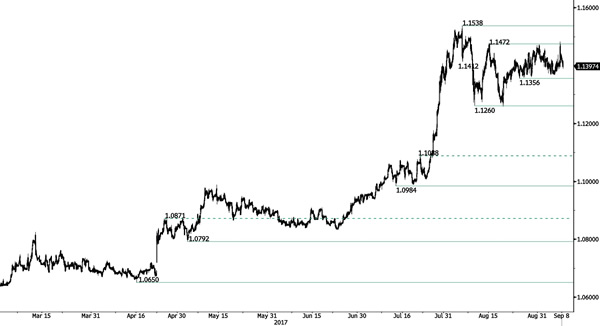
EUR/CHF Further Sideways Consolidation Likely
EUR/CHF has sharply declined near the resistance area between 1.1356 and 1.1472 Further medium-term sideways moves are favoured. Expected to show further sideways moves.
In the longer term, the technical structure has reversed. Strong resistance is given at 1.20 (level before the unpeg). Yet, the ECB's QE programme is likely to cause persistent selling pressures on the euro, which should weigh on EUR/CHF. Supports can be found at 1.0184 (28/01/2015 low) and 1.0082 (27/01/2015 low).
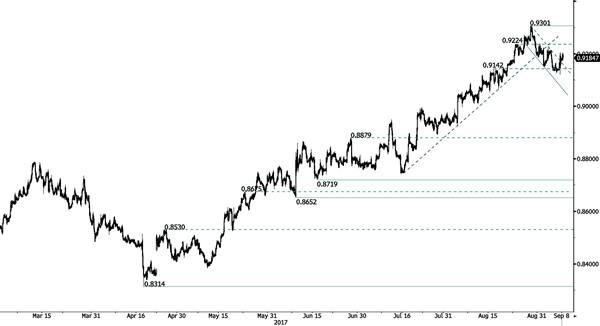
EUR/GBP Short-Term Improvements
EUR/GBP has bounced off support. However, as long as prices remain below the resistance at 0.9176 (declining trendline), the short-term technical structure is biased to the downside. Hourly support is given at 0.9142 (07/09/2017). Resistance lies at 0.9306 (29/07/2017 high).
In the long-term, the pair has largely recovered from recent lows in 2015. The technical structure suggests a growing upside momentum. The pair is trading above from its 200 DMA. Strong resistance can be found at 0.9500 (psychological level).
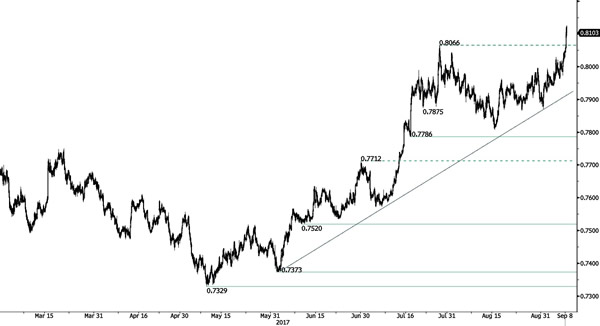
AUD/USD Surge Higher
AUD/USD has successfully tested the rising trendline support at 0.7881 and has broken the hourly resistance at 0.8066, improving the shortterm technical structure. Hourly support can be found at 0.8045 (intraday high). Key resistance is given at 0.8164 (14/05/2015 high). Expected to further consolidate.
In the long-term, the trend is largely negative since 2011. Key supports stands at 0.6009 (31/10/2008 low) . A break of the key resistance at 0.8295 (15/01/2015 high) is needed to invalidate our long-term bearish view.
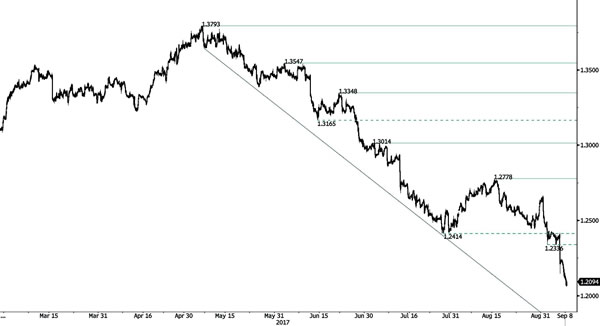
USD/CAD Falling Fast
USD/CAD is moving lower, confirming an underlying declining trend. Hourly support is located at 1.1945 (29/04/2015 low). Resistance is now given at a distance at 1.2778 (15/08/2017 low). Expected to show continued short-term bearish pressures if resistance at 1.2778 holds.
In the longer term, the pair has broken longterm support that can be found at 1.2461 (16/03/2015 low). Strong resistance is given at 1.4690 (22/01/2016 high). The pair is likely to head further lower.
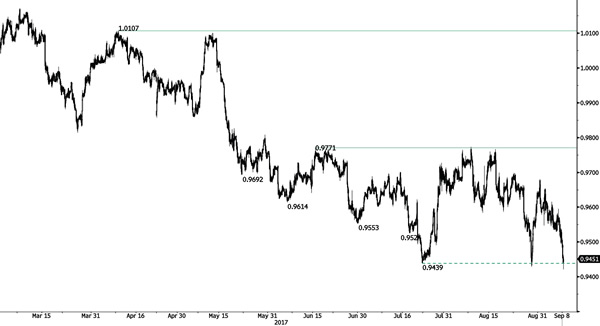
USD/CHF The Support At 0.9439 Is Challenged
USD/CHF is trying to bounce. Strong resistance is given at 0.9771 (15/06/2017 high). The pair is likely to head further lower below 0.9444 (03/05/2017). Expected to show renewed bearish pressures.
In the long-term, the pair is still trading in range since 2011 despite some turmoil when the SNB unpegged the CHF. Key support can be found 0.8986 (30/01/2015 low). The technical structure favours nonetheless a long term bullish bias since the unpeg in January 2015.
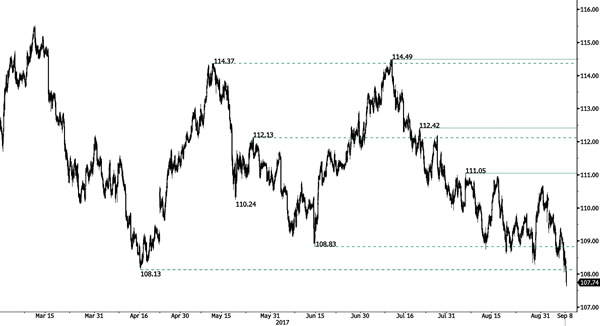
USD/JPY The Support At 108.13 Broken
USD/JPY moving lower confirming persistent selling pressure. The pair has failed to test resistance at 111.05 (04/08/2017 high). Support is located at 106.95 (10/11/2017 high). Expected to show further downside pressures.
We favor a long-term bearish bias. Support is now given at 99.02 (10/08/2013 low). A gradual rise towards the major resistance at 125.86 (05/06/2015 high) seems unlikely. Expected to decline further support at 93.79 (13/06/2013 low).
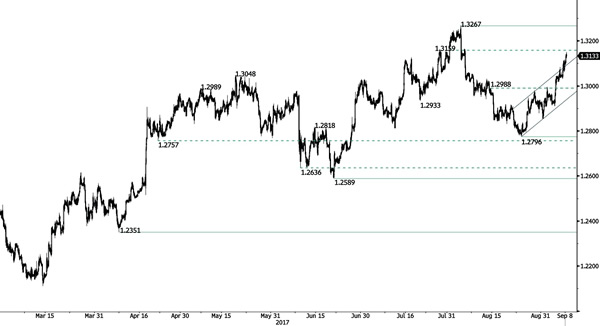
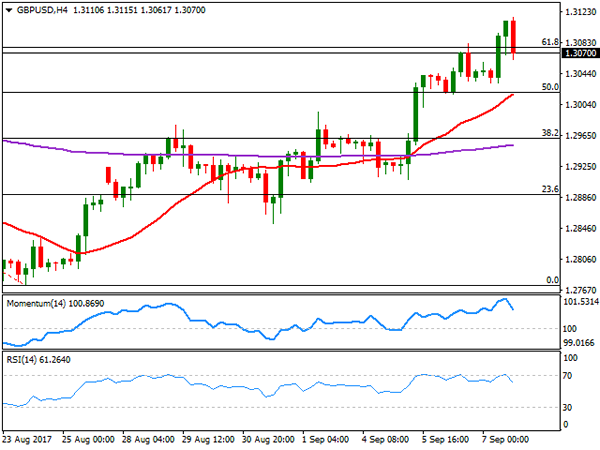
GBP/USD Pushing Higher
GBP/USD has pushed above rising trend-line resistance, confirming an improving short-term technical structure. Strong support is given at 1.3023 (06/09/2017 low). Expected to show shortterm bullish pressures.
The long-term technical pattern is even more negative since the Brexit vote has paved the way for further decline. Long-term support can be found at 1.1841 (07/10/2017 low). Long-term resistance is given around 1.35 and would indicate a long-term reversal in the negative trend. Yet, it is very unlikely at the moment.
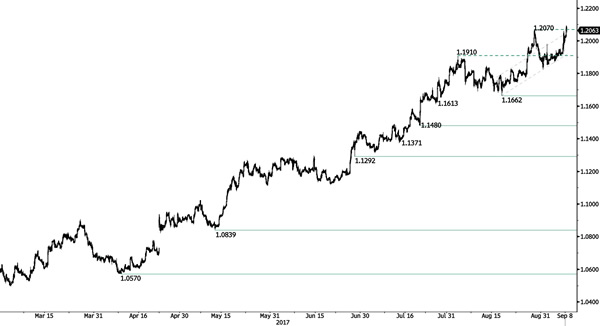
EUR/USD Pushing Higher
EURUSD has broken the resistance implied by its horizontal resistance, confirming an improving technical structure. Hourly resistance can be found at 1.2090 (intraday high) while hourly support lies at 1.2023 (intraday low). Stronger support is given at a distance at 1.1662 (17/08/2017 low). Expected to show renewed bullish pressures.
In the longer term, the momentum is now turning largely positive. We favour a continued bullish bias. Key resistance is holding at 1.2252 (25/12/2014 high) while strong support lies at 1.0341 (03/01/2017 low).
Foreign Exchange Market Commentary: EUR/USD, USD/JPY, GBP/USD, GOLD, WTI CRUDE, DJIA, FTSE100, DAX
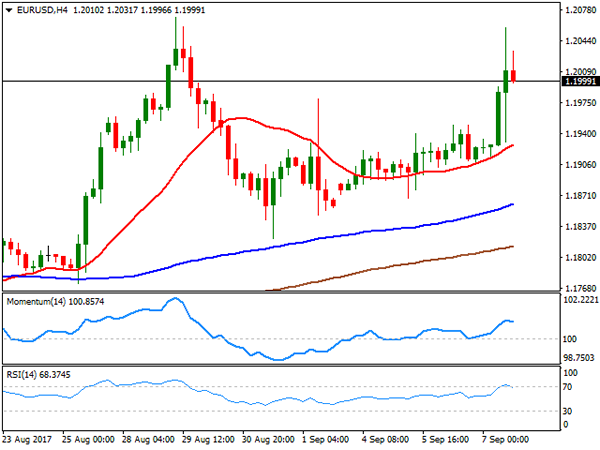
EUR/USD
The EUR/USD pair surged to 1.2058, but settled around 1.2000, as a result of the ECB's latest monetary policy meeting. As largely expected, Draghi & Co. left the overnight rate unchanged at record lows of 0.0%, while repeating their stance on maintaining QE until December 2017, or longer if needed. The pair's advance came with the press conference, as despite Draghi tried to convince market' that substantial accommodation is still needed, speculative interest didn't buy it. He repeated multiple times that volatility in the exchange rate is a source of uncertainty, but the market once again ignored him. Also, the ECB offered fresh economic projections, revising growth slightly higher, and inflation slowly lower for the next years, while Draghi ended reckoning that more details on tapering will be unveiled next October.
Adding to the bullish case of the pair were US employment figures released ahead of US opening, as weekly unemployment claims jumped to the highest since late 2012, up to 298,000 in the week ending September 2nd, an increase of 62,000 from previous week. Nonfarm business productivity increased by 1.5% during the second quarter of 2017, although unit labor cost, in the same period, increased just by 0.2% from previous 0.6%.
The technical outlook for the pair is bullish, although investors are now doubting how much higher they could take price, an anyway maintain QE tapering on the horizon. Would Draghi dare to extend it beyond December, if the EUR keeps rising? Up for fifth consecutive day, and at its highest for the week, the pair would need to develop some strength above the 1.2030 level to be able to run further higher, towards the yearly high and beyond. Short term, the 4 hours chart shows that the price has continuously recovered from a bullish 20 SMA, currently around 1.1925, whilst technical indicators are partially losing upward strength, but holding near overbought levels, leaving limited room for a sharp downward correction.
Support levels: 1.1960 1.1925 1.1870
Resistance levels: 1.2030 1.2070 1.2110
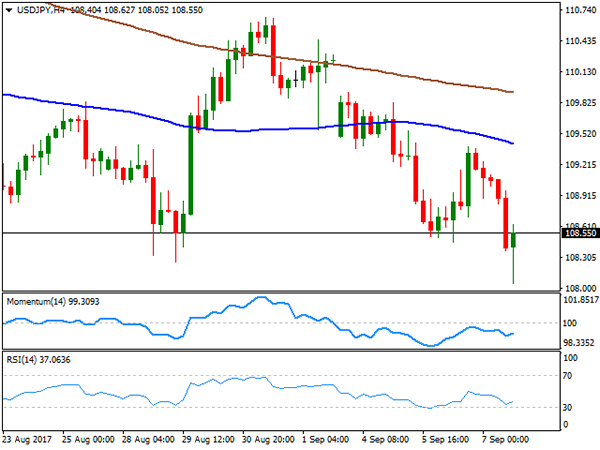
USD/JPY
The USD/JPY pair settled a fresh 2017 low of 108.05 early US session, amid broad dollar's weakness triggered by the ECB's announcement, and poor US employment figures, a result of Hurricane Harvey heating the Texas area. Unemployment rate jumped to their highest in nearly five years, up to 298K from previous 236K and the expected 241K. Adding to yen's strength was weakness in US Treasury yields, which fell below November's lows. The 10-year note benchmark as low as 2.03%, recovering later to 2.06%, still far below previous 2.11%, whilst the 30-year bond interest ended around 2.68% from 2.72%. Adding concerns are the Hurricanes hitting the US Atlantic coast, and the possible effects they could have on the real economy. Japan will release a Q2 GDP revision during the upcoming Asian session, expected unchanged at -0.4%. From a technical point of view, and despite the 50 pips recovery, the risk remains towards the downside and there are no signs of a bottom, as in the 4 hours chart, the price is further below bearish 100 and 200 SMAs, whilst the Momentum indicator has turned flat within negative territory, and the RSI indicator barely bounced from oversold readings. Another round of selling that sends the pair below 108.10 should lead to a new leg lower, towards the 107.30/70 region.
Support levels: 108.10 107.70 107.30
Resistance levels: 108.65 109.00 109.35
GBP/USD
The GBP/USD pair kept advancing this Thursday, reaching a 1-month high of 1.3115 early US session, but trimming half of its daily gains ahead of the close to settle around the 1.3070 region. The USD found some support from news coming from the US in the American afternoon, indicating that President Donald Trump and Senate Minority Leader Chuck Schumer discussed an idea to remove the need for Congress to repeatedly raise the country's debt ceiling. Of course, it would need a law to pass the Congress to actually get there, but seems a step in the right direction. The UK will release its manufacturing and industrial production figures for July alongside with the trade balance this Friday, and worst-than-expected numbers could see the Pound lose the 1.3000 mark. Anyway, the headline helped the pair correct lower, and settle for a second consecutive day right below a major Fibonacci level, the 61.8% retracement of the August decline at 1.3080, the immediate short term resistance. Technical indicators in the 4 hours chart have retreated from overbought readings, heading lower within positive territory, but the 20 SMA gained momentum below the current level, now converging with the 50% retracement of the mentioned decline at 1.3020, reinforcing the static support. As long as above this last, the downward risk will remain limited.
Support levels: 1.3020 1.2985 1.2950
Resistance levels: 1.3080 1.3110 1.3140
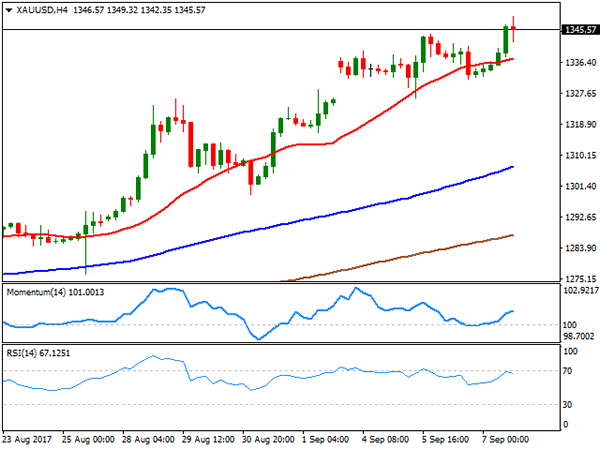
GOLD
Gold prices regained the upside and settled at their highest since September 2016, with spot up to $ 1,349.32 a troy ounce, to finally stabilize around 1,345.00. The commodity followed the lead of the common currency against the greenback, both rising on the back of ECB's announcement, overall optimistic, and tepid US employment figures. Political uncertainty in the US remains high, despite some positive announcements over the debt ceiling these days, keeping gold buoyed. The commodity is moving with a bullish bias according to the daily chart, as the metal closed at its highest for the week and well above all of its moving averages, whilst technical indicators resumed their advances within overbought territory, with the Momentum currently at fresh multi-month highs. In the 4 hours chart, the price is also well above moving averages, while the RSI aims to regain the upside, currently around 68, although the Momentum lost upward strength, all of which favors the upside anyway, particularly on a break above 1,352.55, the immediate resistance.
Support levels: 1,342.40 1,331.60 1,325.00
Resistance levels: 1,352.55 1,363.40 1,372,90
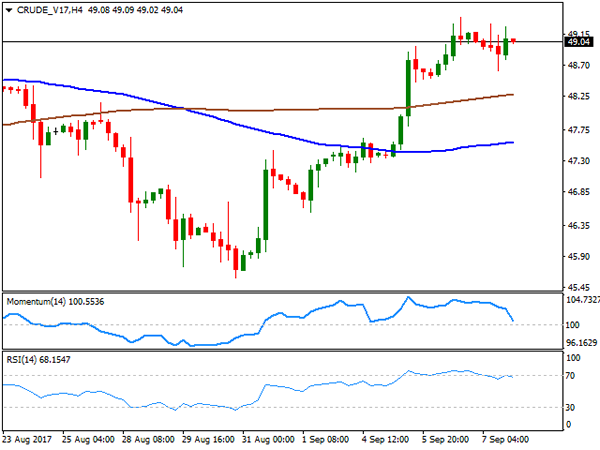
WTI CRUDE OIL
West Texas Intermediate crude oil futures settled at $49.04 a barrel, marginally lower for the day amid a large increase in US stockpiles, according to the latest EIA report. The figures were shocking, but the market was expecting something like that after Hurricane Harvey shut down refineries in Texas, resulting in a limited reaction in oil prices. Anyway, crude stockpiles surged by 4.6 million barrels in the week ended September 1st, putting an end to a nine-week continued decline. Crude oil refinery inputs fell by 3.3 million barrels in the same period. The daily chart for the commodity shows that it remained below a bearish 200 DMA, but for little, while technical indicators have lost upward strength, but hold within positive territory, limiting chances of a steeper decline. In the 4 hours chart, the RSI indicator consolidates within overbought levels, the Momentum indicator turned sharply lower, nearing its 100 level, but given that the price remains near its recent highs and above its moving averages, the risk remains towards the upside, to be confirmed on an extension above 49.40, the immediate resistance.
Support levels: 48.20 47.70 47.15
Resistance levels: 49.40 49.90 50.40
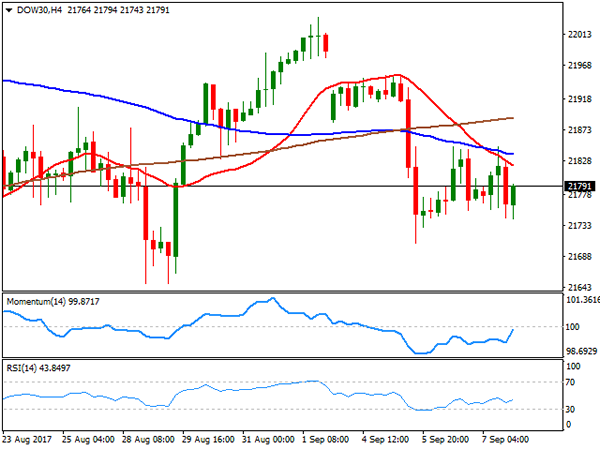
DJIA
Wall Street closed mixed, with only the Nasdaq Composite up for the day by 0.07%, to close at 6,397.87. The Dow Jones Industrial Average lost 21 points, and ended at 21,785.81, while the S&P finished pretty much unchanged, losing 0.02%, to 2,465.10, with the indexes weighed by weaker financial and consumer discretionary-related equities. Walt Disney was the worst performer, down 4.60% after its CEO gave a profit warning, while General Electric followed, down 3.85%. Morgan Chase finished the day 1.84%. Visa on the other hand, added 1.36%, leading winners´ list. The Dow's daily chart shows that the index failed on an attempt to surpass a modestly bearish 20 DMA for a second consecutive day, while the RSI indicator remains around 47 as the Momentum maintains its bearish slope within negative territory, in line with further slides ahead. Shorter term, and according to the 4 hours chart, the recovery was also halted by a bearish 20 SMA, while the index also settled below its 100 and 200 SMAs. In this last time frame, technical indicators have managed to recover some ground, but remain within negative territory.
Support levels: 21,740 21,707 21,663
Resistance levels: 21,845 21,891 21,932
FTSE100
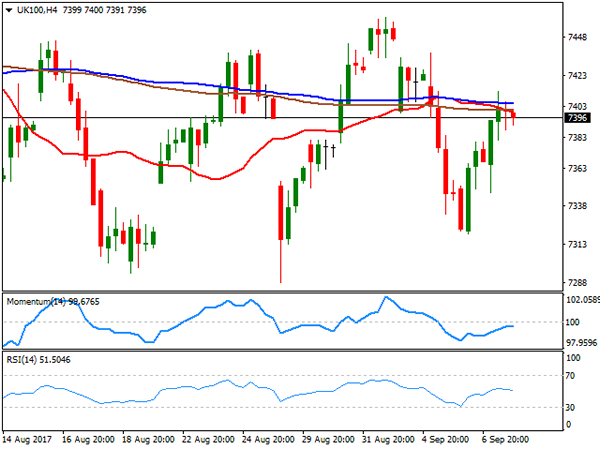
The FTSE 100 closed the day 43 points higher at 7,396.68, with commodity and tobacco-related companies leading the way higher. An advance in European equities and easing risk aversion, backed the Footsie, alongside with a stable Pound. Tobacco companies rose after Imperial Brands announced it sold down some of its stake in Spanish logistics firm Logista, ending 2.80%. Fresnillo was the best performer among miners, adding 3.98%. Financials feel the hit after the ECB, with Royal Bank of Scotland leading decliners with a 1.39% loss. The daily advance barely affected the index technical outlook, as in the daily chart poses a neutral stance, hovering around its 20 and 100 DMAs, and with technical indicators aiming modestly higher around their mid-lines. In the 4 hours chart, the recovery stalled right below all of its moving averages, confined to a tight range which also indicate the absence of directional strength, while technical indicators lack directional strength, also standing within neutral territory.
Support levels: 7,367 7,333 7,288
Resistance levels: 7,413 7,444 7,482
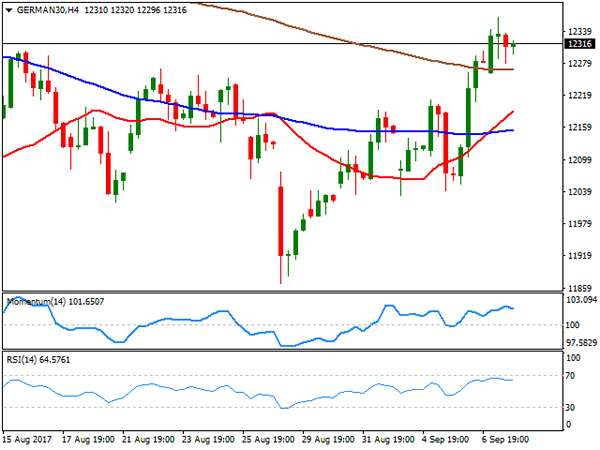
DAX
The German DAX closed the day 82 points higher at 12,296.63, with all European indexes gaining amid upward revisions on growth forecasts coming from the ECB and an extremely moderate outlook to QE tapering. RWE AG led advancers, adding 3.53%, followed by Adidas that added 1.76%. Banks led decliners, with Commerzbank losing 1.73% and Deutsche Bank shedding 1.27%. The index maintained the positive tone after the close, heading into the Asian opening around July's highs above the 12,300 level. The benchmark presents a positive stance in the daily chart, having advanced further above its 20 and 200 DMAs, and with a major relevant resistance now at 12,448, the 100 DMA. In the same chart, technical indicators hold within positive territory, but with no directional strength, as the index stands some 50 points below its intraday high. Shorter term, and according to the 4 hours chart, the index settled above all of its moving averages, whilst technical indicators turned to consolidative mode near overbought readings, all in one, maintaining the risk towards the upside.
Support levels: 12,241 12,207 12,166
Resistance levels: 12,301 12,342 12,383