Sample Category Title
Elliott Wave Analysis: S&P500 Intra-day View
Usd index fell to a new low which caused a new leg up on major pairs, such as EURUSD, GBPUSD, AUDUSD, USDCAD and others. At the same time we can see strong energy markets, higher metals, and also quite strong stock markets. The only stock indexes that are lagging are coming from the US, but even those may catch a bid soon as we see E-mini S&P50 in a minor corrective set-back. We think that sooner or later S&P500 will be higher, retesting the highs, which may limit current gains on EURUSD, and downside on USDJPY.
S&P500, 30Min
Technical Outlook: Aussie Probes Above 0.8100 Barrier On Weaker Dollar/Regional Data
The Aussie dollar was among the top gainers in Asia, driven by weaker US dollar and data from China and Australia, released overnight.
Australian Home loans unexpectedly jumped in July by 2.9%, beating forecast at 1.0% and upward-revised June numbers at 1.2%.
Mixed data came from China, with trade surplus of $41.99 billion, being below expectation for August at $48.6 billion, while imports jumped 13.3% in August, higher than expected 10.0%.
On the other side, Exports rose by 5.5% in August, missing forecast at 6.0%
The Aussie extends strong rally into the fourth straight day and probed above 0.8100 mark hitting new over two-year high at 0.8124, after Thursday’s eventual close above psychological 0.8000 barrie generated strong bullish signal.
The pair is also on track for strong bullish weekly close that additionally supports bulls, en-route to 0.8164 target (50% retracement of 0.9503/0.6825 descend / 10 May 2015 high).
Weekly close above former high at 0.8065 will be strong bullish signal, as bullish daily studies favor further advance.
However, bulls might be interrupted by corrective easing on overbought studies and end of week profit-taking.
Former top of 27 July at 0.8065 and today’s session low at 0.8042, mark initial supports, with psychological 0.8000 level, now reverted to support and reinforced by rising daily Tenkan-sen, expected to contain dips.
Res: 0.8124, 0.8164, 0.8200, 0.8224
Sup: 0.8065, 0.8042, 0.8000, 0.7966
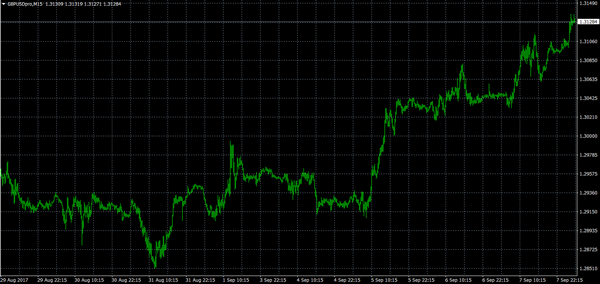
Technical Outlook: GBPUSD – Extended Wave C Could Travel To Its FE 161.8% At 1.3193, Broken Cloud Top Offers...
Cable extends steep ascend into fourth straight day and met target at 1.3150 zone (double Fibonacci barrier consisting of Fibo 76.4% of 1.3268/1.2773 descend and FE 138.2% of the wave C from 1.2852 trough).
Strong pressure on the US dollar continues to underpin sterling. The price is currently riding on extended third wave of five-wave cycle from 1.2773 which could travel to its FE 161.8% at 1.3193 on sustained break above 1.3150 zone, where the pair is taking a breather.
Thursday's strong rally that closed well above daily cloud was strong bullish signal, along with formation of daily Tenkan-sen/Kijun-sen bull-cross and multiple bull-crosses of daily MA's.
The pair is also on track for strong bullish weekly close which supports bullish scenario.
Broken daily cloud top marks solid support at 1.3083 which should ideally contain corrective dips.
Res: 1.3150, 1.3164, 1.3193, 1.3224
Sup: 1.3100, 1.3083, 1.3032, 1.3000
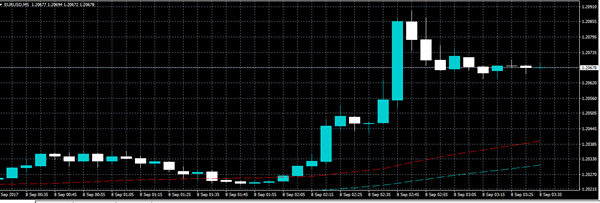
Technical Outlook: EURUSD – Bulls Eye Target At 1.2164, But Corrective Easing May Precede Fresh Rally
The Euro maintains firm tone and extended gains to fresh 2017 high at 1.2092 on Friday, following previous day's strong bullish acceleration, driven by Draghi's comments and weaker US dollar.
Close above psychological 1.2000 barrier on Thursday was strong bullish signal as the pair failed to close above it in previous attempt on 29 Aug, when the price peaked at 1.2070.
The pair is now looking for net target at 1.2166 (50% retracement of larger 1.3992/1.0340 descend), but corrective easing on Friday's profit-taking may precede fresh upside action.
Broken 1.2000 barrier now acts as initial support, ahead of rising 10SMA (1.1940) which is expected to contain correction.
Res: 1.2070, 1.2092, 1.2164, 1.2200
Sup: 1.2017, 1.2000, 1.1940, 1.1900
GBPJPY Neutral To Bullish In Short-Term But Strong 143-Resistance Keeps Risk To The Downside
GBPJPY is neutral in the short-term after a bounce from the August 24 low of 139.30. The rally stalled just below the key 143.00 level as the market became overextended and RSI reached overbought conditions above 70.
The market is also being capped at 143.00, which is the 50% Fibonacci retracement level of the downleg from 146.80 to 139.30. After approaching this level over two days at the end of August and September 1, GBPJPY lost momentum and stabilized. The pair is now in a consolidation phase between 141.00 and 143.00.
Looking at the 4-hour chart, the risk is tilted to the downside as prices are now in the Ichimoku cloud. RSI has dipped below 50 and is suggesting there is room for further downside. The bottom of the cloud and 23.6% Fibonacci level at 141.00 are expected to act as support. Failure at this key level would open the way to target 140.00 and see a re-test of the low at 139.30. From here, the market would resume the downtrend that started at the August 3 high of 146.80.
Only a move above 143.00 would ease downside pressure and shift focus to the upside. Then the 61.8% Fibonacci and 144.00 resistance would need to be broken in order to give scope for a move to the 146.80 top and then a move higher towards 148.00.
In the near term, the neutral to bullish bias is intact but the downtrend from 146.80 draws a medium-term bearish picture.
USDJPY Hits New Yearly Low
The U.S dollar has moved to its lowest level against the Japanese Yen since November 2016, as the U.S dollar index falls across the board. So far, price has traded as low as 108.04, breaking past the former 2017 yearly price low, at 108.13.
Despite weaker than expected Japanese second quarter GDP data, the USDJPY pair has continued to weaken, with price-action printing further bearish lower daily, weekly and monthly price lows.
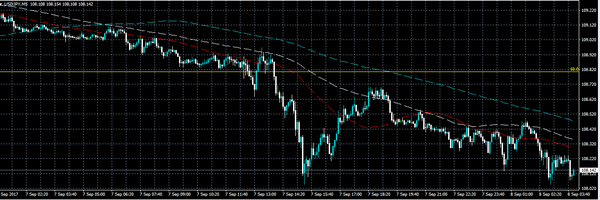
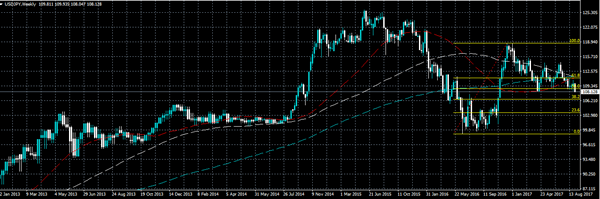
The U.S dollar index has now broken below its 20-period moving average on a 10-year time frame price chart, indicating further U.S dollar weakness ahead.
Key technical support below the key 108 level, is located at 107.70 and 107.30 with the 23.6 Fibonacci retracement level at 106.60.
To the upside, intraday USDJPY resistance is located at 108.28 and 108.60, with strong Fibonacci resistance at the 108.81. The weekly time frame, 5 period moving average, is also located at 109.05.
Euro Moves To New 2017 High
The euro has moved to its highest trading level against the U.S dollar since January 2015, breaking past the former 2017 trading high at 1.2070, reaching 1.2089 during the Asian market session.
Hawkish comments from the ECB President Mario Draghi during yesterday's ECB press conference, helped push the EURUSD pair above the 1.2000 level. Today, the U.S dollar index is coming under severe selling pressure, with a number of G-10 currencies breaking to multi-year trading highs against the greenback.
The EURUSD pair has pulled back slightly from the new 2017 price high set earlier, at 1.2089, trading around the 1.2060 level.
Traders should expect the EURUSD pair to head even higher over the coming weeks, with price moving towards resistance at 1.2129, 1.2165 and 1.2280.
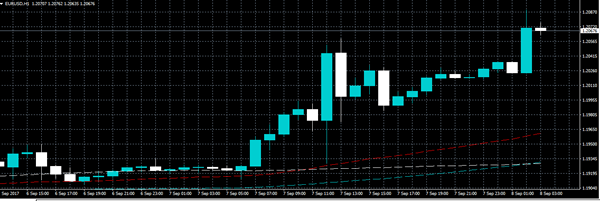
To the downside, key intraday EURUSD technical support is found at the 1.2057, 1.2030 and 1.2000 levels, with the former weekly price high adding strong support, at 1.1979.
Investors Eye Economic Data As Hurricane Irma Approaches Florida
A steady stream of economic data will keep investors preoccupied on Friday ahead of the expected landfall of Hurricane Irma on Florida’s southern shores this weekend.
The economic calendar will see a deluge of market-moving events from both sides of the Atlantic. Germany will get the ball rolling at 06:00 GMT with its monthly trade report.
A few hours later, the Bank of England (BOE) will release its consumer inflation expectations report. The release will be accompanied by data on industrial production, manufacturing production and trade. The United Kingdom’s industrial production is forecast to expand 0.2% in July. Manufacturing output is forecast to grow 0.3% month-on-month.
In North America, Canada will release its latest employment numbers at 12:30 GMT. The red-hot Canadian economy has added jobs every month this year.
In terms of US data, the Commerce Department will report on wholesale inventories for the month of July. Baker Hughes Inc. will also release its latest rig-count figures.
In terms of monetary policy, Federal Open Market Committee (FOMC) member Patrick Harker will deliver a speech during the morning session.
Earlier in the day, China reported a much smaller than expected August trade surplus, as import growth outpaced exports by swide margin. Beijing’s dollar-denominated trade surplus narrowed to $41.99 billion in August, down from $46.73 billion the previous month.
Hurricane Irma is expected to smash Florida’s southern shores by Sunday. The storm is considered one of the most powerful Atlantic hurricanes ever recorded. The latest satellite images suggest there is a strong probability that Irma will make its way farther inland and may even impact Georgia.
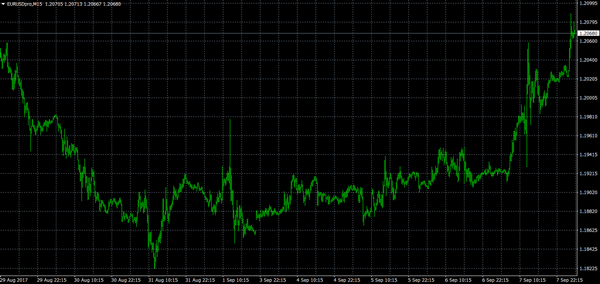
EUR/USD
The euro is riding fresh multi-year highs on Friday, as the dollar continues to decline. The EUR/USD exchange rate approached 1.21 during the Asian session before pulling back slightly toward 1.2075. That represents a gain of 1.2075. Meanwhile, the US dollar index is down another half percent against a basket of world peers to trade at its lowest level since January 2015. The common currency’s next major target is 1.21. Based on recent market movement, that level is a distinct possibility.
USD/CAD
The Canadian dollar’s enormous rally continued Friday, as the USD/CAD plunged another 0.5% to 1.2072. That’s the lowest level the pair has traded since May 2015. The USD/CAD has declined around 600 pips since the start of September. Prices appear poised to consolidate around the 1.20-1.21 level as the market awaits fresh news on US monetary policy.
GBP/USD
The British pound also benefited from the dollar’s slump, as cable extended recent highs. The GBP/USD pushed through 1.31 on Thursday, and was last seen trading near 1.3130. That represents a gain of 0.3%. The pair faces immediate support at 1.3065. The next resistance target is likely seen at 1.3200.
US Dollar Nosedives Below Key Support Vs Japanese Yen
Key Highlights
- The US Dollar was under a lot of pressure lately and declined below 108.50 against the Japanese Yen.
- There is a key resistance forming near 108.50 on the 4-hours chart of USD/JPY.
- Japan’s Gross Domestic Product in Q2 2017 increased 0.6%, less than the forecast of +0.7% (QoQ).
- Japan’s Current Account in July 2017 posted a trade surplus of ¥2,320.0B, more than the forecast of ¥2,058.0B.
USDJPY Technical Analysis
The US Dollar started a major downtrend from 110.60 against the Japanese Yen. The USD/JPY pair recently broke a crucial support at 108.50, opening the doors for more losses.
The 4-hours chart of USD/JPY clearly highlights a major bear leg starting from the 110.60 high. The pair declined towards 108.50 where buyers tried hard to prevent further declines. There was even a correction towards 109.40, but two bearish trend lines disallowed further gains.
As a result, the pair declined and also cleared the 108.50 support area. A new two month low was formed recently at 107.61 from where there can be a minor correction.
However, the broken support at 108.50 would now act as a strong resistance. Both trend lines and the 50% Fib retracement level of the last drop from the 109.39 high to 107.61 low are also positioned near 108.50.
Japan’s Gross Domestic Product
Today, Japan saw a couple of key economic releases like the Gross Domestic Product and Current Account Balance. The Gross Domestic Product for Q2 2017 was released by the Cabinet Office.
The forecast was slated for an increase of 0.7% in the GDP compared with the previous quarter. However, the actual result was on the lower side, as there was an increase of 0.6% in the GDP. The yearly change was also disappointing, as there was an increase of 2.5%, less than the forecast of 2.9%.
The Current Account report for July 2017 was released today by the by the Ministry of Finance. The market was looking for a trade surplus of ¥2,058.6B, more than the last ¥934.6B.
However, the actual was positive, as the trade surplus was ¥2,320.0B in July 2017. Overall, the result was not what the market expected, which could prompt a correction in USD/JPY towards 108.20-30 in the near term.
Economic Releases to Watch Today
US Wholesale Inventories for July 2017 – Forecast +0.4%, versus +0.4% previous.
Canada’s Net Change in Employment August 2017 – Forecast 19.0K, versus 10.9K previous.
Canada’s Unemployment Rate August 2017 – Forecast 6.3%, versus 6.3% previous.
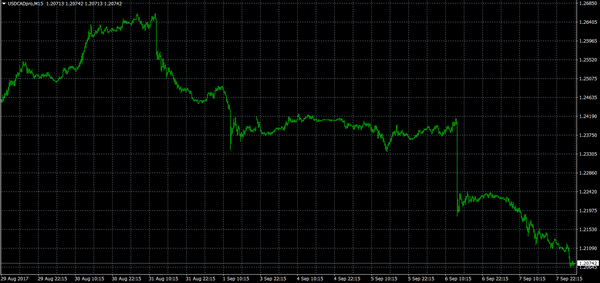
USDCAD Strongly Bearish After Break Below Key Support
USDCAD is strongly bearish as it extends its slide to a more than 2-year low of 1.2063. The overall technical structure is indicating weakness in the market, especially after the bearish crossover of the 50-day with the 200-day moving average in July. Momentum signals are bearish.
The downtrend that started from the May 5 high of 1.3793 remains intact and is gaining traction. The break of very strong support at 1.2400 this week has increased downside pressure. Only a move back above this level would help stabilize the market. However, any bounces would find resistance at 1.2777. Above this, the level at 1.3015 would be challenging to break since it provided strong support in the past (between September 2016 and February 2017). Clearing 1.3350 and the 200-day MA would shift focus to the upside for a re-test of 1.3793.
Momentum oscillators are supportive of additional declines in USDCAD as they are in bearish territory. MACD is below zero and falling. RSI is below 50 although it is now in oversold territory, which indicates the possibility of a corrective move up or a consolidation in the market in the near term.
The odds for reaching support at the next major low of 1.1919 (May 2015 trough) are high now, with little indication of a change in the current downtrend.
The medium-term bearish trend is expected to remain intact as the loss of a key support level this week suggests near-term risk is strongly tilted to the downside.