Sample Category Title
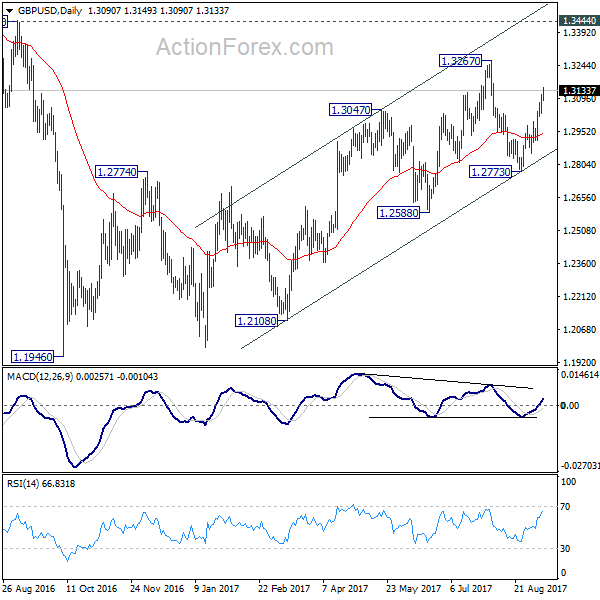
GBP/USD Daily Outlook
Daily Pivots: (S1) 1.3049; (P) 1.3082; (R1) 1.3132; More...
GBP/USD's rise from 1.2773 is still in progress and intraday bias stays on the upside for 1.3267 resistance. Break will target 1.3444 key resistance level next. Price actions from 1.1946 are still seen as a corrective pattern. Hence, we'd expect strong resistance from 1.3444 to limit upside to bring larger down trend reversal eventually. On the downside, below 1.3018 minor support will turn intraday bias neutral first.
In the bigger picture, overall, price actions from 1.1946 medium term low are seen as a corrective pattern. While further rise cannot be ruled out, larger outlook remains bearish as long as 1.3444 key resistance holds. Down trend from 1.7190 (2014 high) is expected to resume later after the correction completes. And break of 1.2588 will indicate that such down trend is resuming.
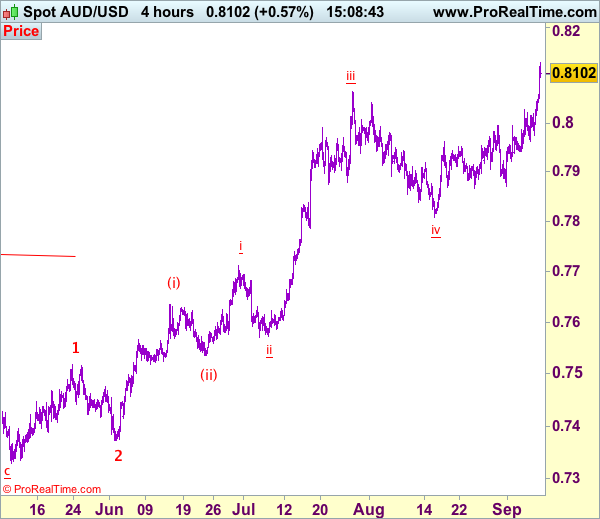
Trade Idea: AUD/USD – Buy at 0.8050
AUD/USD – 0.8100
Original strategy:
Buy at 0.7925, Target: 0.8125, Stop: 0.7865
Position: -
Target: -
Stop:-
New strategy :
Buy at 0.8050, Target: 0.8200, Stop: 0.7990
Position: -
Target: -
Stop:-
As aussie has surged in part due to broad-based weakness in the greenback and the breach of previous resistance at 0.8066 (wave iii top) confirms recent upmove has resumed and current wave v may extend further gain to 0.8150, then towards 0.8200, however, near term overbought condition should prevent sharp move beyond 0.8225-30 and price should falter below 0.8250-60, risk from there is seen for a retreat later.
In view of this, we are looking to buy aussie on pullback but at a higher level as 0.8050 should limit downside. Below 0.8000 would defer and risk test of support at 0.7963 but break there is needed to signal a temporary top is formed instead, risk correction to 0.7920-25 first.
On the 4-hour chart, the move from 0.8066 is the wave 5 with i: 0.8860, ii: 0.8315, wave iii is an extended move ended at 1.0183, iv: 0.9706 and wave v has ended at 1.1081 (also the top of entire wave 5). The subsequent selloff is the major correction which is unfolding as ABC-X-ABC and 2nd A leg has ended at 0.8848, followed by a-b-c wave B which ended at 0.9758, hence, 2nd C wave is now in progress and indicated downside target at 0.7000 and 0.6950 had been met, so further fall to 0.6710-20 cannot be ruled out.
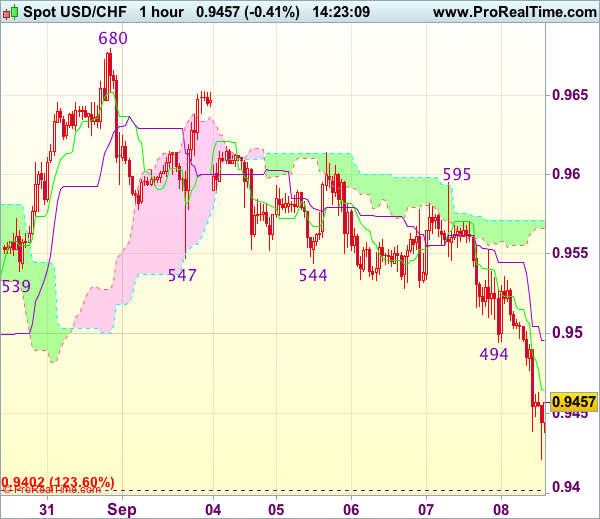
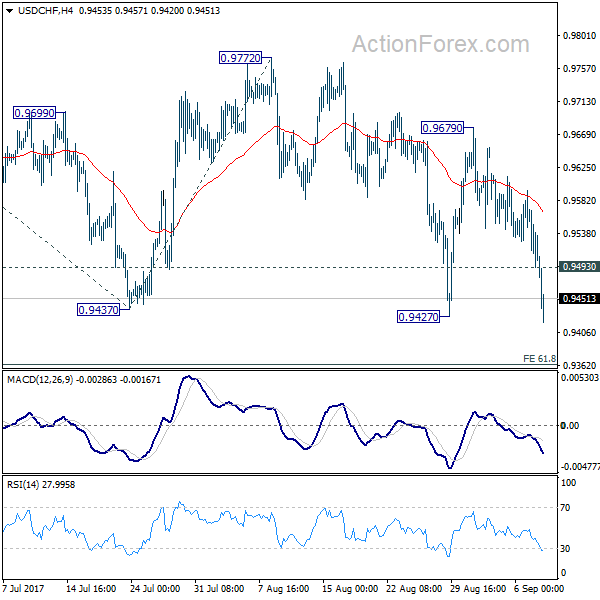
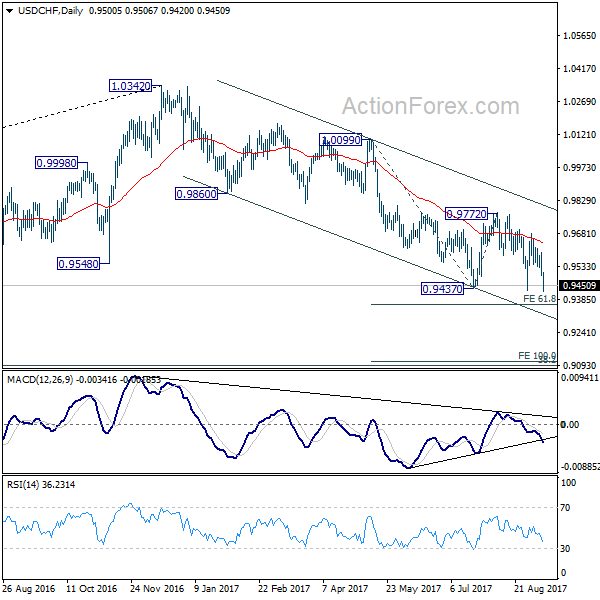
USD/CHF Daily Outlook
Daily Pivots: (S1) 0.9468; (P) 0.9530; (R1) 0.9568; More....
The break of 0.9427 argues that larger decline from 1.0342 is resuming. Intraday bias stays on the downside for the moment. Current fall should now target 61.8% projection of 1.0099 to 0.9437 from 0.9772 at 0.9363 next. On the upside, above 0.9493 minor resistance will turn bias neutral first. But outlook will stay bearish as long as 0.9679 resistance holds.
In the bigger picture, current development suggests that 0.9443 key support (2016 low) could be taken out firmly as down trend form 1.0342 extends. There are various interpretation of the price actions. But in any case, medium term outlook will stay bearish as long as 0.9772 resistance holds. Current down trend could extend to 38.2% retracement of 0.7065 (2011 low) to 1.0342 (2016 high) at 0.9090. However, break of 0.9772 will indicate that USD/CHF has successfully defended 0.9443 again and turn outlook bullish for 1.0099 resistance.
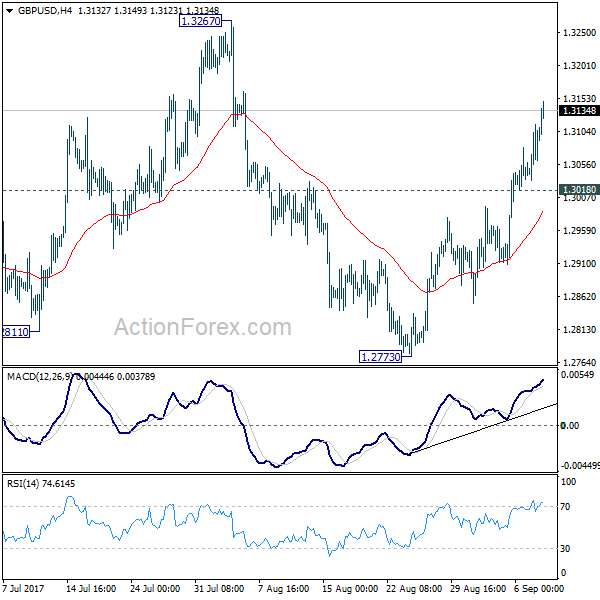
Elliott Wave View: GBPUSD More Upside
GBPUSD Short Term Elliott Wave view suggests that the rally from 8/24 low is unfolding as an impulse Elliott Wave structure. Up from 8/24 low (1.2773), Minor wave 1 ended at 1.2979 and Minor wave 2 ended at 1.2851. Minor wave 3 is in progress and the subdivision is unfolding as an impulse Elliott Wave structure. Minute wave ((i)) of 3 ended at 1.2947, Minute wave ((ii)) of 3 ended at 1.2907, Minute wave ((iii)) of 3 ended at 1.3082 and Minute wave ((iv)) of 3 ended at 1.303. Minute wave ((v)) of 3 is expected to end soon within 1.3104 – 1.3182 area. Afterwards, pair should pullback in Minor wave 4 before the rally resumes. We don’t like selling the proposed pullback.
GBPUSD 1 Hour Elliott Wave Chart
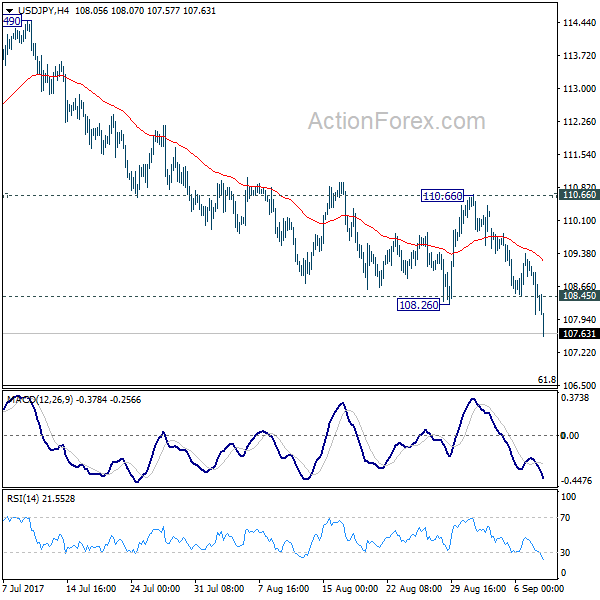
USD/JPY Daily Outlook
Daily Pivots: (S1) 107.91; (P) 108.59; (R1) 109.13; More...
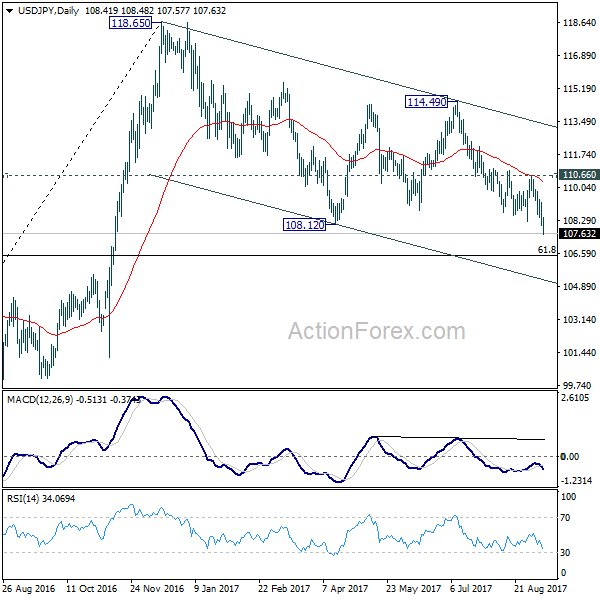
Firm break of 108.12 support confirms resumption of whole medium term decline from 118.65. Intraday bias back on the downside for 61.8% retracement of 98.97 to 118.65 at 106.48. We'll look for support from there again to bring rebound. On the upside, above 108.45 minor resistance will turn intraday bias neutral first. But outlook will now stay bearish as long as 110.66 resistance holds.
In the bigger picture, pull back from 118.65 is viewed as a corrective pattern for the moment and downside should be contained by 61.8% retracement of 98.97 to 118.65 at 106.48 and bring rebound. Rise from 98.97 is expected to extend later to retest 125.85 high. However, sustained break of 106.48 will dampen this view and bring deeper fall to retest 98.97 instead.
ECB Left Its Policy Measures Unchanged
Market movers today
With little interesting data out markets will focus on the situation in North Korea, the hurricane Irma hitting Florida and further digest the ECB meeting yesterday.
North Korea is expected to launch another Interballistic Missile (ICBM) tomorrow when it celebrates its founding day. China voiced support yesterday for further sanctions against North Korea but also wants to see renewed efforts to begin a dialogue.
Hurricane Irma is expected to hit Florida on Sunday after causing severe damage in the Caribbean.
The ECB left its policy measures unchanged and President Mario Draghi confirmed that the bulk of decisions regarding the QE purchases beyond 2017 will most likely be taken in October. We still believe the ECB will announce a reduction in its QE purchases to EUR40bn per month in H1 18 at the next meeting in October.
In terms of economic data releases, it is a quiet day today. In the UK, keep an eye on the NIESR GDP estimate for August , as it is usually a good predictor of actual GDP growth. In Germany, labour costs data for Q2 are due to be released at 08:00.
In Sweden, household consumption in July is due while in Denmark, current account and trade balance data for July are being released this morning. The Riksbank left a dovish message yesterday despite keeping its policy measures including the reporate path unchanged. The Riksbank also announced that CPIF inflation is now the formal target variable and reintroduced a +/-1 percentage point variation band. Neither has any implication for actual policymaking.
Selected market news
With uncertainty in the market prevailing, US stock markets and Asian markets are treading water with little clear direction. While FX markets interpreted Draghi on the hawkish side sending EUR/USD above 1.20, bond yields took another nose-dive yesterday.
In a speech yesterday Fed Vice President Bill Dudley (voter, dove) reiterated his view that ‘even though inflation is currently somewhat below our longer-run objective, I judge that it is still appropriate to continue to remove monetary policy accommodation gradually’. However, he refrained from saying whether that meant another hike this year. Fed member Esther George (non-voter, hawk) overnight said thatitis ‘time to continue to move that interest rate higher’. Dudley and George have given some counterweight to speeches made recent ly by some of the Fed doves (Brainard, Kaskhari and Kaplan) that have argued for patience due to low inflation. The Fed is currently splitinto two camps – one that wants to pause and another that wants to continue with gradual rate increases.
Chinese trade data overnight disappointed slightly with export growth being 6.9% y/y (consensus 8.7% y/y) down from 11.2% y/y in July.
EUR/JPY Candlesticks and Ichimoku Analysis
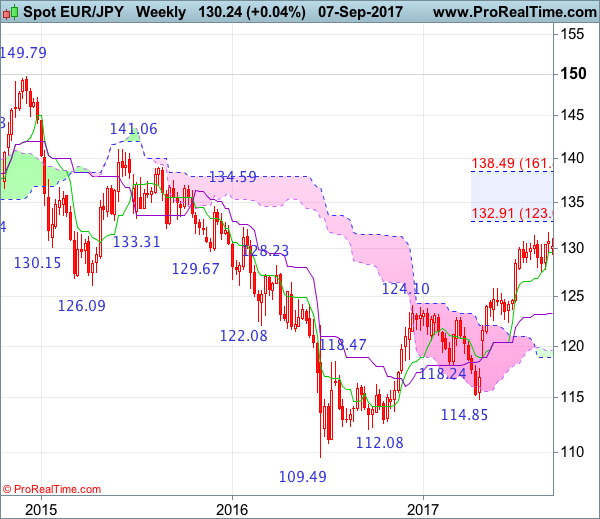
Weekly
• Last Candlesticks pattern: Window
• Time of formation: 24 April 2017
• Trend bias: Up
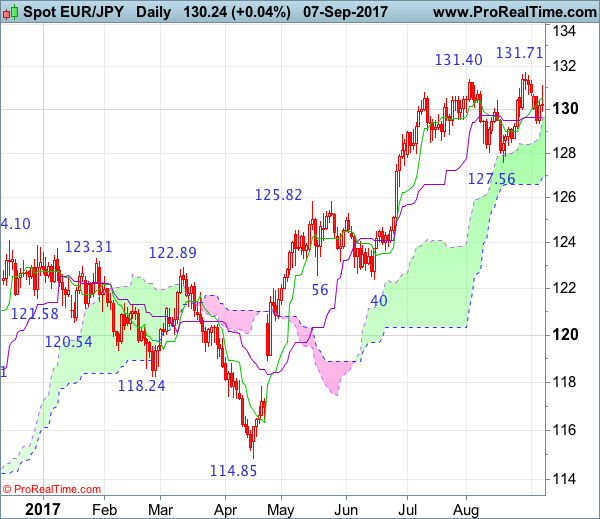
Daily
• Last Candlesticks pattern: Hammer
• Time of formation: 18 May 2017
• Trend bias: Up
EUR/JPY – 130.00
Euro’s retreat after last week’s brief rise to 131.71 (a doji star was formed on the daily chart, followed by two black candlesticks) suggests a temporary top has been formed there and as the single currency has slipped again after meeting renewed selling interest at 131.09 yesterday, retaining our view that further consolidation below said resistance at 131.71 would be seen and another fall to support at 129.37 is likely. A drop below this level would add credence to our view that top has been made, bring retracement of recent rise to 129.00-10, then towards 128.45-50, however, break of latter level is needed to retain bearishness and encourage for subsequent weakness towards support at 127.56 which is likely to hold from here.
On the upside, whilst recovery to 130.50-60 cannot be ruled out, said resistance at 131.09 should hold, bring another decline later. A daily close above this level would suggest the retreat from 131.71 has ended, bring retest of this level but break there is needed to extend recent upmove to 132.50-60, however, euro’s upside is likely to be limited to 133.10-15 (61.8% projection of 122.40-131.40 measuring from 127.56) and reckon 133.50-60 would hold from here, price should falter well below 134.00-10, risk from there has increased for a retreat to take place later.
Recommendation: Sell at 130.60 for 128.60 with stop above 131.60.
On the weekly chart, despite last week’s rise to 131.71, the subsequent retreat formed a doji star alike pattern and if this week ends with a black candlestick, this would suggest a potential bearish reversal pattern is formed, hence consolidation below 131.71 would be seen with mild downside bias for test of 129.37 support, break there would bring further fall to 129.00, then 128.00 but only break of previous support at 127.56 would confirm a temporary top is formed, bring retracement of recent upmove to 126.70-80, then towards 126.00-10 but previous resistance at 125.81 should turn into support and limit euro’s downside.
On the upside, expect recovery to be limited to 130.50-60 and resistance at 131.09 (this week’s high) should hold, bring another retreat later. A weekly close above 131.09 would signal the pullback from 131.71 has ended, bring retest of this level, break there would signal the erratic upmove from 109.49 (2016 low) is still in progress and may extend headway to previous chart resistance at 132.33, however, overbought condition should limit upside to 133.10-15 (61.8% projection of 122.40-131.40 measuring from 127.56) and price should falter well below 134.40 (61.8% Fibonacci retracement of entire fall from 149.79-109.49), risk from there is seen for a retreat to take place later.
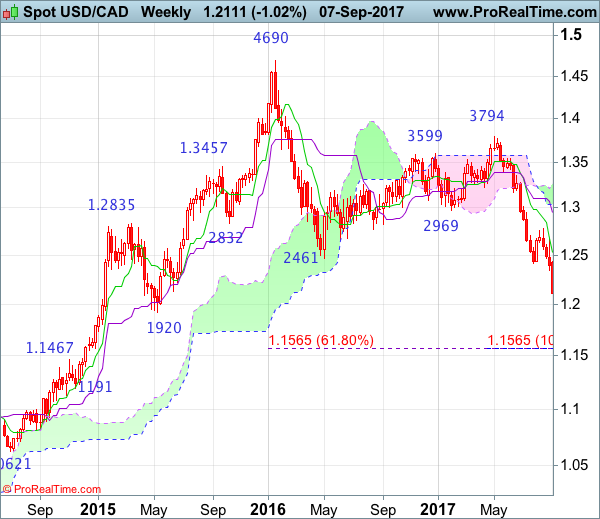
USD/CAD Candlesticks and Ichimoku Analysis
Weekly
• Last Candlesticks pattern: Shooting doji
• Time of formation: 01 May 2017
• Trend bias: Sideway
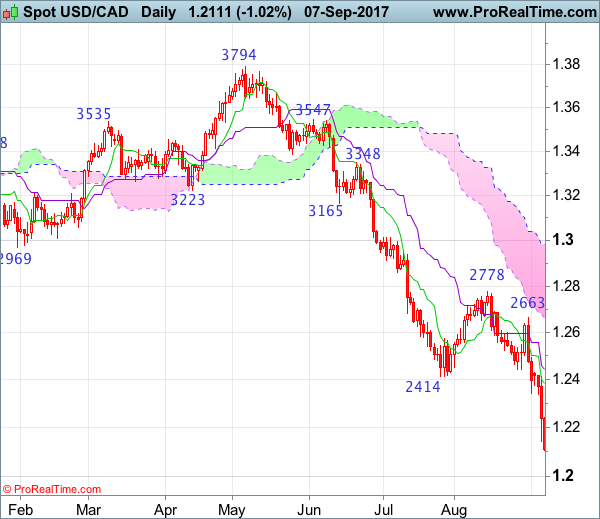
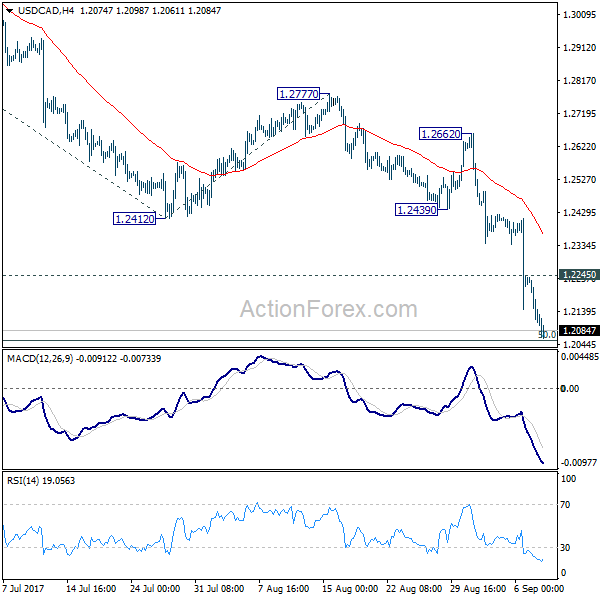
Daily
• Last Candlesticks pattern: Bearish engulfing
• Time of formation: 5 May 2017
• Trend bias: Down
USD/CAD – 1.2115
The greenback finally resumed recent decline after running into renewed selling interest at 1.2663 late last week, adding credence to our bearishness, our short position entered at 1.2640 met target at 1.2440 with 200 points profit and this anticipated selloff has reinforced our bearishness for recent downtrend to extend further weakness to 1.2085-90 (50% projection of 1.3794-1.2414 measuring from 1.2778), then towards psychological level at 1.2000, however, near term oversold condition should prevent sharp fall below 1.1920-25 (61.8% projection), risk from there has increased for a rebound to take place later.
On the upside, whilst initial recovery to 1.2240-50 cannot be ruled out, reckon 1.2340-50 would limit upside and bring another decline later to aforesaid downside targets. A daily close above resistance at 1.2415 would defer and risk a stronger rebound to the Kijun-Sen (now at 1.2458) but only a sustained breach above this level would abort and signal a temporary low is formed instead, bring retracement of recent decline to 1.2520-25, then towards 1.2600 but said resistance at 1.2663 should remain intact, bring retreat later.
Recommendation: Short entered at 1.2640 met target at 1.2440 with 200 points profit and would sella gain at 1.2340 for 1.2100 with stop above 1.2440.
On the weekly chart, this week’s selloff together with the breach of previous support at 1.2414 looks set to form another black candlestick and current anticipated resumption of recent decline adds credence to our bearish view for the fall from 1.4690 top to extend weakness to 1.2080-85, then towards psychological support at 1.2000, however, reckon downside would be limited to 1.1920-25 (61.8% projection of 1.3794-1.2414 measuring from 1.2778) and 1.1840-50 should hold from here, price should stay above 1.1750-60, bring rebound later this month.
On the upside, although initial recovery to 1.2240-50 and then 1.2300 cannot be ruled out, reckon upside would be limited to 1.2340-50 and bring another decline. A weekly close above previous support at 1.2414 would risk test of this week’s high at 1.2429 but only above the Tenkan-Sen (now at 1.2532) would signal a temporary low is formed, bring retracement of recent decline to 1.2600, then towards indicated resistance at 1.2663 which is likely to hold from here. Only a break above 1.2663 would suggest recent decline has ended instead, bring subsequent bounce to 1.2700 and later towards previous resistance at 1.2778.
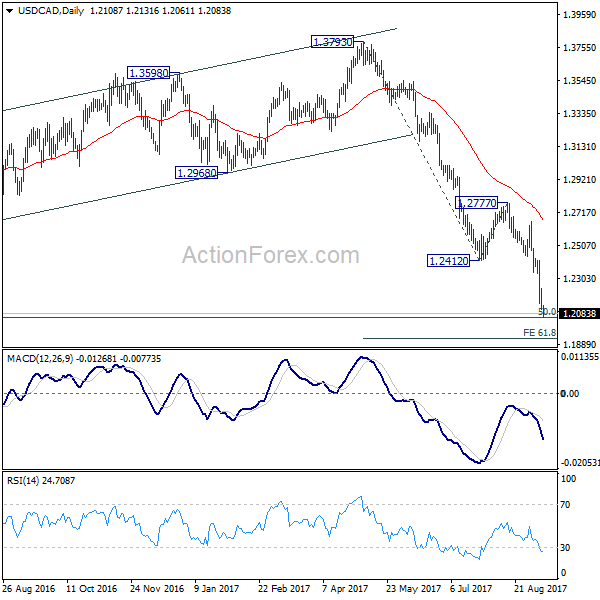
USD/CAD Daily Outlook
Daily Pivots: (S1) 1.2070; (P) 1.2155; (R1) 1.2202; More....
Intraday bias in USD/CAD remains on the downside as momentum remains strong. Firm break of long term fibonacci level at 1.2048 will carry larger bearish implication and target 61.8% projection of 1.3793 to 1.2412 from 1.2777 at 1.1924 next. On the upside, above 1.2245 minor resistance will turn intraday bias neutral first. But outlook will remain bearish as long as 1.2439 support turned resistance holds.
In the bigger picture, price actions from 1.4689 medium term top are seen as a correction pattern. Such corrective fall is expected to extend to 50% retracement of 0.9406 to 1.4869 at 1.2048. At this point, we'd look for strong support from there to contain downside and bring rebound. Break of 1.2777 resistance will indicate reversal and turn outlook bullish for 1.3793 key resistance. However, sustained break of 1.2048 will dampen this view and carry larger bearish implications and bring deeper decline to 61.8% retracement at 1.1424 and below.
Trade Idea : USD/CHF – Hold long entered at 0.9450
USD/CHF - 0.9450
Most recent candlesticks pattern : N/A
Trend : Down
Tenkan-Sen level : 0.9464
Kijun-Sen level : 0.9496
Ichimoku cloud top : 0.9571
Ichimoku cloud bottom : 0.9566
Original strategy :
Bought at 0.9450, Target: 0.9550, Stop: 0.9415
Position : - Long at 0.9450
Target : - 0.9550
Stop : - 0.9415
New strategy :
Hold long entered at 0.9450, Target: 0.9550, Stop: 0.9415
Position : - Long at 0.9450
Target : - 0.9550
Stop : - 0.9415
As the greenback has dropped again and has remained under pressure, marginal weakness from here cannot be ruled out, however, loss of near term downward momentum should prevent sharp fall below 0.9415-20 and prospect of a rebound remains, ab one the Kijun-Sen (now at 0.9496) would bring subsequent gain to 0.9550 but dollar needs to penetrate resistance at 0.9595 to signal low is formed.
In view of this, we are holding on to our long position entered at 0.9450. Below 0.9415-20 would risk weakness to 0.9390-00, having said that, further sharp fall below 0.9370-75 should not be repeated and reckon 0.9350 would hold from here, bring rebound later.