
Sample Category Title
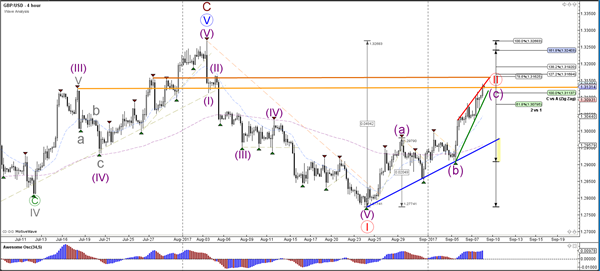
Trade Idea : GBP/USD – Buy at 1.3075
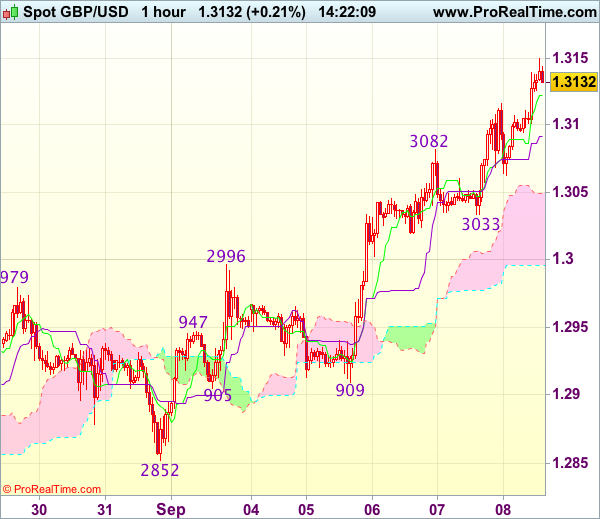
GBP/USD - 1.3133
Most recent candlesticks pattern : N/A
Trend : Near term up
Tenkan-Sen level : 1.3122
Kijun-Sen level : 1.3092
Ichimoku cloud top : 1.3049
Ichimoku cloud bottom : 1.2996
Original strategy :
Buy at 1.3000, Target: 1.3120, Stop: 1.2965
Position : -
Target : -
Stop : -
New strategy :
Buy at 1.3075, Target: 1.3175, Stop: 1.3045
Position : -
Target : -
Stop : -
As cable has surged again after brief pullback, adding credence to our bullish view that recent upmove from 1.2774 is still in progress and upside bias remains for further gain to 1.3175-80, then towards 1.3200, however, loss of near term upward momentum should prevent sharp move beyond 1.3225-30 and price should falter well below recent high at 1.3269, bring retreat later.
In view of this, would not chase this rise at current level and would be prudent to buy cable on subsequent pullback as 1.3070-80 should limit downside. Below the upper Kumo (now at 1.3049) would defer and risk test of support at 1.3033 (yesterday’s low) but only a drop below this level would confirm top is formed.
Market Update – Asian Session: North Korea In Focus As Weekend Approaches
Asia Summary
Asian equity markets opened mixed in line with what was seen in the US trading session. September Nikkei futures and options settled at 19,279.
In Japan, Q2 GDP growth was revised lower amid weaker CAPEX. According to the Japanese government, the downward revision in the GDP data was the largest under the current calculation method adopted in 2010.
China's Aug Trade Surplus was below ests amid weaker than expected exports and higher imports.
Fed official Dudley commented earlier in the Asian session and did not repeat expectation for a rate hike this year.
China's PBoC set the yuan stronger for the 10th straight session and amid this move, other Asian currencies, including the Taiwan dollar (TWD) and Hong Kong dollar (HKD) have moved higher against the broadly weaker US dollar.
Venezuela's President Maduro said he was planning a new FX basket to be ‘free' of the US dollar and the exchange mechanism to work with the Chinese yuan.
EUR/USD and AUD/USD have traded at highs not seen since 2015.
As the weekend approaches, North Korea is in focus following the nuclear test that it conducted last weekend. Earlier in the week, it was reported in the South Korean press that North Korea was said to be preparing another intercontinental ballistic missile (ICBM) launch and that it could come around Sat, Sept 9th.
Key economic data
(CN) CHINA AUG TRADE BALANCE: $42.0B V $48.5BE
(JP) JAPAN Q2 FINAL GDP SA Q/Q: 0.6% V 0.7%E; ANNUALIZED: 2.5% V 2.9%E
(JP) JAPAN JULY BOP CURRENT ACCOUNT ADJUSTED ¥2.03T V ¥1.65TE; CURRENT ACCOUNT BALANCE: ¥2.32T V ¥2.03TE; Trade Balance BoP Basis: ¥566.6B v ¥518Be
(JP) JAPAN BANK LENDING EX-TRUSTS Y/Y: 3.2% V 3.4%E; INCL TRUSTS Y/Y: 3.2% V 3.3% PRIOR
(AU) AUSTRALIA JULY HOME LOANS M/M: 2.9% V 1.0%E; INVESTMENT LENDING: -3.9% V +1.6% PRIOR
(NZ) NEW ZEALAND Q2 MFG ACTIVITY Q/Q: 3.9% V 2.8% PRIOR; MFG ACTIVITY VOLUME: +1.0% V -0.3% PRIOR
(CN) China Aug Retail Auto Sales: 1.9M units, +5.8% y/y - PCA
Speakers and Press
China
(CN) China's Air Force said to have conducted exercises near Korean peninsula – China State Media
Other
(AU) RBA Assist Gov Debelle: To move open-market operations to earlier time
(KR) South Korea: Exports to continue driving recovery; reiterates North Korea and trade negotiations risks to growth
(US) US House Majority Leader Mccarthy (R): House will vote on Harvey package on Friday
(US) Fed's George (hawk, non-voter): US under full employment, sees labor market continuing to tighten; inflation relatively mild; It is time to continue to move rates higher.
(US) Fed's Dudley (voter): Reiterates balance sheet rolloff likely to start relatively soon; Don't expect Harvey to alter trajectory of US economy
(VE) Venezuela President Maduro: To adopt new FX basket to be 'free' of the US dollar, next week DICOM exchange mechanism to work with China yuan instead of US dollar
Asian Equity Indices/Futures (00:30ET)
Nikkei -0.5%, Hang Seng +0.6%, Shanghai Composite +0.2%, ASX200 -0.4%, Kospi -0.1%
Equity Futures: S&P500 -0.2 ; Nasdaq -0.1 , Dax -0.2% , FTSE100 -0.1%
FX ranges/Commodities/Fixed Income (00:30ET)
EUR 1.2018-1.2090 ; JPY 108.05-108.49; AUD 0.8043-0.8116; NZD 0.7228-0.7325
Aug Gold +0.2% at 1,354/oz; Aug Crude Oil +0.2% at $49.17/brl; Sept Copper -0.2% at $3.14/lb
GLD SPDR Gold Trust ETF daily holdings flat at 836.9 tons
(CN) PBOC SETS YUAN REFERENCE RATE AT: 6.5032 V 6.5269 PRIOR (10TH STRAIGHT STRONGER YUAN SETTING); strongest yuan fix since May 12, 2016
(CN) PBOC SKIPS OMO V SKIPPED PRIOR; For the week drains a net of CNY330B in liquidity vs CNY280B prior week; PBoC: Reiterated bank liquidity at 'relatively high level'
(AU) Australia sells A$500M in 5.75% May 2021 Bonds, avg yield 2.0164%, bid to cover 7.04x (highest since at least 2007)
Equities notable movers
South Korea
Hyundai Motor, 005380.KR Negotiating payments with supplier for one of its Chinese plants; -2.9%
US markets on close: Dow -0.1%, S&P500 flat%, Nasdaq +0.1%, Russell -0.3%
Best Sector in S&P500: Health Care +1.1%
Worst Sector in S&P500: Financials -1.7%
At the close: VIX 11.55 (-0.08 pts); Treasuries: 2-yr 1.29% (-5bps), 10-yr 2.06% (-9bps), 30-yr 2.68% (-9bps)
US Market Summary
Equities traded flat to slightly lower today as the effects of Harvey and expectations for Irma begin to take their toll. US jobless claims came in the highest this week in two years. Media stocks were particularly hard hit after cautious management commentary at a conference, with Walt Disney and Comcast weighing on the broader market. The Nasdaq managed to buck the general trend with help from Microsoft and Amazon. Crude oil prices pared recent rises but held its ground on lower than expected increase in crude oil stocks; price dropped less than 0.1% on the day after having been lower. Treasury yields declined across the curve as investors reacted to more dovish comments from Fed officials; 10-year and 30-year yields dropped 6 bps each to 2.04% and 2.66% respectively. Gold continued to climb for a 9th consecutive session, reaching a new recent high at $1,349.52, before closing slightly lower.
US Afterhours Movers
KURA Announces positive Phase 2 study for Tipifarnib in HRAS Mutant Head and Neck Cancer; +22.3% afterhours
ZUMZ Reports Q2 -$0.02 v -$0.06e, Rev $192.2M v $191Me; Guides Q3 $0.43-0.48 v $0.43e, R$236-241M v $227Me, SSS +4-6%; +9.5% afterhours
BV Reports Q1 $0.04 v -$0.00e, Rev $52.2M v $49.7Me- Adjusted EBITDA $6.7M v $3.9M y/y; +6.2% afterhours
EFX Announces cybersecurity incident involving consumer information; potentially impacts 143M US consumers; credit card numbers for 209K consumers were accessed; -5.4% afterhours
FNSR Reports Q1 $0.40 v $0.40e, Rev $341.8M v $342Me; Guides Q2 $0.27-0.33 v $0.49e, Rev $322-342M v $375Me; -7.6% afterhours
AOBC Reports Q1 $0.02 v $0.11e, Rev $129M v $148Me; Guides Q2 adj EPS $0.07-0.12 v $0.23e, Rev $140-150M v $164Me; -17% afterhours
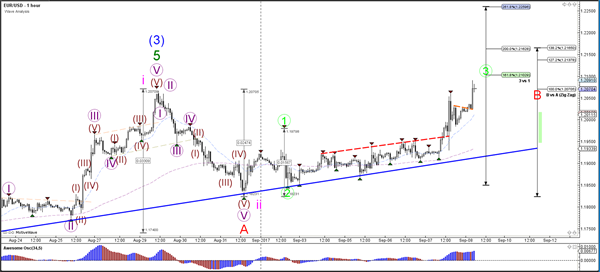
Trade Idea : EUR/USD – Buy at 1.1985
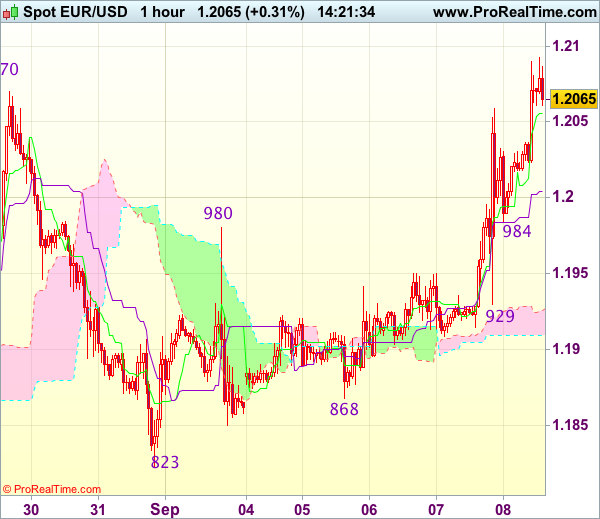
EUR/USD - 1.2063
Most recent candlesticks pattern : N/A
Trend : Up
Tenkan-Sen level : 1.2056
Kijun-Sen level : 1.2004
Ichimoku cloud top : 1.1926
Ichimoku cloud bottom : 1.1909
New strategy :
Buy at 1.1985, Target: 1.2090, Stop: 1.1950
Position : -
Target : -
Stop : -
Although the single currency has surged again after breaking above previous resistance at 1.2070 and bullishness remains for recent upmove to extend gain to 1.2100, loss of upward momentum should prevent sharp move beyond 1.2130-40 and reckon 1.2150-55 (61.8% projection of 1.1119-1.1910 measuring from 1.1662) would limit upside, price should falter below 1.2175-80, bring retreat later.
In view of this, would not chase this rise here and would be prudent to buy euro on subsequent pullback as support at 1.1980-84 should limit downside and bring another upmove later. Below 1.1950 (previous resistance turned support) would signal a temporary top is formed instead bring weakness to 1.1925-30 first.
Trade Idea : USD/JPY – Sell at 108.45
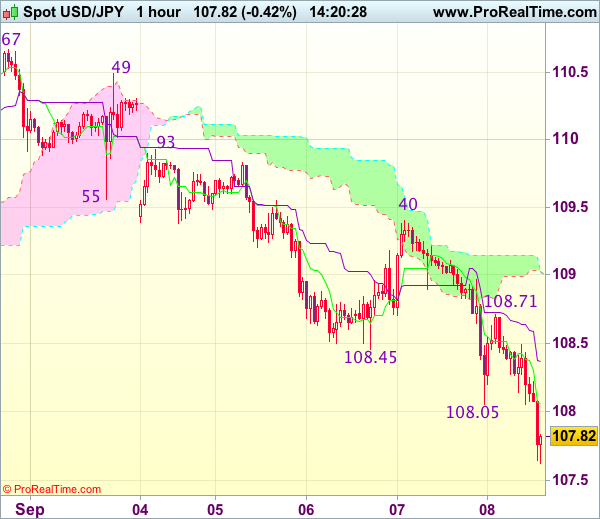
USD/JPY - 107.85
Most recent candlesticks pattern : N/A
Trend : Down
Tenkan-Sen level : 108.06
Kijun-Sen level : 108.37
Ichimoku cloud top : 109.02
Ichimoku cloud bottom : 109.02
Original strategy :
Sell at 108.75, Target: 107.75, Stop: 109.10
Position : -
Target : -
Stop : -
New strategy :
Sell at 108.45, Target: 107.45, Stop: 108.90
Position : -
Target : -
Stop : -
The greenback only recovered to 108.71 before dropping again as suggested (missed our short entry at 108.75) and price exceeded our indicated downside target at 107.75, bearishness remains for recent decline to extend further weakness to 107.50 and then 107.35-38 (61.8% projection of 114.50-108.73 measuring from 110.95), however, near term oversold condition should limit downside and reckon 106.80-82 (61.8% projection of 114.50-108.27 measuring from 110.67) would hold from here, bring rebound later.
In view of this, we are still looking to sell dollar on recovery but at a lower level as 108.45-50 should limit upside. Above said resistance at 108.71 would defer and risk rebound to 109.00, break there would suggest low is possibly formed but only break of indicated resistance at 109.40 would confirm and signal recent decline has ended instead.
European Open Briefing: Asian Equity Markets Were Mixed Early On Friday
Global Markets:
- Asian stock markets: Nikkei lost 0.51 %, Shanghai Composite gained 0.22 %, Hang Seng rose 0.62 %, ASX 200 fell 0.41 %
- Commodities: Gold at $1360.76 (+0.77 %), Silver at $18.27 (+0.86 %), WTI Oil at $49.23 (+0.29 %), Brent Oil at $54.76 (+0.50%)
- Rates: US 10-year yield at 2.03, UK 10-year yield at 0.975, German 10-year yield at 0.301
News & Data:
- CNY Trade Balance 287 B vs 337 B expected
- AUD Home Loans m/m 2.9 % vs 1.0 % expected
- GBP Halifax HPI m/m 1.1 % vs 0.2 % expected
- EUR Minimum Bid Rate 0.00 % vs 0.00 % expected
- CAD Building Permits m/m -3.5 % vs -1.5 % expected
- USD Unemployment Claims 298 K vs 245 K expected
- CAD Ivey PMI 56.3 vs 61.3 expected
- USD Crude Oil Inventories 4.6 M vs 4.1 M expected
- JPY Final GDP q/q 0.6 % vs 0.7 % expected
- Oil mixed, Brent rises as Irma casts shadow over Harvey recovery- RTRS
Markets Update:
Asian equity markets were mixed early on Friday, supported by solid Chinese trade data, while the dollar posted broad losses after European Central Bank chief Mario Draghi suggested the central bank may begin tapering its massive stimulus programme this autumn.
USDJPY is currently seen trading below 107.70. The US dollar continued to lose value as it fell over 2 percent this week against the Yen, moving back below a 10-month low of 108.05 touched earlier this week. The Yen continued to rally on global cues in spite of the Japanese GDP for Q2 was revised lower for its 'final', 0.6 % against the expected 0.7 %
EURUSD is currently seen trading over 1.2080 leaping to its highest since January of 2015, gaining over 1.7 percent for the week. The dollar tumbled to its weakest levels since the start of 2015 as investors girded for potential economic damage to Florida from the historically powerful Hurricane Irma. The euro gained momentum after the European Central Bank stopped short of attempting to jawbone it lower.
The Australian dollar climbed to trade at over 81.10 U.S. cents following a 0.8 percent increase against the US Dollar. Australian home loans data came in positive at 2.9 % against the expected 1.0 %. Likewise, the New Zealand dollar rallied against the US dollar reaching highs of over 0.7330, gaining over 100 pips for the day.
Upcoming Events:
- 08:30 GMT – (AUD) RBA Gov Lowe Speaks
- 08:30 GMT – (GBP) Manufacturing Production m/m
- 08:30 GMT – (GBP) Goods Trade Balance
- 12:30 GMT – (CAD) Employment Change
- 12:30 GMT – (CAD) Unemployment Rate
- 12:45 GMT – (USD) FOMC Member Harker Speaks
Daily Technical Outlook And Review: EUR/USD, GBP/USD, AUD/USD, USD/JPY, USD/CAD, USD/CHF, DOW 30, GOLD
A note on lower timeframe confirming price action...
Waiting for lower timeframe confirmation is our main tool to confirm strength within higher timeframe zones, and has really been the key to our trading success. It takes a little time to understand the subtle nuances, however, as each trade is never the same, but once you master the rhythm so to speak, you will be saved from countless unnecessary losing trades. The following is a list of what we look for:
- A break/retest of supply or demand dependent on which way you're trading.
- A trendline break/retest.
- Buying/selling tails ... essentially we look for a cluster of very obvious spikes off of lower timeframe support and resistance levels within the higher timeframe zone.
- Candlestick patterns. We tend to only stick with pin bars and engulfing bars as these have proven to be the most effective.
We typically search for lower-timeframe confirmation between the M15 and H1 timeframes, since most of our higher-timeframe areas begin with the H4. Stops are usually placed 1-3 pips beyond confirming structures.
EUR/USD
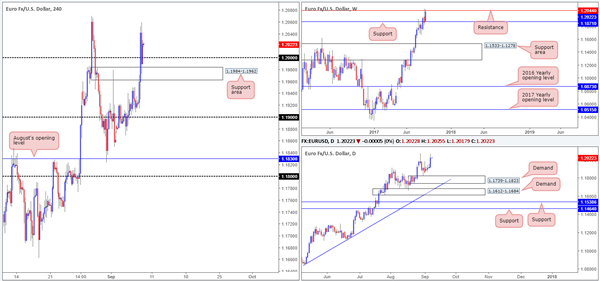
The shared currency aggressively advanced as Draghi took to the stage on Thursday. The move saw H4 price run through offers at 1.20 and shake hands with weekly resistance marked at 1.2044, mildly paring gains going into the close. As you can see, however, Thursday’s segment concluded trade above 1.20, giving the bulls a slight edge this morning.
Looking over to the USDX, a major weekly support at 11854 was breached on Thursday, potentially clearing the path south for weekly candles to connect with support at 11687. Despite this, we could see dollar recovery a tad before this level as there’s a daily channel support etched from the low 12351 that converges closely with H4 support at 11787.
Suggestions: Our immediate thinking here was to attempt to buy from 1.20, but with weekly resistance at 1.2044 looming over this level like a threatening rain cloud, we’re slightly hesitant. By the same token, a short sub 1.20 is just as challenging given the nearby H4 support area pegged at 1.1984-1.1962.
Therefore, considering the above, we’ll remain on the sidelines for now and await further developments.
Data points to consider: FOMC Harker speaks at 1.45pm GMT+1.
Levels to watch/live orders:
- Buys: Flat (stop loss: N/A).
- Sells: Flat (stop loss: N/A).
GBP/USD
Trade update: stopped out at 1.3086 for a loss.
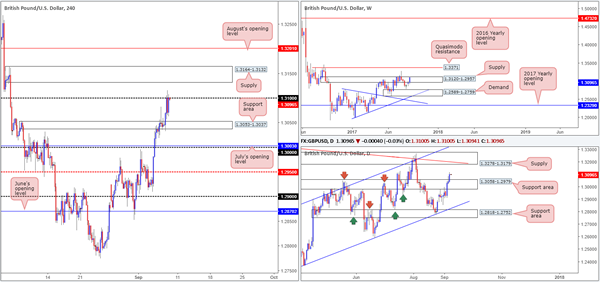
Despite solid gains recorded on the EUR and a considerable decline in the US dollar on Thursday, the British pound failed to sustain gains beyond the 1.31 handle. Continued rejection from 1.31 may see the H4 candles revisit the 1.3053-1.3037 area (a recently broken supply turned support area), whereas a move above 1.31 will almost immediately bring price into the arms of a supply area marked at 1.3164-1.3132.
The story over on the bigger picture shows daily action has recently engulfed the resistance area at 1.3058-1.2979 and now appears poised to challenge supply coming in at 1.3278-1.3179 (fuses with a trendline resistance taken from the high 1.3480). Be that as it may, let’s not forget that we still have weekly price trading within supply at 1.3120-1.2957 (albeit around the upper edge of this area).
Suggestions: Along similar lines to the EUR, we do not see any immediate trading opportunity at the moment. A buy above 1.31 would, as we highlighted above, place you in direct fire with H4 supply at 1.3164-1.3132 as well as weekly supply at 1.3120-1.2957. A sell from 1.31, although H4 structure shows a little more wiggle room down to the support area at 1.3053-1.3037, the trade would have you selling into potential daily (breakout) buyers.
Data points to consider: UK manufacturing production m/m at 9.30am. FOMC Harker speaks at 1.45pm GMT+1.
Levels to watch/live orders:
- Buys: Flat (stop loss: N/A).
- Sells: Flat (stop loss: N/A).
AUD/USD
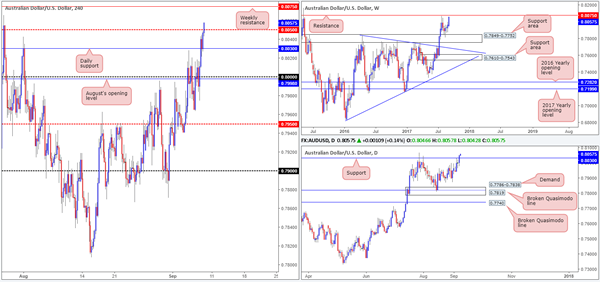
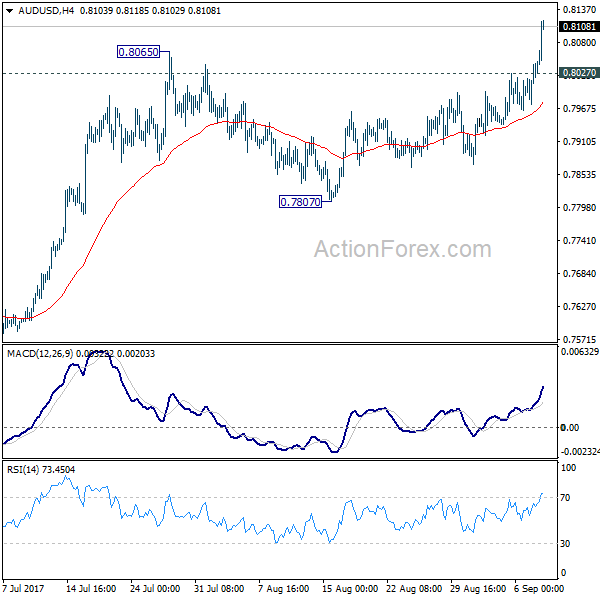
Kicking this morning’s analysis off with a look at the weekly timeframe, we can see that the pair’s recent advance has placed the unit within touching distance of resistance pegged at 0.8075. In conjunction with weekly flow, the daily candlesticks also recently crossed above a resistance level positioned at 0.8030, consequently opening up the path north to the noted weekly resistance barrier. Bouncing over to the H4 timeframe, price is, as we write, tackling the mid-level resistance at 0.8050. A decisive push above this number would, technically speaking, open the doors for the unit to greet the aforesaid weekly resistance level.
Suggestions: Put simply, the only place of interest, for us, is still the current weekly resistance level, which happens to stretch as far back as 1997! Whether or not this will turn to be a valid sell zone will depend entirely on how H4 price action responds. Preferably, we’d want a strong bearish candle form from here in the shape of a full, or near-full-bodied formation.
Data points to consider: RBA Assist Gov. Debelle speaks at 4am; RBA Gov. Lowe also takes the spotlight a few hours later at 9.30am. FOMC Harker speaks at 1.45pm GMT+1.
Levels to watch/live orders:
- Buys: Flat (stop loss: N/A).
- Sells: 0.8075 region ([waiting for a reasonably sized H4 bearish candle to form – preferably a full, or near-full-bodied candle – is advised] stop loss: ideally beyond the candle’s wick).
USD/JPY
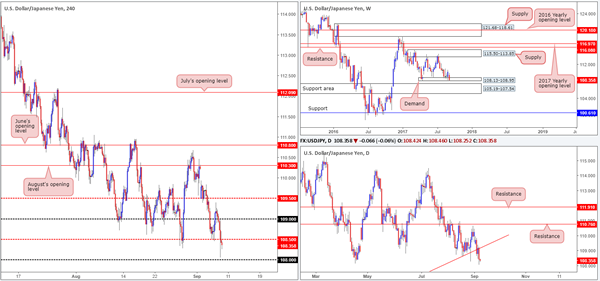
In recent trading, the USD/JPY failed to hold the 109 psychological support and ended the day sub 108.50. Providing that the bears defend 108.50, the next level of support can be seen at 1.08.
The recent move lower has also brought weekly price into the lower edge of demand at 108.13-108.95. With the weekly support seen on the USDX at 11854 recently engulfed, we may see this demand eventually taken out, which would lead to price almost immediately enter into the jaws of a large support area at 105.19-107.54. Looking down to the daily timeframe, a recent bounce off the underside of a broken trendline drawn from the low 100.83, has opened up the possibility of a move down to support at 106.81 (similar to the USDX daily timeframe – only the next downside target is a channel support etched from the low 12351).
Suggestions: With weekly price still trading within demand, entering short at 108.50 in an attempt to grab some of the potential downside advertised on the daily timeframe would be risky, in our opinion.
What about waiting for H4 price to close below 108 and look to trade any retest seen thereafter? This could be an option, but then you would have to contend with the top edge of the aforementioned weekly support area at 107.54!
No matter which way you look at shorts in this market, it has rather restricted structure. Therefore, our team’s position will remain flat going into today’s sessions.
Data points to consider: FOMC Harker speaks at 1.45pm. Japanese Final GDP q/q at 12.50am GMT+1.
Levels to watch/live orders:
- Buys: Flat (stop loss: N/A).
- Sells: Flat (stop loss: N/A).
USD/CAD
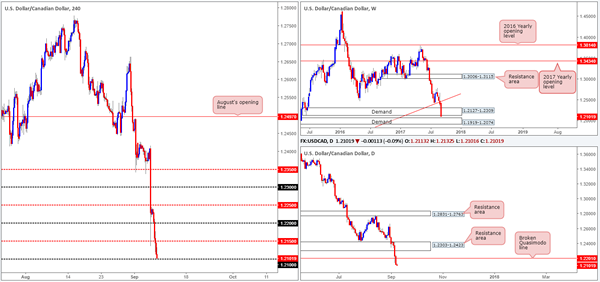
A heavily offered dollar saw the USD/CAD resume downside on Thursday, breaking the 1.22 handle and also the H4 mid-level support at 1.2150. With the 1.21 line next on tap, is there a chance that we’ll see the bulls make an appearance? Highly unlikely! We say this largely because weekly action recently crossed below demand at 1.2127-1.2309 and daily price also took out a Quasimodo support level at 1.2201.
The next downside target on the higher timeframes can be seen at a weekly demand area drawn from 1.1919-1.2074 (partner demand seen on the daily timeframe at 1.1919-1.2006). With that in mind, a short below 1.21, in our opinion, would be a challenge since price could essentially bounce from 1.2074 and rally higher.
Suggestions: With shorts not really a viable option at this time, and longs particularly dangerous from 1.21, we do not see any immediate opportunity to trade this pair. As such, remaining flat until more conducive price action presents itself is the route we have chosen to take.
Data points to consider: FOMC Harker speaks at 1.45pm. Canadian employment figures at 1.30pm GMT+1.
Levels to watch/live orders:
- Buys: Flat (stop loss: N/A).
- Sells: Flat (stop loss: N/A).
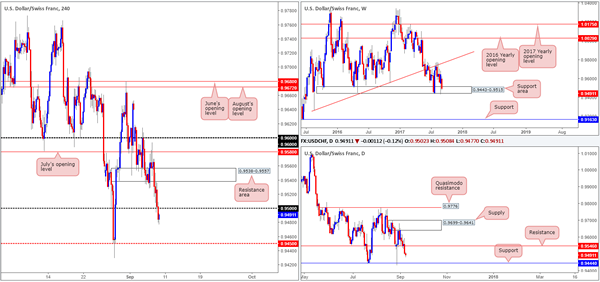
USD/CHF
During the course of yesterday’s sessions, the piece retested the underside of a resistance area coming in at 0.9538-0.9557, following the ECB meeting (seen clearer on the M30 timeframe). The initial move from this zone saw the candles challenge the 0.95 base line, but failed to hold as support and therefore ended the day sub 0.95.
The break below 0.95 has likely attracted seller interest, as there’s very little structure seen to the left of price until the H4 mid-level support at 0.9450, followed closely by daily support at 0.9444. Despite this, up on the weekly chart, price is still lingering within a support area marked at 0.9443-0.9515.
Suggestions: With weekly support over on the USDX at 11854 recently taken out, the current weekly support area here may have trouble holding firm. That being the case, a retest of 0.95 that holds ground and is bolstered by a lower-timeframe confirming sell structure (see the top of this report) may be worth shorting if risk/reward is acceptable.
Data points to consider: FOMC Harker speaks at 1.45pm GMT+1.
Levels to watch/live orders:
- Buys: Flat (stop loss: N/A).
- Sells: 0.95 region (waiting for a lower-timeframe sell signal to form is advised] stop loss: dependent on where one confirms this level).
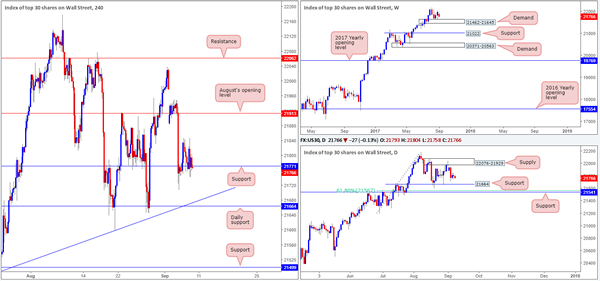
DOW 30:
It was a relatively quiet day in the US equity market on Thursday as H4 price teased support at 21771. In view of the somewhat lackluster performance yesterday, much of the following report will echo a similar bias reported in our previous analysis…
With weekly buyers seen holding above demand at 21462-21645, the H4 support could maintain a presence in this market and eventually drag the index up to August’s opening level at 21913. This is, of course, if daily sellers don’t flood the market to connect with the daily support positioned a little lower on the curve at 21664.
Our suggestions: Given that the index is still entrenched within an incredibly strong uptrend, we would only consider a long position if price crosses swords with the daily support mentioned above at 21664. Not only because of it converging with a H4 trendline support taken from the low 21484, but also because this will bring daily bulls into the picture as well as (nearby) weekly and H4 bulls.
Data points to consider: FOMC Harker speaks at 1.45pm GMT+1.
Levels to watch/live orders:
- Buys: 21664 region ([waiting for a reasonably sized H4 bullish candle to form – preferably a full, or near-full-bodied candle – is advised] stop loss: ideally beyond the candle’s tail).
- Sells: Flat (stop loss: N/A).
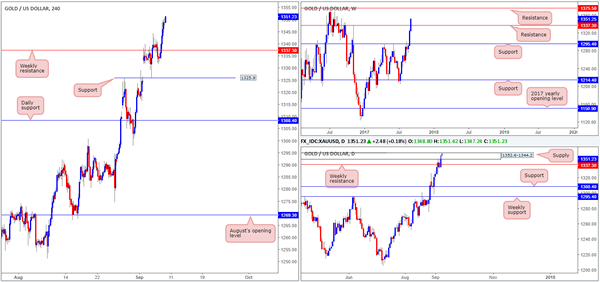
GOLD
Trade update: small loss taken at 1341.2.
Across the board, the US dollar collapsed against the majority of its trading peers, consequently forcing the yellow metal into positive territory. This has, as you can see, firmly pushed price beyond the weekly resistance level at 1337.3, but at the same time, also into the jaws of a daily supply zone pegged at 1352.6-1344.2.
According to weekly structure, the next upside target can be seen around the 1375.5ish range (another resistance), so there’s a chance that daily price may engulf the current supply it is trapped within right now. Therefore, selling is not really something we’d label high probability at the moment – even more so considering that the USDX weekly support also gave way recently at 11854. Buying on the other hand, would be something of interest ABOVE the current daily supply zone, but this is not something we’d personally show interest in UNTIL we see a daily close print beyond the area.
Our suggestions: On account of the noted structure, our team does not see much to hang their hat on at the moment. Therefore, remaining on the sidelines is the path we’ve chosen to take.
Levels to watch/live orders:
- Buys: Flat (stop loss: N/A).
- Sells: Flat (stop loss: N/A).
Daily Technical Analysis: EUR/USD Bullish Momentum Break Tests 1.21 Resistance Zone
Currency pair EUR/USD
The EUR/USD broke above the resistance trend line (dotted red) yesterday during the European Central Bank (ECB) statement. Price could now be in an uptrend as indicated by the 3 wave structure (pink) or still making a larger ABC (red) correction within wave 4 (blue).
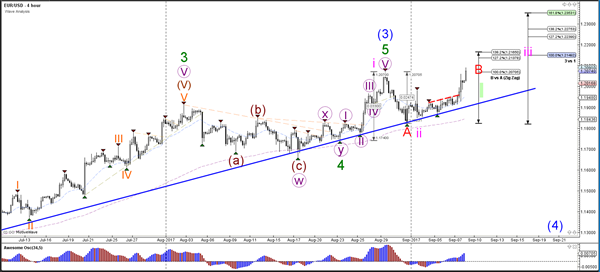
The EUR/USD could be resuming its uptrend with a potential wave 123 (green) if price manages to break above 1.21 and build a continuation chart pattern.
Currency pair GBP/USD
The GBP/USD broke above the 61.8% resistance Fibonacci retracement level of wave 2 vs 1 (red). Price is now testing the next resistance zone (orange) and 78.6% Fib.
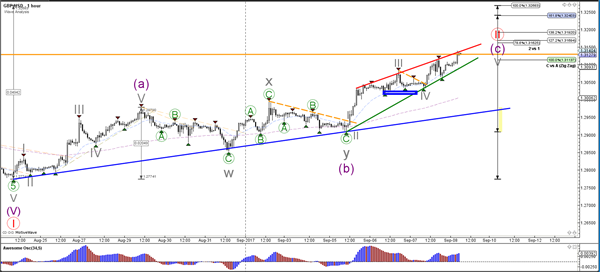
The GBP/USD respected the support zone (blue) and broke above the resistance trend line (dotted orange). Now price seems to be building a rising wedge chart pattern (red/green lines).
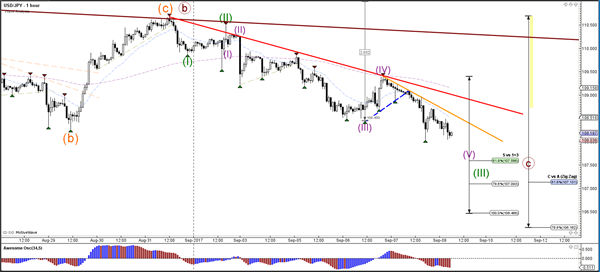
Currency pair USD/JPY
The USD/JPY is testing the lowest part of the support zone (green) but the downtrend could now be strong enough to break below it and move towards the Fib targets of wave C vs A.
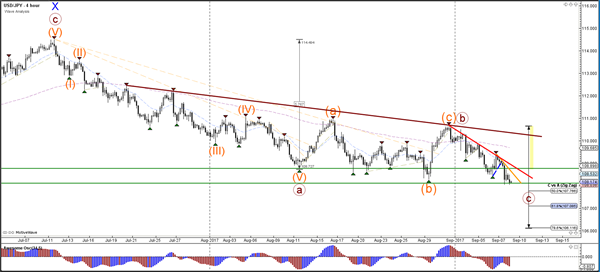
The USD/JPY could be moving in a wave 5 (purple) of wave 3 (green).
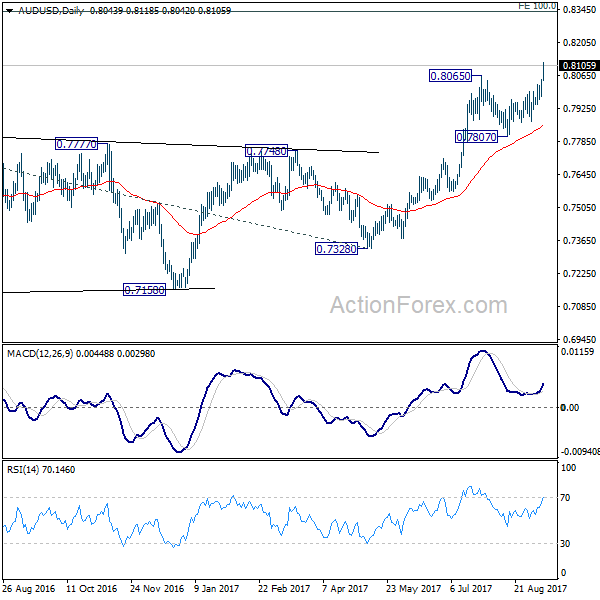
AUD/USD Daily Outlook
Daily Pivots: (S1) 0.7997; (P) 0.8022; (R1) 0.8071; More...
AUD/USD surges to as high as 0.8118 as recent rally finally resumes. Intraday bias is back on the upside for 100% projection of 0.6826 to 0.7833 from 0.7328 at 0.8335 next. On the downside, below 0.8027 minor support will turn intraday bias neutral first. But retreat should be contained well above 0.7807 support to bring rally resumption.
In the bigger picture, rise from 0.6826 medium term bottom is still in progress. At this point, there is no confirmation of trend reversal yet and we'll continue to treat such rebound as a corrective pattern. But in any case, break of 55 month EMA (now at 0.8087) will target 38.2% retracement of 1.1079 to 0.6826 at 0.8451. Break of 0.7807 support is needed to to be the first sign of completion of the rebound. Otherwise, further rise is now in favor.
Hurricane Irma Outweighs Tax Reform Talks
Greenback Tumbles as Hurricane Irma Looms. The Greenback logged in another session in the red despite talks of tax reform as Hurricane Irma, which has become one of the biggest storms ever measured poses another threat to growth. The dollar index sank to the 91.4 area – a level not seen since January 15.
Euro Rocks after ECB Meeting. The euro got a big boost this morning after the European Central Bank made its monetary policy statement. As expected, the ECB decided to hold its interest rate unchanged during its two-day meeting. The ECB meeting also gave the market a good sense of the overall policy direction, and hints on the central bank’s tapering plan.
Gold Breaks Out. The weak dollar and geopolitical concerns fueled the rally of precious metals, indicating that traders are not in the mood to increase risk appetite just yet. Gold is up 1.14% to $1,354.31 per troy ounce. Silver is up 1.70% to $18.214 per troy ounce.
Oil Markets Move Little With Industry. Oil prices were little changed on Friday as the international petroleum industry remains in the grip of Caribbean hurricanes which have hit the region for the last two weeks. Brent crude futures LCOc1, the benchmark for oil prices outside the United States, were up 11 cents to $54.60 a barrel. As of Thursday, about 3.8 million barrels of daily U.S. refining capacity, or about 20 percent, was still shut. Traders said it would take weeks for the U.S. petroleum industry to return to full capacity, and that under the current conditions it was difficult to identify fundamental market trends.
Watch Out Today For:
08:30 am GMT: GBP Consumer Inflation Expectations
08:30 am GMT: AUD RBA’s Governor Philip Lowe Speech
12:30 pm GMT: CAD Unemployment Rate, Net Change in Employment
Dollar Under Fresh Selling Pressure as Event Risks Most Passed
Fresh selling is seen in Dollar as most of the event risks for the week are past. Weakness in Dollar is also accompanied by falling treasury yield, with 10 year yield closed down -0.047 at 2.061. USD/JPY finally takes out 108.12 key support level in Asian session, resuming medium term fall from 118.65. EUR/USD was also lifted after ECB meeting yesterday and took out near term resistance at 1.2069. But for the week, commodity currencies are particularly strong. USD/CAD also started diving early this week after BoC's rate hike. 1.2 handle is now within touching distance and Canadian Dollar will look into employment data for further strength. AUD/USD also takes out 0.8065 resistance today to resume larger rally. In other markets, gold continues to extend recent strong rise and is trading above 1360 handle now. WTI crude oil, however, is struggling to take out 50 handle again.
Hawkish Fedspeaks give no support to Dollar
Comments from Fed officials were hawkish yesterday, but they give little support to the greenback. New York Fed President William Dudley maintained that "even though inflation is currently somewhat below our long-run objective", it is "still appropriate to continue to remove monetary policy accommodation gradually". He noted that, with dollar's depreciation and "fading of effects from a number of temporary, idiosyncratic factors", inflation will climb back to 2% target over the "medium term". And Dudley expects the US economy to "continue to perform quite well".
Cleveland Fed President Loretta Mester also noted that "if economic conditions evolve as anticipated, I believe further removal of accommodation via gradual increases in the fed funds rate will be needed and will help sustain the expansion". And she advocates that raising interest rate periodically "removes policy ambiguity at a time when uncertainty seems to be rising on other fronts."
ECB hinted at October announcement
Yesterday, ECB left the policy rates unchanged as widely expected. It also kept the QE program at a pace of 60B euro per month until end of 2017, or longer if needed. At the press conference, President Mario Draghi acknowledged in the post meeting press conference that growth in the Eurozone is solid and broad-based. At the same time Draghi also promised to "decide on the calibration" of its policy instruments beyond this Autumn. He went further to say that the "bulk of the decisions" will come at the October meeting. Regarding a recent hot topic in exchange rate, Draghi noted that a "few" members express concerned back in July. And those concerns were reiterated by "most" members this time. And recent volatility in the exchange rate is seen as a source of uncertainty that requires monitoring. Nonetheless, while financial conditions "unquestionably tightened" following Euro's rise, they remain "broadly supportive" for non-financial enterprises.
More on ECB:
- Draghi Showed "Disaffection" Over Subdued Inflation, Admitted Discussions on QE Tapering
- ECB Review: Warming Up To QE Extension In October
- Draghi The Master Of Central Bank Voodoo
- ECB: Monetary Policy Unchanged, But Changes to be Announced this October
- Euro Fluctuates after ECB; Little New from Draghi
China exports softened as trade surplus narrowed
China's trade surplus narrowed to USD 42.0b in August, from USD 46.7B and missed expectation of USD 48.6b. Imports grew 13.3% yoy, well above expectation of 10.0% yoy. Imports also maintained July's pace at 11.0% yoy. However, exports softened and grew only 5.5%, below expectation of 6.0% yoy and notably slower than July's 7.2% yoy. China's foreign current reserves rose for a seven straight month in August. Reserves jumped USD 10.81b to USD 3.092T. But the number was well below economists expectation of USD 19b.
Also from Asia Pacific, Japan Q2 GDP was finalized at 0.6% qoq, down from prior estimate of 1.0% qoq and below expectation of 0.7% qoq. GDP deflator dropped -0.4% Yoy. Japan current account surplus widened to JPY 2.03T in July, bank lending rose 3.2% yoy in August. Australia home loan rose 2.9% in July. New Zealand manufacturing activity rose 3.9% in Q2.
Looking ahead
UK data will dominate European session with industrial and manufacturing production, construction output, trade balance featured. Swiss will release unemployment rate while Germany will release trade balance. Canada employment data will be the main focus in US session.
AUD/USD Daily Outlook
Daily Pivots: (S1) 0.7997; (P) 0.8022; (R1) 0.8071; More...
AUD/USD surges to as high as 0.8118 as recent rally finally resumes. Intraday bias is back on the upside for 100% projection of 0.6826 to 0.7833 from 0.7328 at 0.8335 next. On the downside, below 0.8027 minor support will turn intraday bias neutral first. But retreat should be contained well above 0.7807 support to bring rally resumption.
In the bigger picture, rise from 0.6826 medium term bottom is still in progress. At this point, there is no confirmation of trend reversal yet and we'll continue to treat such rebound as a corrective pattern. But in any case, break of 55 month EMA (now at 0.8087) will target 38.2% retracement of 1.1079 to 0.6826 at 0.8451. Break of 0.7807 support is needed to to be the first sign of completion of the rebound. Otherwise, further rise is now in favor.
Economic Indicators Update
| GMT | Ccy | Events | Actual | Forecast | Previous | Revised |
|---|---|---|---|---|---|---|
| 22:45 | NZD | Manufacturing Activity Q2 | 3.90% | 2.80% | 3.10% | |
| 23:50 | JPY | GDP Q/Q Q2 F | 0.60% | 0.70% | 1.00% | |
| 23:50 | JPY | GDP Deflator Y/Y Q2 F | -0.40% | -0.40% | -0.40% | |
| 23:50 | JPY | Current Account (JPY) Jul | 2.03T | 1.65T | 1.52T | |
| 23:50 | JPY | Bank Lending incl Trusts Y/Y Aug | 3.20% | 3.30% | 3.30% | |
| 1:30 | AUD | Home Loans Jul | 2.90% | 1.00% | 0.50% | 1.20% |
| 3:00 | CNY | Trade Balance (USD) Aug | 42.0B | 48.6B | 46.7B | |
| 3:00 | CNY | Trade Balance (CNY) Aug | 287B | 337B | 321B | |
| 5:00 | JPY | Eco Watchers Survey Current Aug | 49.7 | 49.5 | 49.7 | |
| 5:45 | CHF | Unemployment Rate Aug | 3.20% | 3.20% | ||
| 6:00 | EUR | German Trade Balance (EUR) Jul | 21.5B | 21.2B | ||
| 8:30 | GBP | Industrial Production M/M Jul | 0.20% | 0.50% | ||
| 8:30 | GBP | Industrial Production Y/Y Jul | 0.30% | 0.30% | ||
| 8:30 | GBP | Manufacturing Production M/M Jul | 0.30% | 0.00% | ||
| 8:30 | GBP | Manufacturing Production Y/Y Jul | 1.70% | 0.60% | ||
| 8:30 | GBP | Construction Output M/M Jul | -0.30% | -0.10% | ||
| 8:30 | GBP | Visible Trade Balance (GBP) Jul | -12.1B | -12.7B | ||
| 12:00 | GBP | NIESR GDP Estimate Aug | 0.20% | |||
| 12:30 | CAD | Capacity Utilization Rate Q2 | 85.00% | 83.30% | ||
| 12:30 | CAD | Net Change in Employment Aug | 15.0K | 10.9K | ||
| 12:30 | CAD | Unemployment Rate Aug | 6.30% | 6.30% | ||
| 14:00 | USD | Wholesale Inventories Jul F | 0.40% | 0.40% |