Sample Category Title
USD/CHF Mid-Day Outlook
Daily Pivots: (S1) 0.9468; (P) 0.9530; (R1) 0.9568; More....
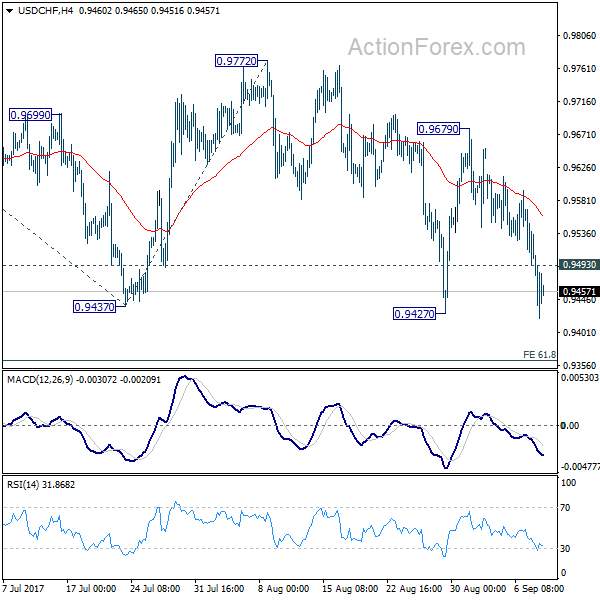
Intraday bias in USD/CHF remains on the downside for the moment. Whole decline from 1.0342 should be resuming. Next target will be 61.8% projection of 1.0099 to 0.9437 from 0.9772 at 0.9363. On the upside, above 0.9493 minor resistance will turn bias neutral first. But outlook will stay bearish as long as 0.9679 resistance holds.
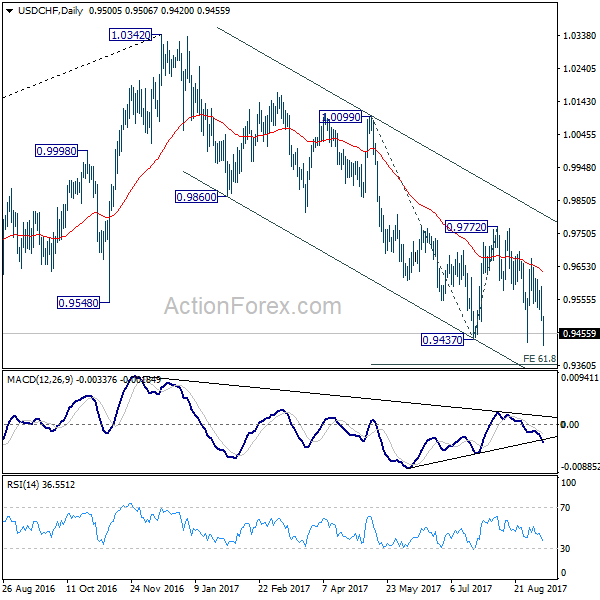
In the bigger picture, current development suggests that 0.9443 key support (2016 low) could be taken out firmly as down trend form 1.0342 extends. There are various interpretation of the price actions. But in any case, medium term outlook will stay bearish as long as 0.9772 resistance holds. Current down trend could extend to 38.2% retracement of 0.7065 (2011 low) to 1.0342 (2016 high) at 0.9090. However, break of 0.9772 will indicate that USD/CHF has successfully defended 0.9443 again and turn outlook bullish for 1.0099 resistance.
USD/JPY Mid-Day Outlook
Daily Pivots: (S1) 107.91; (P) 108.59; (R1) 109.13; More...
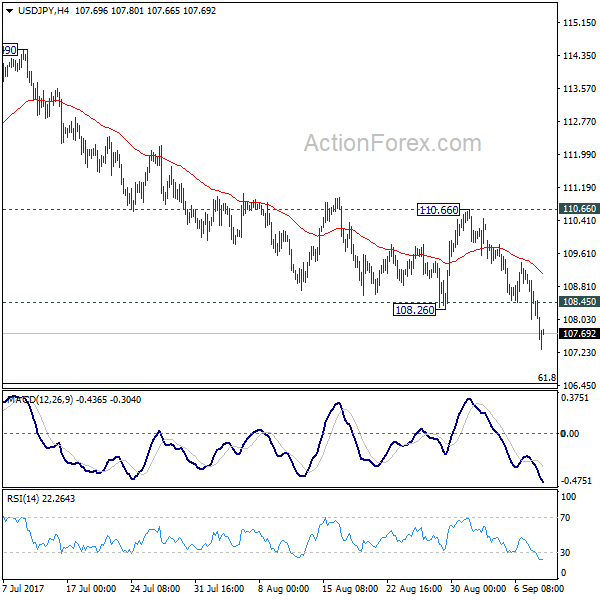
Intraday bias in USD/JPY remains on the downside as the medium term decline from 118.65 has just resumed. Further fall should be seen to 61.8% retracement of 98.97 to 118.65 at 106.48. We'll look for support from there again to bring rebound. On the upside, above 108.45 minor resistance will turn intraday bias neutral first. But outlook will now stay bearish as long as 110.66 resistance holds.
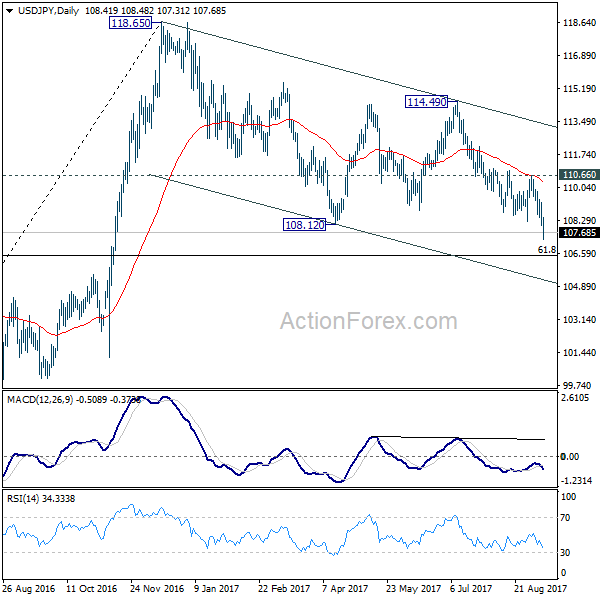
In the bigger picture, pull back from 118.65 is viewed as a corrective pattern for the moment and downside should be contained by 61.8% retracement of 98.97 to 118.65 at 106.48 and bring rebound. Rise from 98.97 is expected to extend later to retest 125.85 high. However, sustained break of 106.48 will dampen this view and bring deeper fall to retest 98.97 instead.
GBP/USD Mid-Day Outlook
Daily Pivots: (S1) 1.3049; (P) 1.3082; (R1) 1.3132; More...
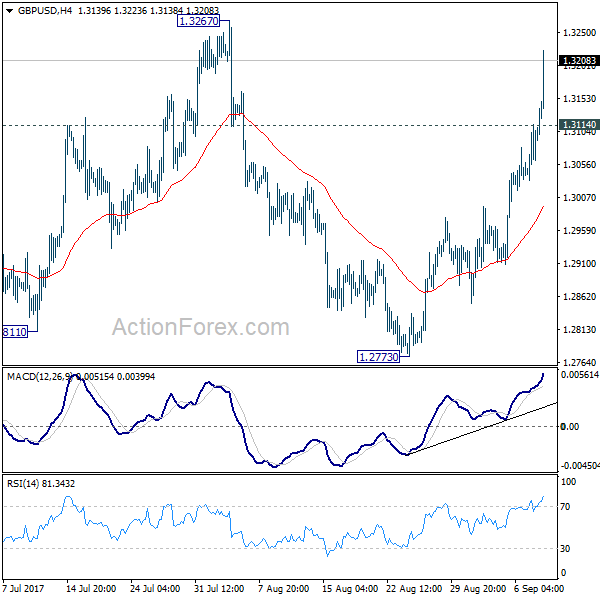
GBP/USD rises further to as high as 1.3223 so far and intraday bias remains on the upside for 1.3267 resistance. Break there will extend larger rally from 1.1946 to 1.3444 key resistance level next. Price actions from 1.1946 are still seen as a corrective pattern. Hence, we'd expect strong resistance from 1.3444 to limit upside to bring larger down trend reversal eventually. On the downside, below 1.3114 minor support will turn intraday bias neutral first.
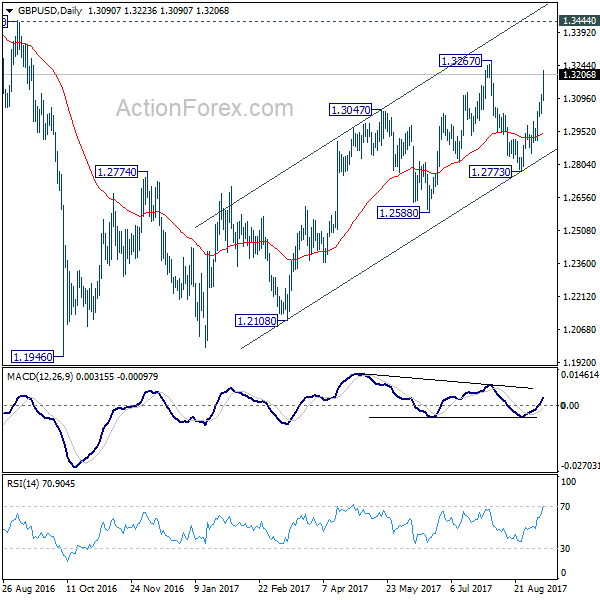
In the bigger picture, overall, price actions from 1.1946 medium term low are seen as a corrective pattern. While further rise cannot be ruled out, larger outlook remains bearish as long as 1.3444 key resistance holds. Down trend from 1.7190 (2014 high) is expected to resume later after the correction completes. And break of 1.2588 will indicate that such down trend is resuming.
Dollar Selloff Accelerates ahead of Weekend on Concern North Korea
Dollar's selloff accelerates today as markets are concerned of any more geopolitical risks during the week end. It will be North Korea's Foundation Day on Saturday and Pyongyang might just launch another missile to celebrate. At the same time, another hurricane Irma will likely make landfall in Florida late Saturday of early Sunday. In the background, the surprised early resignation of Fed Vice Chair Stanley Fischer created even more uncertainty in Fed as Janet Yellen's future as Fed Chair is unknown. Euro, despite being lifted against Dollar after ECB, could follow as the second weakest for the week.
Meanwhile, Canadian Dollar is set to end as the biggest winner of the week, as boosted by BoC rate hike as solid job data. The Canadian job market grew 22.2k in August, above expectation of 15.0k. Unemployment rate dropped to 6.2%, below expectation of 6.3%. That matched recent low back in October 2008. Capacity utilization rose to 85.0% in Q2.
Sterling surges after solid production data
Sterling surges against dollar today as lifted by solid production data. Some strength is seen against Euro, but the pound struggles to breakout against Yen. Industrial production rose 0.2% mom, 0.4% yoy in July, versus expectation of 0.2% mom, 0.3% yoy. Manufacturing production rose 0.5% mom, 1.9% yoy versus expectation of 0.3% mom, 1.7% yoy. NEISR GDP estimate rose 0.4% in August. Trade deficit narrowed to GBP -11.6b in July versus expectation of GBP -12.1b. However, construction output dropped -0.9% mom in July. Also from Europe, German trade surplus narrowed to EUR 19.5b in July. Swiss unemployment rate was unchanged at 3.2% in August.
China exports softened as trade surplus narrowed
China's trade surplus narrowed to USD 42.0b in August, from USD 46.7B and missed expectation of USD 48.6b. Imports grew 13.3% yoy, well above expectation of 10.0% yoy. Imports also maintained July's pace at 11.0% yoy. However, exports softened and grew only 5.5%, below expectation of 6.0% yoy and notably slower than July's 7.2% yoy. China's foreign current reserves rose for a seven straight month in August. Reserves jumped USD 10.81b to USD 3.092T. But the number was well below economists expectation of USD 19b.
Also from Asia Pacific, Japan Q2 GDP was finalized at 0.6% qoq, down from prior estimate of 1.0% qoq and below expectation of 0.7% qoq. GDP deflator dropped -0.4% Yoy. Japan current account surplus widened to JPY 2.03T in July, bank lending rose 3.2% yoy in August. Australia home loan rose 2.9% in July. New Zealand manufacturing activity rose 3.9% in Q2.
GBP/USD Mid-Day Outlook
Daily Pivots: (S1) 1.3049; (P) 1.3082; (R1) 1.3132; More...
GBP/USD rises further to as high as 1.3223 so far and intraday bias remains on the upside for 1.3267 resistance. Break there will extend larger rally from 1.1946 to 1.3444 key resistance level next. Price actions from 1.1946 are still seen as a corrective pattern. Hence, we'd expect strong resistance from 1.3444 to limit upside to bring larger down trend reversal eventually. On the downside, below 1.3114 minor support will turn intraday bias neutral first.
In the bigger picture, overall, price actions from 1.1946 medium term low are seen as a corrective pattern. While further rise cannot be ruled out, larger outlook remains bearish as long as 1.3444 key resistance holds. Down trend from 1.7190 (2014 high) is expected to resume later after the correction completes. And break of 1.2588 will indicate that such down trend is resuming.
Economic Indicators Update
| GMT | Ccy | Events | Actual | Forecast | Previous | Revised |
|---|---|---|---|---|---|---|
| 22:45 | NZD | Manufacturing Activity Q2 | 3.90% | 2.80% | 3.10% | |
| 23:50 | JPY | GDP Q/Q Q2 F | 0.60% | 0.70% | 1.00% | |
| 23:50 | JPY | GDP Deflator Y/Y Q2 F | -0.40% | -0.40% | -0.40% | |
| 23:50 | JPY | Current Account (JPY) Jul | 2.03T | 1.65T | 1.52T | |
| 23:50 | JPY | Bank Lending incl Trusts Y/Y Aug | 3.20% | 3.30% | 3.30% | |
| 01:30 | AUD | Home Loans Jul | 2.90% | 1.00% | 0.50% | 1.20% |
| 03:00 | CNY | Trade Balance (USD) Aug | 42.0B | 48.6B | 46.7B | |
| 03:00 | CNY | Trade Balance (CNY) Aug | 287B | 337B | 321B | |
| 05:00 | JPY | Eco Watchers Survey Current Aug | 49.7 | 49.5 | 49.7 | |
| 05:45 | CHF | Unemployment Rate Aug | 3.20% | 3.20% | 3.20% | |
| 06:00 | EUR | German Trade Balance (EUR) Jul | 19.5B | 21.5B | 21.2B | |
| 08:30 | GBP | Industrial Production M/M Jul | 0.20% | 0.20% | 0.50% | |
| 08:30 | GBP | Industrial Production Y/Y Jul | 0.40% | 0.30% | 0.30% | |
| 08:30 | GBP | Manufacturing Production M/M Jul | 0.50% | 0.30% | 0.00% | |
| 08:30 | GBP | Manufacturing Production Y/Y Jul | 1.90% | 1.70% | 0.60% | |
| 08:30 | GBP | Construction Output M/M Jul | -0.90% | -0.30% | -0.10% | |
| 08:30 | GBP | Visible Trade Balance (GBP) Jul | -11.6B | -12.1B | -12.7B | |
| 12:00 | GBP | NIESR GDP Estimate Aug | 0.40% | 0.20% | ||
| 12:30 | CAD | Capacity Utilization Rate Q2 | 85.00% | 85.00% | 83.30% | |
| 12:30 | CAD | Net Change in Employment Aug | 22.2K | 15.0K | 10.9K | |
| 12:30 | CAD | Unemployment Rate Aug | 6.20% | 6.30% | 6.30% | |
| 14:00 | USD | Wholesale Inventories Jul F | 0.40% | 0.40% |
EUR/JPY Candlestick Patterns Suggest Further Downside
The EUR/JPY has been making lower highs and lower lows and the previous retracement has broken the trend line suggesting further downside. If the price gets to 130.10-28 POC (trend line, X cross, EMA89, D L3, WL3, 50.0) we might see another rejection towards 129.50. Break of 129.50 should target 120.20 and only a high downside momentum can push the price towards 128.69 - Weekly camarilla L5 support.
W L3 - Weekly Camarilla Pivot (Weekly Interim Support)
W H3 - Weekly Camarilla Pivot (Weekly Interim Resistance)
W H4 - Weekly Camarilla Pivot (Strong Weekly Resistance)
D H4 - Daily Camarilla Pivot (Very Strong Daily Resistance)
D L3 – Daily Camarilla Pivot (Daily Support)
D L4 – Daily H4 Camarilla (Very Strong Daily Support)
POC - Point Of Confluence (The zone where we expect price to react aka entry zone)
DAX Climbs to 7-Week High as ECB Keeps Door Open to Further Stimulus
The DAX index is unchanged in the Friday session, trading at 12,297.50, up 0.01% on the day. On Thursday, the index climbed to a high of 12,363.60, its highest level since July 24. On the release front, there is only one event on the schedule. Germany's trade surplus narrowed to EUR 19.5 billion, short of the forecast of EUR 20.3 billion.
Is the ECB sending out mixed signals about its quantitative easing (QE) program? One could make that argument after the ECB policy meeting on Thursday. The QE program, in which the ECB purchases EUR 60 billion/month, is slated to end in December, and the markets were hoping for some guidance about the ECB's plans. The rate announcement was surprisingly dovish, as policymakers said that QE would not be tapered before December, and left the door open to further stimulus in 2018, if necessary. However, Mario Draghi presented a more hawkish stance in his follow-up press conference, saying that the ECB would make a decision on how to scale back stimulus in October. In his remarks, Draghi made direct reference to the exchange rate, noting that "the recent volatility in the exchange rate represents a source of uncertainty which requires monitoring". Draghi & Co. are clearly concerned by the euro's appreciation, as the EUR/USD has soared 14 percent in 2017. The stronger euro has made imports less expensive, thus reducing inflation and hampering the ECB's efforts to raise inflation levels. The ECB has now cut its inflation forecast to 1.2 percent in 2018 and 1.5 percent in 2019, well short of its target of just below 2 percent.
Germany's economy has been robust in 2017, and economic indicators have generally pointed upwards. However, this week's numbers have been unexpectedly soft. Earlier this week, Factory Orders declined 0.7%, well off the forecast of a 0.2% gain. This marked a 3-month low. German Industrial Production followed suit, as the reading of 0.0% missed the estimate of 0.5%. On Friday, Germany's trade surplus dropped to EUR 19.5 billion, the smallest surplus since January. Why the downturn? Global demand, which had been very strong in the first half of 2017, is showing signs of softening, and this had a negative impact on the manufacturing sectors in Germany and throughout the eurozone. This has also had a negative impact on exports, which was reflected in the Germany's smaller surplus in July.
GBPUSD Surges Towards 1.3200
The British pound has moved sharply higher against the U.S dollar during the European trading session, reaching 1.3190, after the UK economy posted much better than expected UK industrial output and manufacturing data.
This week's continuation of the recent fall in the value of the U.S dollars trade-weighted index, which is now at its lowest level since January 2015, is also pushing the GBPUSD pair higher.
The GBPUSD pair remains strongly bullish on all-time frames, with price-action fast approaching the current 2017 price high, located at 1.3268.
Key intraday technical resistance above the 1.3200 level, is located at the 1.3220, 1.3268, 1.3293 levels. Long-term trendline and Fibonacci resistance currently converge, at the 1.3333 level.
To the downside, intraday support is located the August 4th price high, at 1.3164, with further historical support at the 1.3125 level.
Below 1.3125, GBPUSD support is located at 1.3080 and the key 1.3047 level.
USDJPY Falls to 107.40
The U.S dollar continues to slide sharply lower against the Japanese Yen, with the USDJPY pair so far finding intraday support from the 107.40 level, trading at its lowest level since November 15th, 2016.
Broad-based weakness in the U.S index is accelerating, after yesterday's weaker than expected U.S initial jobs claims, which increase by 62,000, marking the highest level for initial claims since April 18, 2015.
Weakness in the U.S economy is starting to accelerating the decline seen in the USDJPY pair. Traders should pay close attention to the damage caused by hurricane IRMA over the weekend, further limiting the U.S economies domestic data.
Key intraday technical support is found at 107.30 and the November 14th, 2016 price low, at 106.86. Below 106.86 level, the 106.60 level represents the key 38.2 Fibonacci retracement level.
Any intraday upside price movements for the USDJPY pair, should find resistance at 107.70, 108.13 and the former weekly price low, at 108.26.
GBP/JPY Daily Outlook
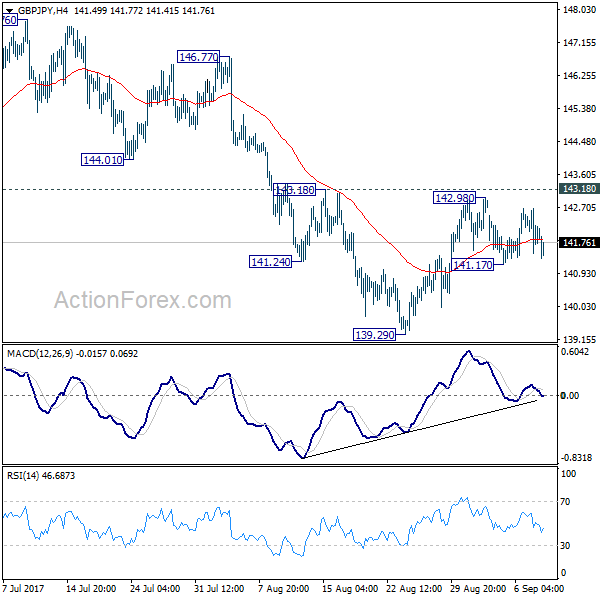
Daily Pivots: (S1) 141.48; (P) 142.08; (R1) 142.68; More
Intraday bias in GBP/JPY remains neutral for the moment. On the downside, below 141.17 will target 139.29 support first. Break will extend the fall from 147.76 and target 135.58 key support level. At this point, price actions from 148.42 are seen as a sideway consolidation pattern. Hence, we'll expect strong support from 135.58 to contain downside and bring rebound. Meanwhile, break of 143.18 will indicate short term reversal and turn bias back to the upside.
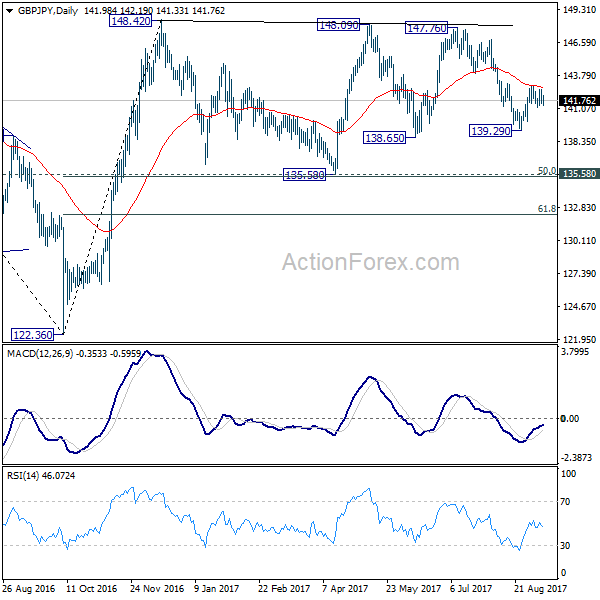
In the bigger picture, the sideway pattern from 148.42 is still unfolding. In case of deeper fall, we'd expect strong support from 135.58 and 50% retracement of 122.36 to 148.42 at 135.39 to contain downside. Medium term rise from 122.36 is expected to resume later. And break of 38.2% retracement of 196.85 to 122.36 at 150.43 will carry long term bullish implications. However, firm break of 135.58/39 will dampen the bullish view and turn focus back to 122.36 low.
EUR/JPY Daily Outlook
Daily Pivots: (S1) 129.82; (P) 130.45; (R1) 131.00; More...
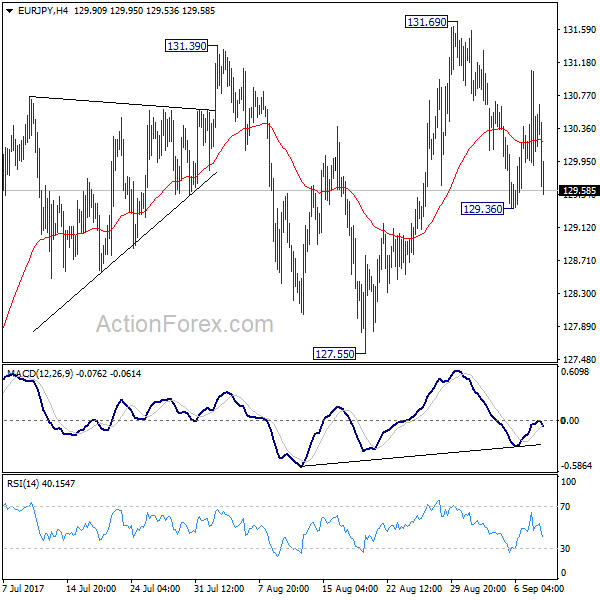
Intraday bias in EUR/JPY remains neutral for the moment. On the upside, break of 131.69 high is needed to confirm rally resumption. Otherwise, we'd expect more corrective price action in near term, with risk of deeper fall. Below 129.36 will target 127.55 support first. Firm break there will indicate near term reversal and deeper fall would be seen back to 122.39/125.80 support zone.
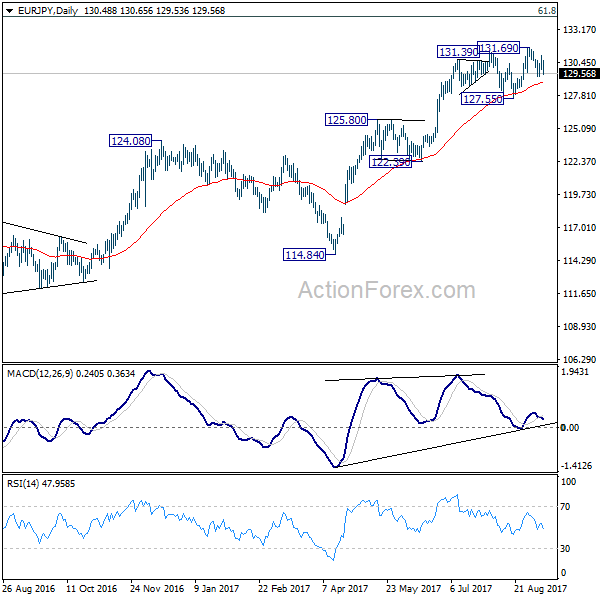
In the bigger picture, the down trend from 149.76 (2014 high) is completed at 109.03 (2016 low). Current rally from 109.03 should be at the same degree as the fall from 149.76 to 109.03. Further rise is expected to 61.8% retracement of 149.76 to 109.03 at 134.20. Sustained break there will pave the way to key long term resistance zone at 141.04/149.76. Medium term outlook will remain bullish as long as 124.08 resistance turned support holds. However, firm break of 124.08 will argue that rise from 109.03 is completed and turn outlook bearish.