
Sample Category Title
SILVER Pause
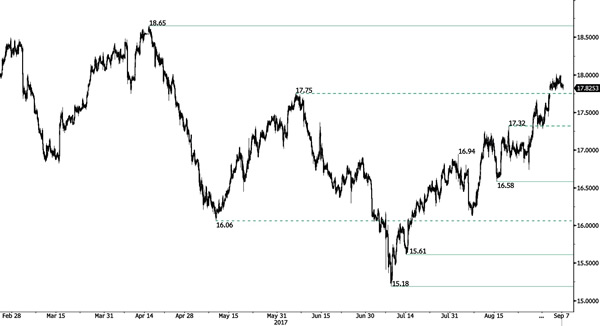
Silver has broken its key resistance at 17.75 opening the way for a test of the strong resistance at 18.65 (17/04/2017 high) while support can be found at 16.58 (15/08/2017 high). The commodity lies in an uptrend channel. Expected to show another leg higher.
In the long-term, the trend is rater negative. Further downsides are very likely. Resistance is located at 25.11 (28/08/2013 high). Strong support can be found at 11.75 (20/04/2009).
GOLD Pullback
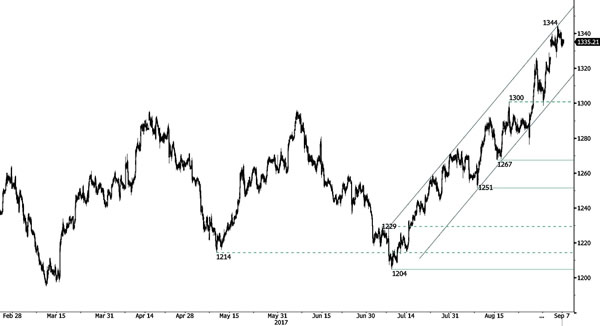
Gold failed to break rising trendline. Hourly support is given at a distance 1326 (gap low). Stronger support lies at 1204 (10/07/2017 high). Expected to show continued increase.
In the long-term, the technical structure suggests that there is a growing upside momentum. A break of 1392 (17/03/2014) is necessary ton confirm it, A major support can be found at 1045 (05/02/2010 low)
BITCOIN Recovery Bounce Stalled
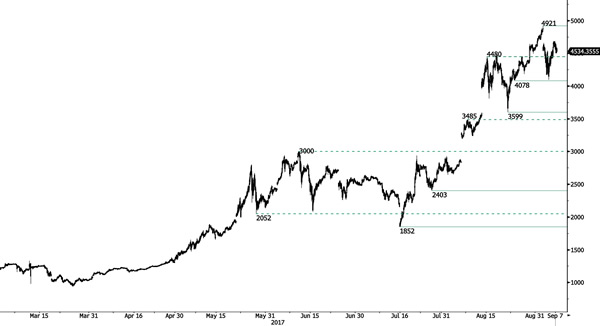
Bitcoin has set a new all-time high but since declined confirming increasing selling pressures. However, technical picture remain bullish as long as key support hold. Monitor the key support at 4478. Strong support lies very far at 3599 (22/08/2017 low). Key resistance can be located at 4921.
In the long-term, the digital currency has had an exponential growth. There are decent likelihood that the asset will reach $10'000.
EUR/CHF Bouncing
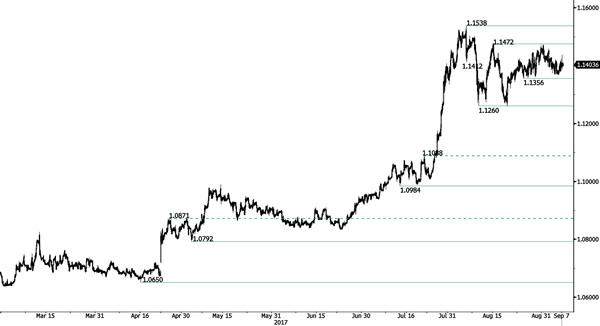
EUR/CHF showing increasing short-term buying interest near the key support at 1.1356 Hourly resistance lies at 1.1538 (04/08/2017 high). Hourly support is located at 1.1362 (25/08/2017 base low). Expected to show further bearishness.
In the longer term, the technical structure has reversed. Strong resistance is given at 1.20 (level before the unpeg). Yet, the ECB's QE programme is likely to cause persistent selling pressures on the euro, which should weigh on EUR/CHF. Supports can be found at 1.0184 (28/01/2015 low) and 1.0082 (27/01/2015 low).
EUR/GBP Consolidating
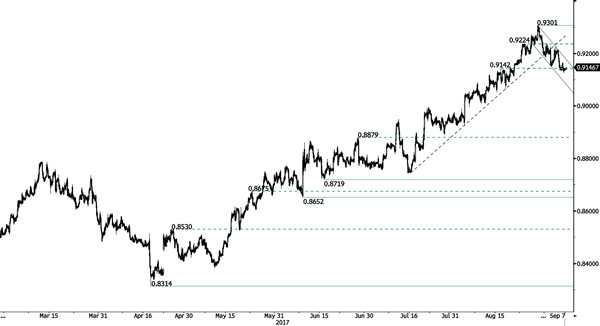
EUR/GBP has consolidating near the support at 10.9142. However, as long as prices remain below the resistance at 0.9176 (declining trendline), the short-term technical structure is biased to the downside. Hourly support is given at 0.9141 (07/09/2017). Resistance lies at 0.9176 then 0.9306 (29/07/2017 high).
In the long-term, the pair has largely recovered from recent lows in 2015. The technical structure suggests a growing upside momentum. The pair is trading above from its 200 DMA. Strong resistance can be found at 0.9500 (psychological level).
AUD/USD Drifting Higher
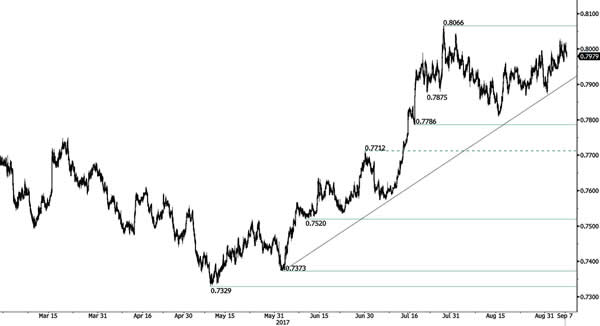
AUD/USD continue to trade above rising trendline. Hourly support can be found at 0.7946 (05/09/2017 low). Strong resistance is given at 0.8066 (27/07/2017 high). Expected to further consolidate.
In the long-term, the trend is largely negative since 2011. Key supports stands at 0.6009 (31/10/2008 low) . A break of the key resistance at 0.8295 (15/01/2015 high) is needed to invalidate our long-term bearish view.
USD/CAD Moving Lower
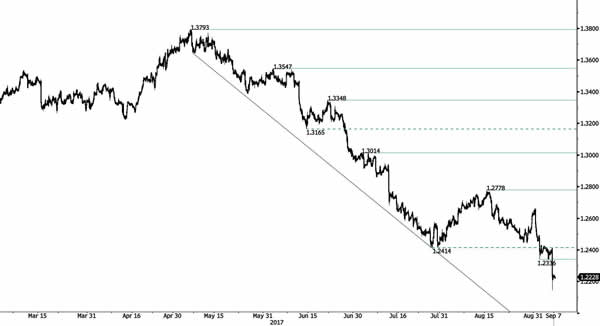
USD/CAD is moving lower, confirming an underlying declining trend. Hourly support is located at 1.2146 (intraday low). Resistance is now given at a distance at 1.2778 (15/08/2017 low). Expected to show continued short-term bearish pressures if resistance at 1.2778 holds.
In the longer term, the pair has broken longterm support that can be found at 1.2461 (16/03/2015 low). Strong resistance is given at 1.4690 (22/01/2016 high). The pair is likely to head further lower.
USD/CHF Trying To Bounce
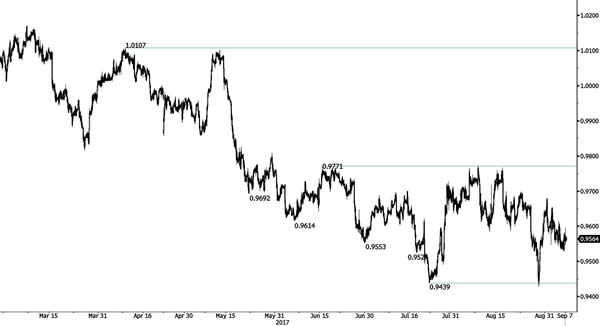
USD/CHF is trying to bounce. Strong resistance is given at 0.9771 (15/06/2017 high). The pair is likely to head further lower below 0.9500. Expected to show renewed bearish pressures.
In the long-term, the pair is still trading in range since 2011 despite some turmoil when the SNB unpegged the CHF. Key support can be found 0.8986 (30/01/2015 low). The technical structure favours nonetheless a long term bullish bias since the unpeg in January 2015.
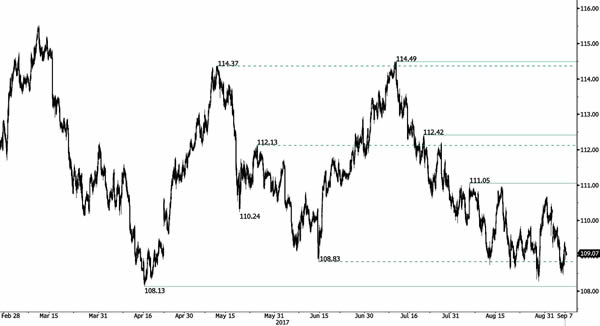
USD/JPY Bouncing
USD/JPY moving lower confirming persistant selling pressure. The pair has failed to test resistance at 111.05 (04/08/2017 high). Support is located at 108.13 (14/06/2017 low). Expected to show further downside pressures.
We favor a long-term bearish bias. Support is now given at 99.02 (10/08/2013 low). A gradual rise towards the major resistance at 125.86 (05/06/2015 high) seems unlikely. Expected to decline further support at 93.79 (13/06/2013 low).
GBP/USD Monitor The Key Resistance At 1.3069
GBP/USD is recovering after its recent massive sell-off. Monitor the key resistance at 1.3069 (rising trendline). Hourly support is given at 1.2774 (24/08/2017 high). Expected to show short-term bullish pressures.
The long-term technical pattern is even more negative since the Brexit vote has paved the way for further decline. Long-term support can be found at 1.1841 (07/10/2017 low). Long-term resistance is given around 1.35 and would indicate a long-term reversal in the negative trend. Yet, it is very unlikely at the moment.
