Sample Category Title
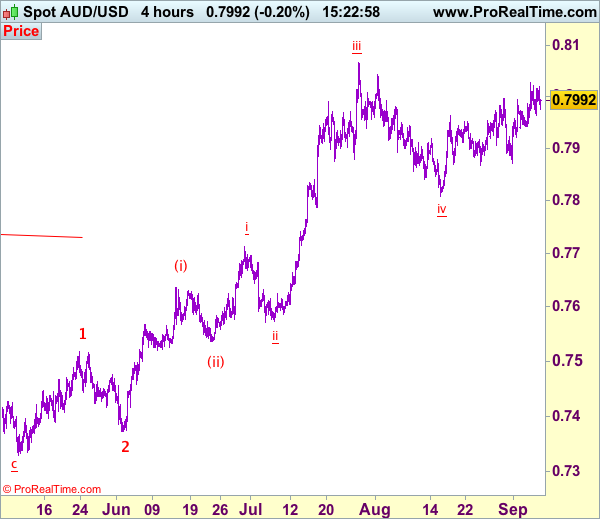
Trade Idea: AUD/USD – Buy at 0.7925
AUD/USD – 0.7992
Original strategy:
Buy at 0.7925, Target: 0.8125, Stop: 0.7865
Position: -
Target: -
Stop:-
New strategy :
Buy at 0.7925, Target: 0.8125, Stop: 0.7865
Position: -
Target: -
Stop:-
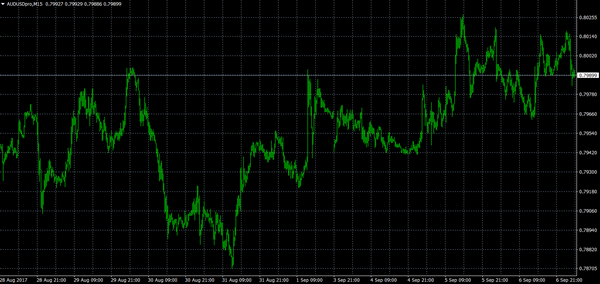
As aussie may resistance at 0.8028 earlier this week and retreated, retaining our view that consolidation below this level would be seen and pullback to 0.7950 cannot be ruled out, however, still reckon 0.7920-25 would limit downside and bring another rise, break of said resistance at 0.8028 would extend gain 0.8040-54, then retest of recent high of 0.8066 but break there is needed to confirm recent upmove has resumed for headway towards 0.8100-10 later.
In view of this, we are looking to buy aussie on pullback as 0.7920-25 should limit downside. Only below support at 0.7871 would abort and suggest the rebound from 0.7808 has ended instead, bring further fall to 0.7850 but price should stay above said support at 0.7808.
On the 4-hour chart, the move from 0.8066 is the wave 5 with i: 0.8860, ii: 0.8315, wave iii is an extended move ended at 1.0183, iv: 0.9706 and wave v has ended at 1.1081 (also the top of entire wave 5). The subsequent selloff is the major correction which is unfolding as ABC-X-ABC and 2nd A leg has ended at 0.8848, followed by a-b-c wave B which ended at 0.9758, hence, 2nd C wave is now in progress and indicated downside target at 0.7000 and 0.6950 had been met, so further fall to 0.6710-20 cannot be ruled out.
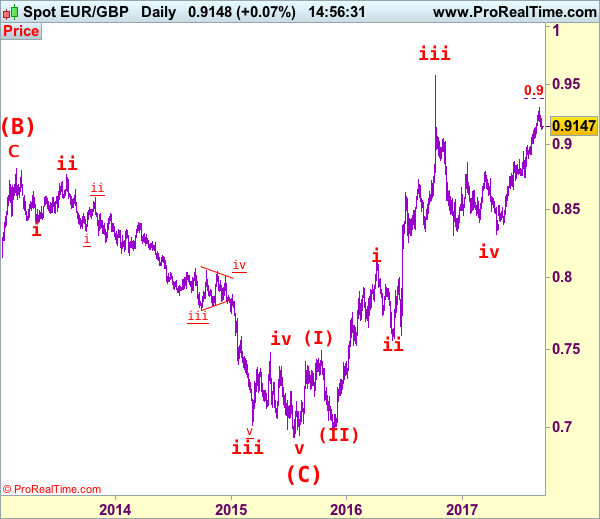
EUR/GBP Elliott Wave Analysis
EUR/GBP – 0.9152
Euro’s retreat after rising to 0.9307 last week has retained our view that 1-2 weeks of consolidation below this level would be seen and pullback to 0.9100-10 is likely, however, reckon 0.9060-65 support would limit downside and bring another upmove later. We are keeping our view that early retreat from 0.9576 (wave iii top) has ended earlier at 0.8304 and bullishness remains for the rise from there to extend further gain to 0.9350, however, near term overbought condition should precent sharp move beyond 0.9380-85 (100% projection of 0.8312-0.8950 measuring from 0.8743) and reckon 0.9440-50 would hold from here, risk from there is seen for a retreat.
Our latest preferred count is that the wave V of a 5-wave series from 0.5682 ended at 0.9805 earlier and major from there has possibly ended at 0.8067 as A-B-C-X-A-B-C. We are keeping our view that the entire correction from 0.9805 has possibly ended at 0.7756 and as labeled as the attached daily chart and impulsive move from 0.9084 has ended at 0.6938 as a 5-waver which marked as the (C) wave, recent impulsive rise is labeled as (I) (II), (i) (ii) series, indicated upside target at 0.9084 had been met, the retreat from 0.9576 suggest wave iii ended there and next upside target for wave v of (III) should head towards 0.9700 but price should falter well below parity .
On the downside, whilst initial pullback to 0.9105-10 cannot be rule out, reckon downside would be limited to 0.9060-65 and bring another rise later. A daily close below support at 0.9008 would defer and suggest a temporary top is possibly formed, risk correction to 0.8945-50, then 0.8920-25 but reckon downside would be limited to 0.8890-95 and bring another upmove later.
Recommendation: Buy at 0.9065 for 0.9265 with stop below 0.8965
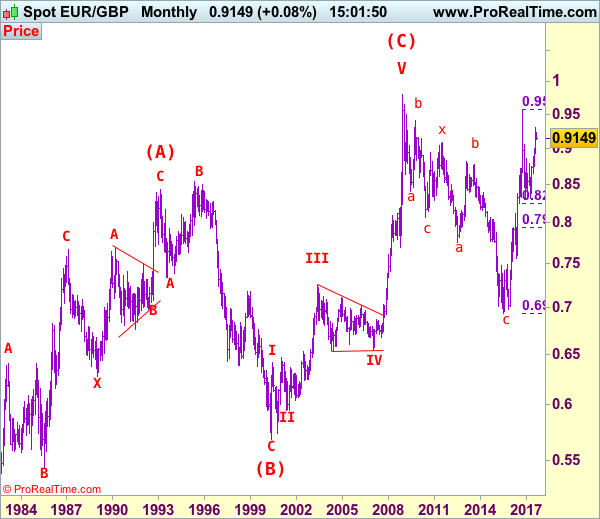
Euro's long term uptrend started in Feb 1981 at 0.5039 and is unfolding as a (A)-(B)-(C) move with (A): 0.8433 (Feb 1993), (B): 0.5682 (May 2000) and impulsive wave (C) should have ended at 0.9805 with wave III ended at 0.7254 (May 2003), triangle wave IV at 0.6536 (23 Jan 2007) and wave V as well as wave (C) has ended at 0.9805.
We are keeping an alternate count that only wave III ended at 0.9805 and the correction from there is the wave IV and has possibly ended at 0.6936, however, it is necessary to see a daily close above resistance at 0.9576 in order to change this to be the preferred count.
USD/CAD Elliott Wave Analysis
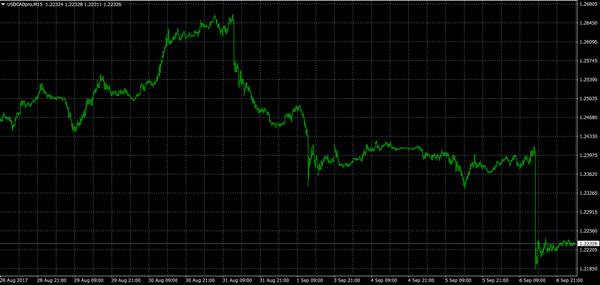
USD/CAD – 1.2215
The greenback finally resumed recent decline after last week’s brief bounce to 1.2663, justifying our bearish count for recent decline to resume in minor wave v of wave C, our short position entered at 1.2650 met downside target at 1.2450 with 200 points profit, this anticipated selloff has reinforced our bearishness for current wave C to extend further fall to 1.2140, then towards 1.2100, however, loss of momentum should prevent sharp fall below psychological support at 1.2000, bring rebound later. We are keeping our bearish count that wave b ended at 1.3794 and wave c has commenced for further fall to aforesaid downside targets.
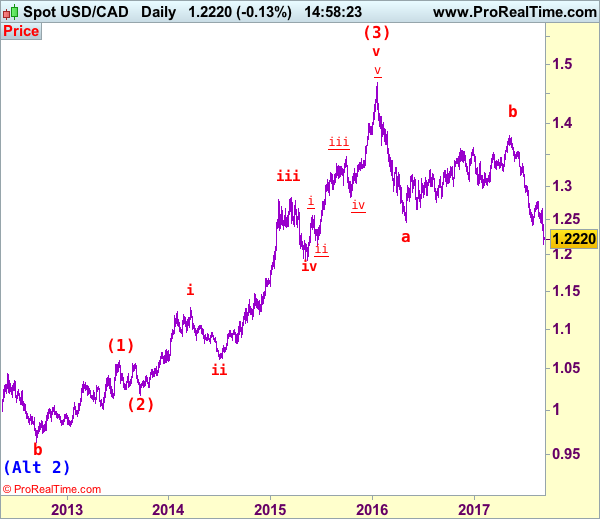
We are keeping our view that the wave b from 1.0657 (a leg top) has possibly ended at 0.9633 with (a): 0.9800, wave (b): 1.0447 and wave c at 0.9633, the subsequent rise from there is now treated as wave c exceeded indicated upside target at 1.3770-80 and 1.4000 and wave (3) has possibly ended at 1.4690 and wave (4) correction has commenced for retracement back to 1.2410-20, then towards 1.2200.
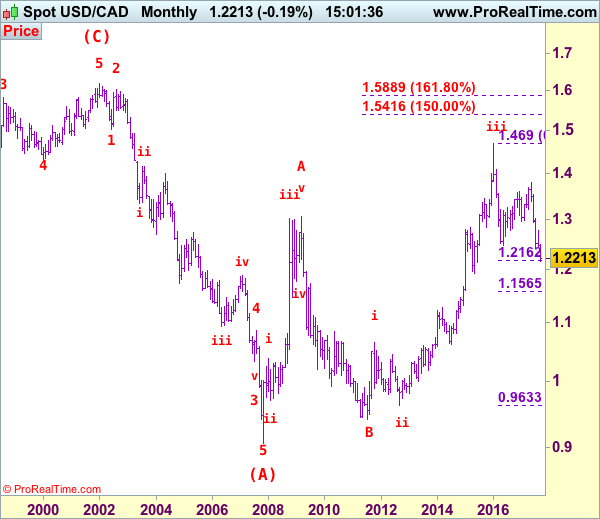
On the daily chart, our latest preferred count remains that the A of (B) rally from 0.9059 low (7 Nov 2007) unfolded into an impulsive wave with i: 0.9059-1.0380, ii ended at 0.9819, iii at 1.3019 followed by triangle wave iv at 1.2026 , then wave v formed a top at 1.3066 and also ended the wave A. The wave B is unfolding as an double three a-b-c-x-a-b-c and is sub-divided as a: 1.2192, b: 1.2716 and wave c at 1.0784, followed by wave x at 1.1725, another set of a-b-c unfolded with 2nd a at 0.9931, 2nd b at 1.0674. the 2nd c has possibly ended at 0.9407, therefore, consolidation with upside bias is seen for major correction, indicated target at 1.3900 had been met and gain to 1.4700 would follow.
On the upside, whilst initial recovery to 1.2290-00 cannot be ruled out, reckon upside would be limited to 1.2350-60 and price should falter below previous support at 1.2414 (now resistance), bring another decline later. A daily close above 1.2440-50 would defer and suggest a temporary low is possibly formed, bring a stronger rebound to 1.2500 and possibly 1.2550-60 but said resistance at 1.2663 should remain intact.
Recommendation: Short entered at 1.2650 met target at 1.2450 with 200 points profit and would be prudent to stand aside for this week.
Longer term - The selloff from 1.6194 (21 Jan 2002) to 0.9059 (07 Nov 2007) is viewed as (A) wave which is a 5-waver as labeled on the monthly chart as below, the subsequently rally is labeled as (B) with impulsive A leg of (B) ended at 1.3066, wave B of (B) is unfolding which has either ended at 0.9407 or would extend one more fall but downside should be limited to 0.9200 and 0.9000 should hold.
USDJPY Spikes As Debt Ceiling Extension Agreed
The USDJPY pair spiked towards the 109.40 level, as American President Donald Trump agreed to a request from the U.S Democratic party, to raise the U.S debt ceiling and further extend government funding through December 15th.
However, the USDJPY pair has slipped back towards the 109 level, finding support from the 108.89 level, as tensions remain high in the Korean peninsula.
The intraday outlook for the USDJPY remains mixed, with the pair bullish above the key 108.81 level, but also risks further selling pressure whilst failing to close above the 109.40 level.
Key technical resistance is located at the USDJPY 100 and 200-hour moving averages, at 109.43-53, and the pairs weekly pivot point, at 109.73.
Key intraday support for the USDJPY pair is located at the 108.89 level, and the 50 percent Fibonacci retracement of the 118.66 swing high to the 98.99 swing low, at 108.81.
Below 108.81, the 108.60 and 108.44 level offer further support, with the 108.13 level the strongest weekly support level.
EURO Awaits ECB Press Conderence
The euro is trading firmly above the 1.1900 level against the U.S dollar, ahead of the European Central Bank interest rate decision, and key press conference with ECB President Mario Draghi.
Today's press conference with Mario Draghi will be the main event, as most analysts expect the ECB to keep interest rates unchanged. Investors will look to his thoughts on eurozone inflation, the timing of QE tapering and the recent appreciation of the euro currency.
The EURUSD pair remains bullish on an intraday basis whilst trading above the 1.1918 level. However, EURUSD buyers should remain cautious, as price-action has created a bearish triple top pattern on the charts.
Key technical resistance is located at 1.1950, 1.1979 and 1.2030. A higher time-frame price close above the 1.2030 level, should encourage buying towards 1.2070 and 1.2110
Key technical support for the EURUSD pair is located at 1.1918, and the daily pivot point, at 1.1897. The monthly pivot point is located at 1.1884, with further support at 1.1865 and 1.1823.
Below the former weekly price low, at 1.1823, the euro's 200-week moving average becomes critical support, at 1.1743.
Investors Await ECB Policy Decision
Thursday is another active day in the global financial markets, with monetary policy set to dominate the headlines.
The European Central Bank (ECB) will deliver a highly anticipated policy decision at 11:45 GMT. Although no changes are expected, ECB President Mario Draghi may signal the way forward with respect to quantitative easing. ECB officials are under growing pressure to begin removing policy accommodation following a stellar first half.
However, most analysts seem to agree that Draghi will leave off the QE discussion until next month. But that won’t stop policymakers from deliberating the way forward in the wake of above-average growth and a surging euro.
In terms of economic data, the European Commission will release its second estimate of Eurozone Q2 GDP at 09:00 GMT. The revised estimate is expected to show quarterly growth of 0.6%, unchanged from the initial estimate. This translates into a year-over-year gain of 2.2%.
In North America, the Department of Labor will release its weekly jobless claims report for the period ended September 1. Applications for first-time unemployment benefits are forecast to rise by 5,000 to a seasonally adjusted 241,000. Jobless claims have held below 300,000 for more than two years.
North of the border, Canada will report on building permits at 14:00 GMT.
Earlier in the day, the Australian government said retail sales were virtually unchanged in July, confounding expectations for a 0.3% increase. Australia’s trade surplus also narrowed to $460 million in July form $856 million, separate data showed.
EUR/USD
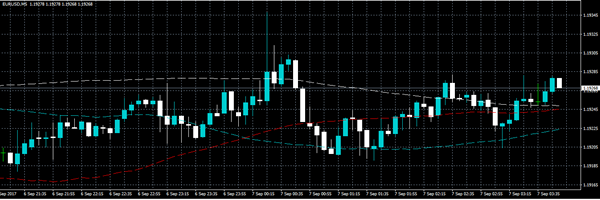
The euro is trading sideways ahead of the ECB rate announcement. The EUR/USD has traded within a narrow range and is roughly 100 pips below last week’s multiyear high. The fundamentals will drive the pair in the coming hours, with all eyes on Mario Draghi.
AUD/USD
The Australian dollar saw narrow movement after Thursday’s data releases. The AUD/USD was trading roughly 10 pips below 0.8000 during the Asian session. The pair continues to be rangebound, and faces strong support near the 4 September low of 0.7942. On the opposite side of the ledger, the Aussie faces resistance at 0.8028. A clean break above this level could lead to a challenge of the yearly high near 0.8065.
USD/CAD
The loonie’s incredible run reached a new milestone on Wednesday after the Bank of Canada raised interest rates for the second time this year. The USD/CAD exchange rate plunged nearly 200 pips to 1.2232, where it is currently trading at multiyear lows. The sharp decline makes the technical indicators less relevant for the time being, as the market looks to absorb the fundamentally-driven move. For the time being, the USD/CAD is struggling near two-year lows. The pair is capping off its fourth straight bearish month, according to technical analysts.
Aussie Dollar Remains In Major Uptrend Vs US Dollar
Key Highlights
- The Aussie Dollar is positioned nicely above the 0.7900 handle area against the US Dollar.
- There is a crucial ascending channel with current support at 0.7950 forming on the 4-hours chart of AUD/USD.
- Australia’s trade balance in July 2017 posted a surplus of 460M, less than the forecast of 875M.
- Australian’s Retail Sales in July 2017 posted no change compared with the forecast of +0.3% (MoM).
AUDUSD Technical Analysis
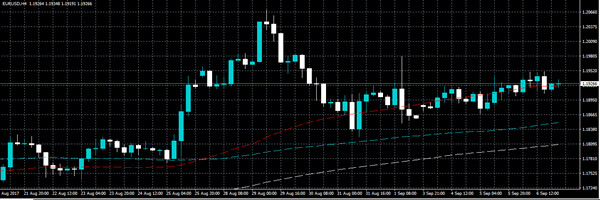
The Aussie Dollar started a major upside move from the 0.7807 low against the US Dollar. The AUD/USD pair is positioned well in the bullish zone and remains supported near 0.7950.
Looking at the 4-hours chart, there is a crucial ascending channel forming with current support at 0.7950. Both 100 and 200 simple moving averages (H4) are also below the channel support at 0.7930.
Therefore, any major dips from the current levels are likely to find support near 0.7950-0.7930. In the short term, there is a contracting triangle forming with resistance at 0.8020.
The pair recently tested the 1.236 Fibonacci extension of the last decline from the 0.7995 high to 0.7871 low. It suggests that the pair might attempt a downside correction before moving back above 0.8000 in the near term.
The overall trend seems to be bullish as long as the pair is trading above 0.7950-0.7930.
Australia’s Trade Balance and Retail Sales
Today, Australia saw a couple of important economic releases like the trade balance and retail sales (July 2017). The trade balance in July 2017 released by the Australian Bureau of Statistics was forecasted to post a surplus of 875M.
However, the actual result was on the lower side, as the trade surplus was 460M. It was also less compared with the last 856M. Exports of goods and services in July 2017 declined 2%, more than the last -1%. Imports of goods and services in July 2017 declined 1%, compared with the last increase of 2%.
The report added that:
In seasonally adjusted terms, goods and services credits fell $709m (2%) to $31,071m. Non-rural goods fell $631m (3%), non-monetary gold fell $330m (17%) and net exports of goods under merchanting fell $4m (15%). Rural goods rose $97m (2%). Services credits rose $159m (3%).
Moreover, the Retails Sales figures for July 2017 were also published today. The forecast was lined up for an increase of 0.3% in sales compared with the previous month. The actual was disappointing, as there was no change in sales (0%).
Economic Releases to Watch Today
ECB Interest Rate Decision, Monetary Policy Statement and Press Conference.
US Initial Jobless Claims – Forecast 241K, versus 236K previous.
Canada’s Ivey PMI August 2017 – Forecast 61.3, versus 60.0 previous.
Bank Of Canada Surprises Markets
In a surprising move on Wednesday, the Bank of Canada raised interest rates by 25 basis points to 1%. The Bank of Canada said the hike “was warranted given unexpectedly strong economic growth in Q2 but future moves are not predetermined and would be guided by data and market developments”. Such a comment could result in further rate hikes before the end of the year. Following the hike, USDCAD fell by over 2%, to trade at 1.21272, a level not seen since June 2015. Now the markets will be closely watching future economic data ahead of a speech by Bank of Canada Governor Stephen Poloz, scheduled for September 27, when he is expected to provide an economic update.
The US Commerce Department released data on Wednesday that showed the US trade gap rising 0.3% to $43.7 billion. The June trade deficit was revised down slightly to $43.5 billion from the previously reported $43.6 billion. The trade deficit increased less than expected in July, as both exports and imports fell, suggesting trade could contribute to economic growth in Q3. However, the effects from Hurricane Harvey, and the impending effects resulting from Hurricane Irma, could significantly impact commodity prices and therefore push up the trade deficit in September.
The market will now focus on today’s ECB Interest rate decision and the statement that follows from ECB President Draghi. The markets are hoping that Draghi may give more clarity on paring the European Central Bank’s bond-buying program, although some market participants are weary that Draghi may warn against the strength of EUR, which has risen 13% this year to date, the strongest performing G10 currency.
EURUSD Gained 0.2% to trade as high as 1.19499 on Wednesday. Currently, EURUSD is trading around 1.1925.
USDJPY made back recent losses to currently trade at 109.00.
GBPUSD continued to hold firm reaching a high of 1.30818 on Wednesday. Currently, GBPUSD is trading around 1.3050.
Gold increased 0.5 percent to $1,342.39, its highest level in a year. Currently, Gold is trading around $1,335.
WTI continued strengthening, reaching a high on Wednesday of $49.66pb, an increase of over 1.5% on the day. Currently, WTI is trading around $49.35pb.
At 10:00 BST, Eurostat will release Eurozone Gross Domestic Product (QoQ) & (YoY) for Q2. Consensus is calling for both data sets to be unchanged: 0.6% for QoQ and 2.2% YoY. As a broad measure of Eurozone economic activity and health the markets will be looking to see an unchanged or better release.
A higher than expected number will see EUR move higher, similarly a lower than expected number will see EUR decline.
At 12:45 BST, the European Central Bank (ECB) will announce its Interest Rate decision. The market is not expecting any rate hike.
At 13:30 BST, The ECB holds a press conference and releases their Monetary Policy Statement. The markets will be listening acutely as to the tone of the comments the ECB makes.
At 16:00 BST, the US Energy Information Administration will release the EIA Crude Oil Stocks change report for August 28th. Consensus calls for a rise to 4.7M from the previous drawdown of -5.392M. Oil has risen, after refineries impacted by Hurricane Harvey are slowly starting to come online, but the threat of Hurricane Irma may cause further shutdowns and therefore affect the price of Oil.
Daily Technical Analysis: EUR/USD Bear Flag Pattern Awaits Euro Interest Rate Decision
Currency pair EUR/USD
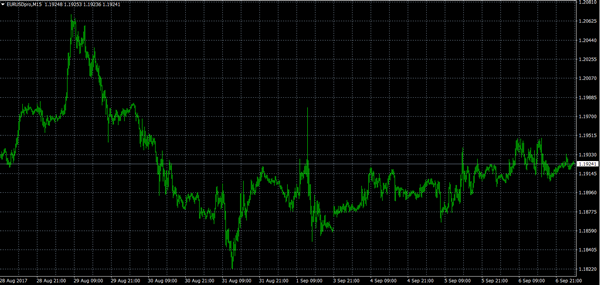
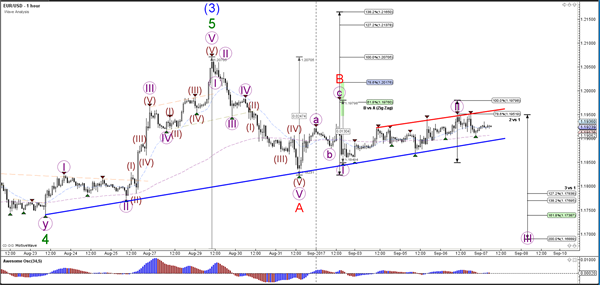
The EUR/USD is building a bear flag chart pattern (blue/red) before the interest rate decision later today in the Euro zone., which will be communicated by the European Central Bank. A break below the support trend line (blue) could confirm a potential ABC correction (red). The ABC correction (red) is invalidated if price breaks above the 138.2% Fib at 1.2165. A break above the resistance trend line (red) could indicate that there is bullish pressure to test the Fib levels of wave B vs A.

The EUR/USD could be building a potential wave 1 and 2 (purple) within wave C (red) and test the Fibonacci levels of wave 2 vs 1 (purple). A break above the 100% Fib level at 1.1980 invalidates it and could indicate that price will challenge higher Fib levels of wave B vs A. A bearish break below support (blue) could start the wave 3 (purple).
Currency pair GBP/USD
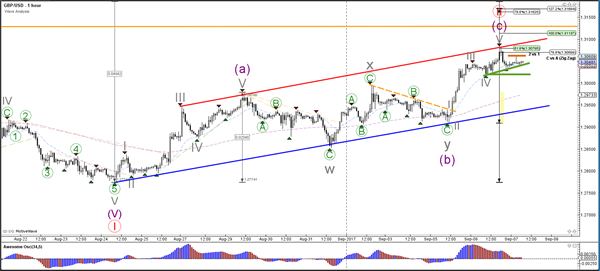
The GBP/USD did extend further to the 61.8% Fibonacci retracement level of wave 2 vs 1 (red). This Fib plus the resistance levels of a potential head and shoulders pattern on the daily chart (orange lines) and the top of the bearish channel (red) could act as potential resistance.
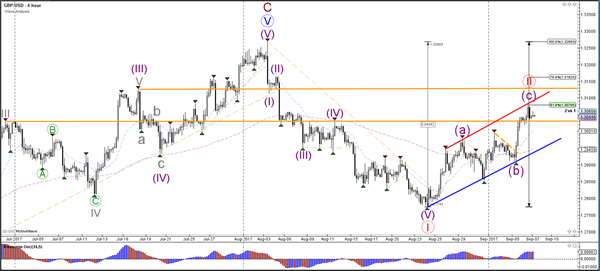
The GBP/USD indeed built a wave 4 and 5 (grey) yesterday to the target at 1.3075. Price could build one more bullish extension if it manages to stay above the support levels (green) and break above the resistance zone. The next bullish target could be the 78.6% Fib whereas the next bearish target could be the bottom of the channel (blue).
Currency pair USD/JPY
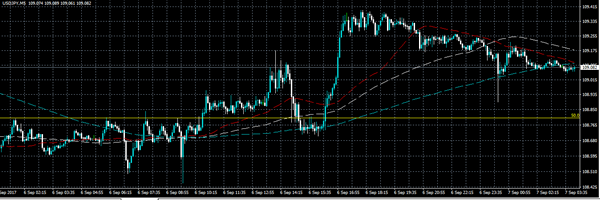
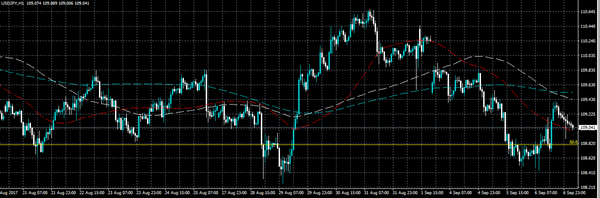
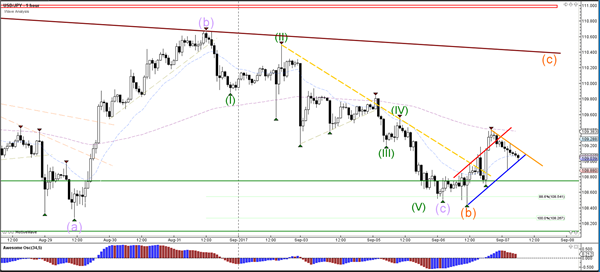
The USD/JPY again bounced at the support zone (green), which created a bullish channel (red/blue) and broke above the resistance trend line (dotted orange). Price could continue towards the next resistance zone (red) if price can break above local resistance (orange).
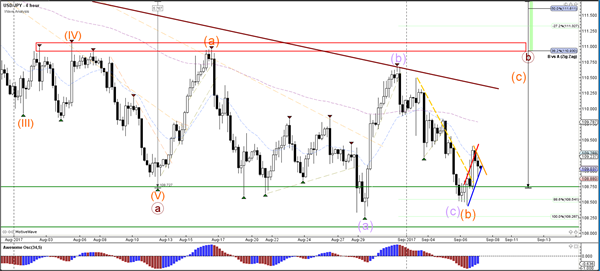
The USD/JPY is at a new bounce or break spot with price testing both a support (blue) and resistance (orange) trend line.
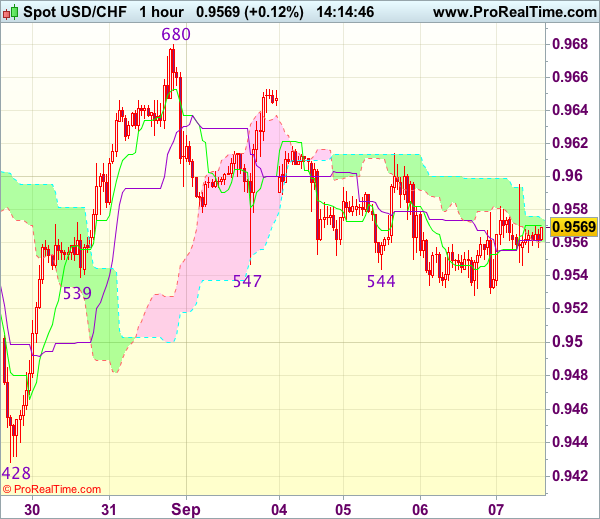
Trade Idea : USD/CHF – Buy at 0.9500
USD/CHF - 0.9564
Most recent candlesticks pattern : N/A
Trend : Down
Tenkan-Sen level : 0.9571
Kijun-Sen level : 0.9562
Ichimoku cloud top : 0.9575
Ichimoku cloud bottom : 0.9571
Original strategy :
Buy at 0.9500, Target: 0.9600, Stop: 0.9465
Position : -
Target : -
Stop : -
New strategy :
Buy at 0.9500, Target: 0.9600, Stop: 0.9465
Position : -
Target : -
Stop : -
As the greenback has continued trading within familiar range, further sideways trading is in store and although initial downside risk remains for weakness to 0.9520-25, if our view that low has been formed at 0.9428 last week is correct, downside would be limited to 0.9500 and bring another rebound later. Above 0.9615-20 would suggest low is possibly formed, bring test of 0.9653-55 resistance, break there would bring another rise to 0.9680 but break there is needed to add credence to this view and extend gain to resistance at 0.9698-99.
In view of this, we are inclined to buy dollar on further subsequent decline. Below 0.9490-00 would risk weakness to 0.9470 but still reckon downside would be limited to 0.9450 and said support at 0.9428 should remain intact, bring another rebound later.