Sample Category Title
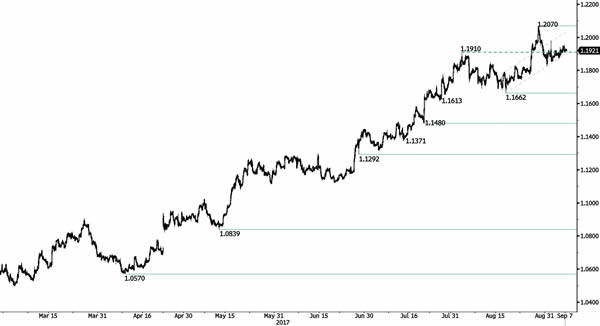
EUR/USD Drifting
EURUSD has drifted higher above the support at 1.1910. However, as long as prices remain above the resistance at 1.1840 (rising trendline), the short-term technical structure is biased to the downside. Hourly resistance can be found at 1.2070 (29/08/2017 high) while hourly support lies at 1.1820 (31/08/2017 low). Stronger support is given at a distance at 1.1662 (17/08/2017 low). Expected to show renewed bullish pressures.
In the longer term, the momentum is now turning largely positive. We favour a continued bullish bias. Key resistance is holding at 1.2252 (25/12/2014 high) while strong support lies at 1.0341 (03/01/2017 low).
Elliott Wave Analysis: EURUSD And USDCHF Intra-Day View
Market is awaiting ECB press conference when Draghi may bring more news about QE tapering. What can be really important for todays price action is that ECB does not like strong EUR, which means that any comments on that topic can be bearish for EURUSD ticker. Technically, we definitely expect lower EURUSD because of that five wave decline from the highs and a three wave rise, so there is room for a drop to 1.1770, especially once 1.1866 is broken.
EURUSD, 1H
In fact, there are more USD pairs that suggests stronger US currency in the near-term. USDCHF per example has a nice pattern; a five wave bounce followed by a three wave set-back so uptrend may resume back to 0.9700.
USDCHF, 1H
XAUUSD Analysis: Moves Along 100-Hour SMA
Instead of trying to reach the monthly R1 at 1,348.36, using the 55-hour SMA as a springboard, the exchange rate stuck at the weekly R1 at 1,339.42 and stayed there until a release of data on the US ISM Non-Manufacturing PMI. The American figures appeared to be positive and dragged the pair down by 0.5%. Fortunately for the gold, the 100-hour SMA managed to neutralize the further fall. For this reason, the yellow metal has a good basis to try to get back at least to the above weekly R1.
On the other hand, there is a need to take into account that below the 100-hour SMA there is an empty zone up until the junior ascending channel’s bottom trend-line and the 200-hour SMA.
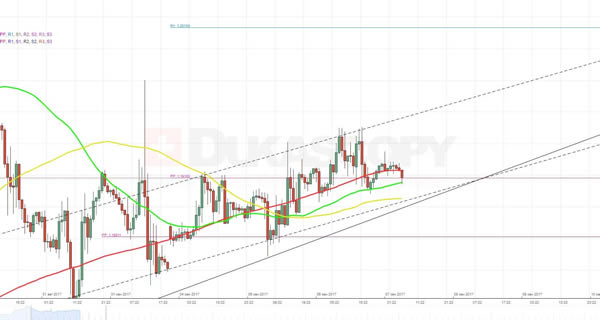
USDJPY Analysis: Rebounds From Monthly S1 At 108.48
In accordance with expectations, most of the previous trading day the currency rate spent in an upward movement, using the weekly and monthly S1, as trampolines. Despite such rebound, the further road to the north is still obstructed by the 100- and 200-hour SMAs and then by the weekly and monthly PP. For this reason, today the pair is expected to resume the fall and once again to try to break through the above weekly S1 at 108.80. In the meantime, there is a need to take into account a certain effect that might appear after publication of data on the Japan’s Final GDP at 23:50 GMT. Finally, there is also a need to remember that the rate is simultaneously moving in a senior descending channel and still hasn’t formed a new reaction low.
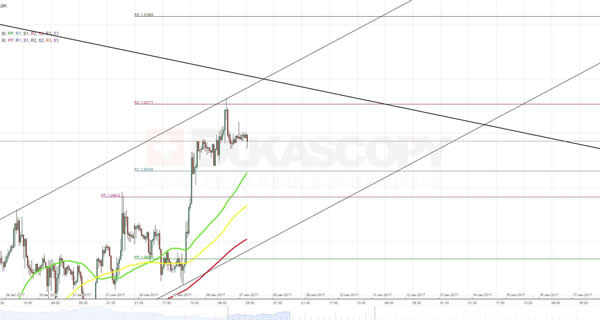
GBPUSD Analysis: Fails To Break Through Weekly R2
Contrary to expectations, the Pound did move horizontally for long but instead tried to break through the weekly R1 at 1.3077. A reaction from release of information on the US ISM Non-Manufacturing PMI was barely enough to neutralize this attempt. In result, today the pair remains squeezed between the weekly R2 from the top and the weekly R1 from the bottom. From a technical perspective, the southern direction contains other various barriers, such as the approaching 55- and 100-hour SMAs. In this sense, the further surge is a more likely scenario. On the other hand, slightly above the 1.3070 level the pair is likely to encounter the upper line of a dominant descending channel, which might turn around the pair and in this way finally confirm its existence.
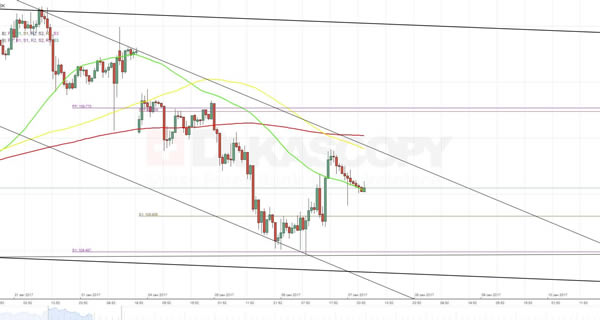
EURUSD Analysis: Prepares For EU Min Bid Rate
As it was expected, a pressure from a combination of the 55-, 100- and 200-hour SMAs neutralized any further attempts of the currency pair to slip to the bottom. The exchange rate even managed to from a junior ascending channel and bypass the weekly PP at 1.1918, fluctuating within it. Today will be the next day for the Euro due to announcement of the EU Minimum Bid Rate and the subsequent ECB press conference. Usually, this event leads to very strong traders’ reaction on it. In this context, the pair is expected to make a substantial advance today. Given a reaction to Draghi speech at the Jackson Hole Symposium two weeks ago, the Euro should appreciate today as well. The same direction is also seen from hourly and daily chart perspectives.
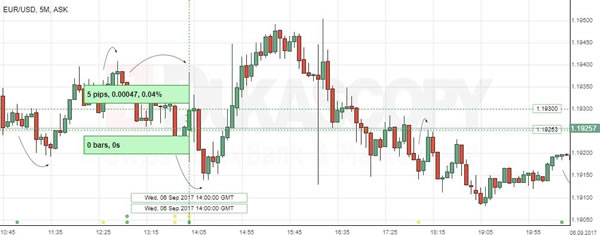
EUR/USD: ISM Non-Manufacturing PMI
Data release on Wednesday showed that the US non-manufacturing activity accelerated over the course of August. Following the report, the EUR/USD marked high volatility, albeit the European single currency gained only 5 pips or 0.04% against the US Dollar to the 1.1930 mark and failed to sustain the position until the Thursday morning session.
The Institute for Supply Management reported that its PMI for the US non-manufacturing sector posted weaker-than-expected increase to 55.3 in August, following the prior month’s figure of 53.9. An expansion was fuelled by strong increase in new orders and employment, suggesting the weaker job growth registered last month was temporary. Data indicated the US economy is set to gather momentum early in the Q3.
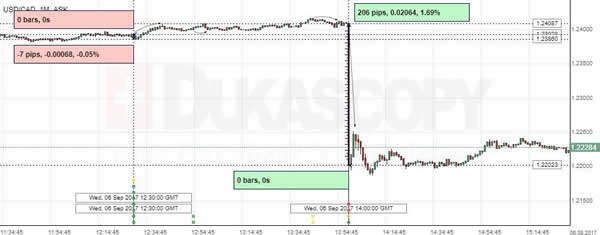
USD/CAD: Trade Balance, BoC Overnight Rate
Wednesday reports on the trade balance of two North American countries did not have any impact on USD/CAD. Some hours later the Bank of Canada announced its interest rate decision causing a solid drop in the currency pair, where the Greenback fell initially against the Loonie by 206 base points or 1.69% to be seen trading in the 1.22 area.
Statistics Canada reported that the country’s trade balance narrowed more than anticipated to 3.0B over the course of July. Data were released late to affect the BoC rate address, though it raised the Overnight Rate unexpectedly to 1.00% from 0.75%. The Central Bank stated that the next moves would be driven by future economic data and developments in financial markets.
Technical Outlook: USDJPY – Selling Upticks Remains Favored Near-Term Scenario
The pair closed positively on Wednesday after sharp fall on Tuesday, as daily cloud twist continues to attract, but limited upside attempts seen so far. Firm bearish setup of daily studies keeps the downside at risk as Tuesday's long bearish daily candle continues to weigh. We need to see firm break below 108.60 support zone for extension of larger bears towards key support at 108.11 (2017 low). Upside attempts should stay capped at 109.45/65 zone (daily Tenkan-sen/Kijun-sen in bearish configuration/converged 10/20SMA's) in order to keep bears intact.
Res: 109.46, 109.55, 109.65, 109.79
Sup: 108.88, 108.60, 108.26, 108.11
Technical Outlook: GBPUSD – Bulls Are Struggling To Break Above Key Daily Cloud Top/Fibo 61.8% Barrier
Cable is remains firm following strong rally on Tuesday but struggling to break above key barriers, daily cloud top and Fibo 61.8% of 1.3268/1.2773 descend at 1.3080 zone.
Yesterday's action peaked at 1.3081 but failed to sustain gains, leaving daily candle with long upper shadow and failing to close above daily cloud.
Close above cloud top/Fibo barrier is needed to strengthen existing bulls for further extension of bull-leg from 1.2773 (24 Aug trough).
The pair may show further hesitation at 1.3080 zone pivots, with supports at 1.3020/00 zone expected to hold and keep bulls in play.
UK housing data showed upbeat results in August which would be supportive for pound.
Res: 1.3060, 1.3081, 1.3100, 1.3151
Sup: 1.3020, 1.3000, 1.2967, 1.2957