Sample Category Title
Bank of Canada Hikes Again after a Summer of Impressive Data
Highlights:
- The overnight rate was raised to 1.00% from 0.75% in light of stronger-than-expected data since the last meeting in July.
- The bank doesn't appear to be overly concerned about the Canadian dollar's recent strength, pinning currency appreciation on USD weakness and relative strength in the Canadian economy.
- Inflation has evolved as expected with some increase in headline and core rates as economic slack is absorbed and transitory factors fade.
- The statement noted some remaining signs of labour market slack, as well as relatively slow wage growth at this point in the cycle. The latter has been observed in other advanced economies.
- The bank once again noted future rate decisions will be data dependent and close attention will be paid to the economy's sensitivity to higher rates given elevated household debt.
Our Take:
The Bank of Canada surprised market consensus by raising rates for the second time in as many meetings, though today's move wasn't a total shock given strong economic data over the intermeeting period. We hadn't heard from the bank since July's meeting but their forward guidance that future policy changes would be data dependent, combined with last week's robust GDP report, raised the prospect of an immediate follow-up to July's increase. Impressive growth and additional evidence that the expansion is becoming more broadly-based—including the long awaited rotation toward stronger business investment and exports—warranted some further removal of the "considerable monetary policy stimulus in place." At present, inflation and wage growth are not signaling an immediate need to return to a more neutral stance though that didn't keep the bank from tightening policy at consecutive meetings. However, they continued to note future moves will be data dependent with an eye on inflation and how households react to higher interest rates given elevated debt levels. The bank is likely trying to keep markets from extrapolating the pace of rate hikes seen over the last two meetings.
We had expected the bank would hold off on another rate increase until October when its growth forecasts are refreshed. We think those projections will show the economy near capacity in Q3, though today's indication that policymakers will have an eye on the economy's potential growth gives them some flexibility on that front. On balance, limited economic slack, solid growth momentum, and "considerable" stimulus remaining in the system support the case for another rate hike before the end of the year. Our updated forecast for the overnight rate will be released in Friday's Financial Markets Monthly.
EUR/USD Mid-Day Outlook
Daily Pivots: (S1) 1.1873; (P) 1.1906 (R1) 1.1946; More...
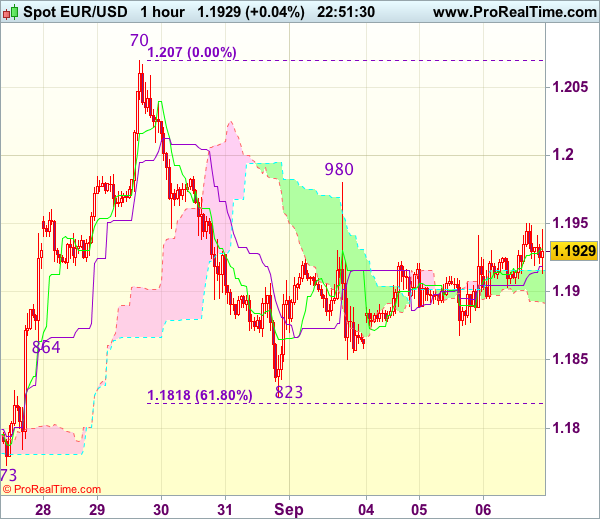
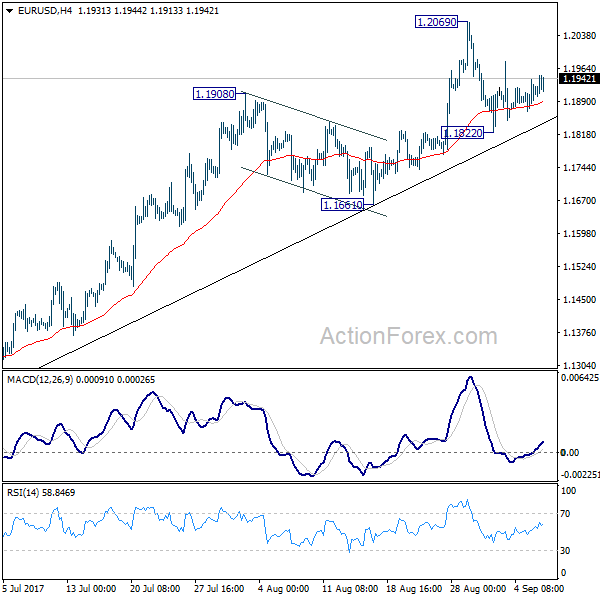
Intraday bias in EUR/USD remains neutral as it's still bounded in consolidation below 1.2069. Below 1.1822 will bring deeper fall. But after all, there is no clear sign of trend reversal yet. Outlook will remain bullish as long as 1.1661 holds. Break of 1.2069 will extend larger rise from 1.0339 to next key fibonacci level at 1.2516. Nonetheless, break of 1.1661 will bring much lengthier consolidation first.
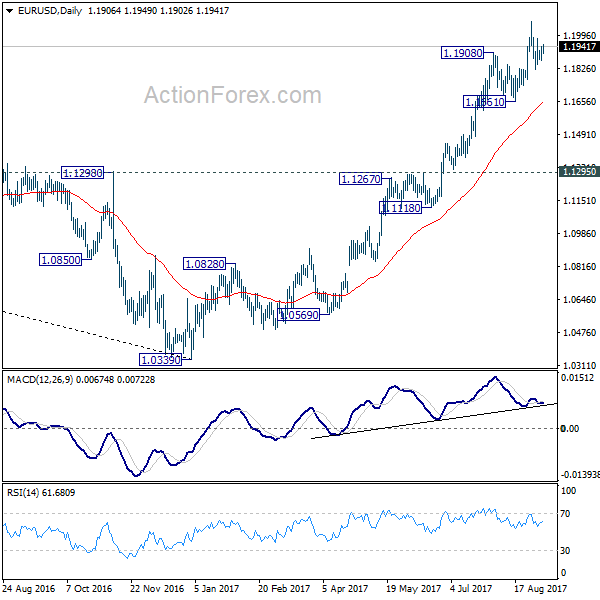
In the bigger picture, an important bottom was formed at 1.0339 on bullish convergence condition in weekly MACD. Sustained trading above 55 month EMA (now at 1.1774) will pave the way to key fibonacci level at 38.2% retracement of 1.6039 (2008 high) to 1.0339 (2017 low) at 1.2516. While rise from 1.0339 is strong, there is no confirmation that it's developing into a long term up trend yet. Hence, we'll be cautious on strong resistance from 1.2516 to limit upside. For now, medium term outlook will remain bullish as long as 1.1295 support holds, in case of pull back.
GBP/USD Mid-Day Outlook
Daily Pivots: (S1) 1.2945; (P) 1.2993; (R1) 1.3079; More...
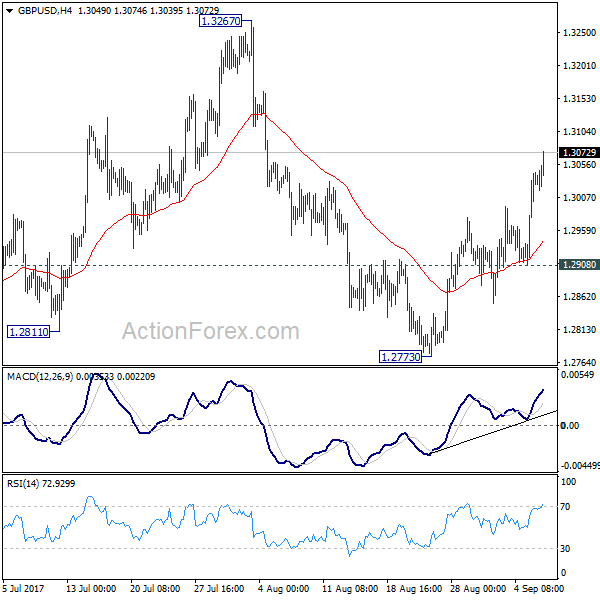
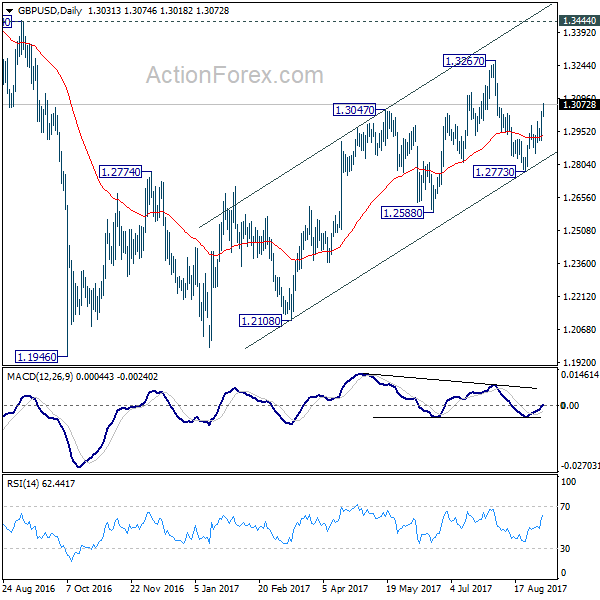
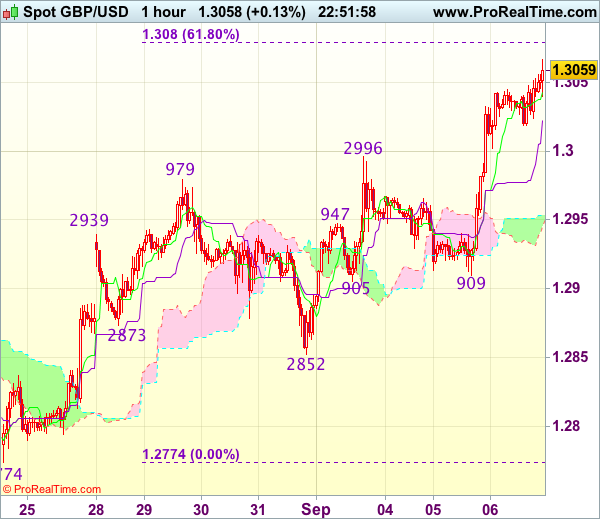
Intraday bias in GBP/USD remains on the upside for 1.3267. Break will target 1.3444 key resistance level next. Price actions from 1.1946 are still seen as a corrective pattern. Hence, we'd expect strong resistance from 1.3444 to limit upside to bring larger down trend reversal eventually. On the downside, below 1.2908 minor support will turn bias back to the downside for 1.2773.
In the bigger picture, overall, price actions from 1.1946 medium term low are seen as a corrective pattern. While further rise cannot be ruled out, larger outlook remains bearish as long as 1.3444 key resistance holds. Down trend from 1.7190 (2014 high) is expected to resume later after the correction completes. And break of 1.2588 will indicate that such down trend is resuming.
USD/CHF Mid-Day Outlook
Daily Pivots: (S1) 0.9520; (P) 0.9566; (R1) 0.9599; More....
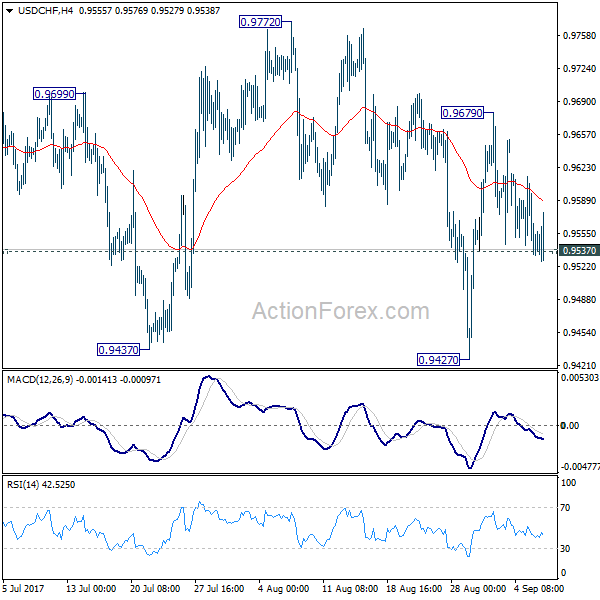
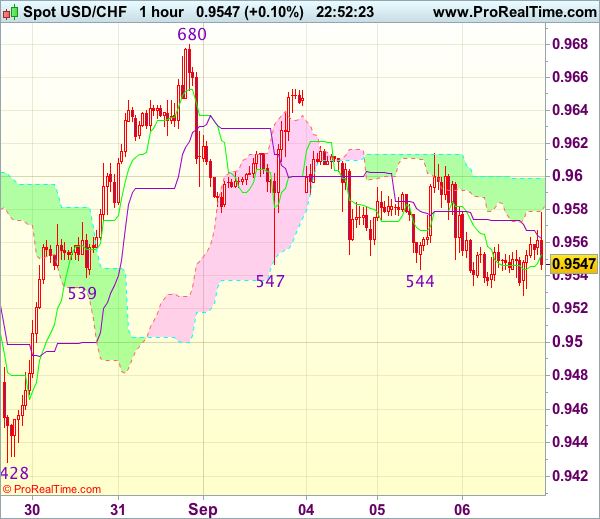
Focus remains on 0.9537 minor support. Firm break will turn bias to the downside for retesting 0.9427 first. Break of 0.9427 will resume whole decline from 1.3042. Meanwhile, considering it's close to to 0.9443 key support, consolidation from 0.9427 might extend further. But still, break of 0.9772 resistance is needed to confirm near term reversal. Otherwise, outlook stays bearish for another decline.
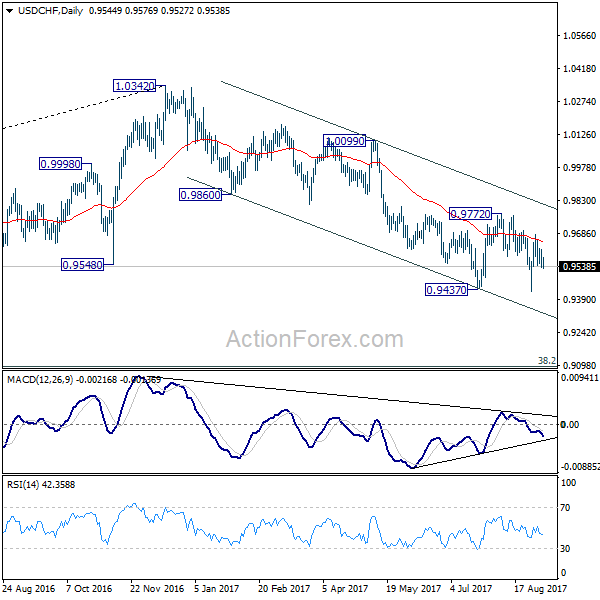
In the bigger picture, current development suggests that 0.9443 key support (2016 low) could be taken out firmly as down trend form 1.0342 extends. There are various interpretation of the price actions. But in any case, medium term outlook will stay bearish as long as 0.9772 resistance holds. Current down trend could extend to 38.2% retracement of 0.7065 (2011 low) to 1.0342 (2016 high) at 0.9090. However, break of 0.9772 will indicate that USD/CHF has successfully defended 0.9443 again and turn outlook bullish for 1.0099 resistance.
USD/JPY Mid-Day Outlook
Daily Pivots: (S1) 108.34; (P) 109.09; (R1) 109.54; More...
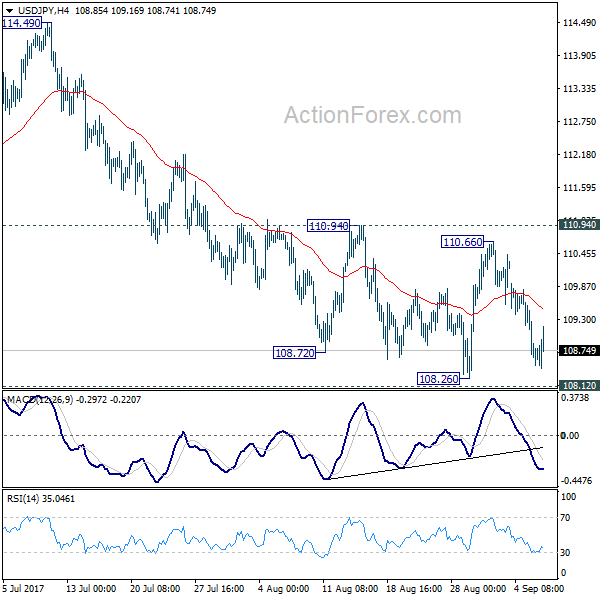
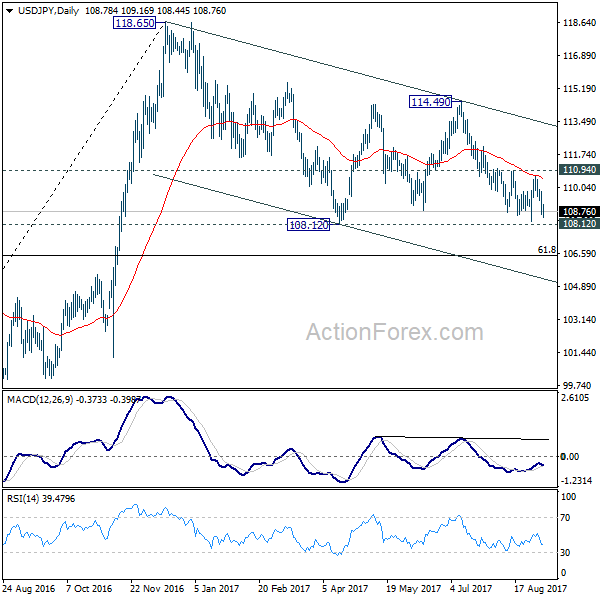
Intraday bias in USD/JPY remains mildly on the downside for 108.12/26 support zone. Decisive break there will resume the whole corrective decline from 118.65. Next target will be 61.8% retracement of 98.97 to 118.65 at 106.48. In any case, outlook will remain cautiously bearish as long as 110.94 resistance holds.
In the bigger picture, the corrective structure of the fall from 118.65 suggests that rise from 98.97 is not completed yet. Break of 118.65 will target a test on 125.85 high. At this point, it's uncertain whether rise from 98.97 is resuming the long term up trend from 75.56, or it's a leg in the consolidation from 125.85. Hence, we'll be cautious on topping as it approaches 125.85. If fall from 118.65 extends lower, downside should be contained by 61.8% retracement of 98.97 to 118.65 at 106.48 and bring rebound.
Trade Idea Wrap-up: USD/CHF – Buy at 0.9500
USD/CHF - 0.9543
Most recent candlesticks pattern : N/A
Trend : Down
Tenkan-Sen level : 0.9553
Kijun-Sen level : 0.9562
Ichimoku cloud top : 0.9599
Ichimoku cloud bottom : 0.9582
Original strategy :
Buy at 0.9500, Target: 0.9600, Stop: 0.9465
Position : -
Target : -
Stop : -
New strategy :
Buy at 0.9500, Target: 0.9600, Stop: 0.9465
Position : -
Target : -
Stop : -
As the greenback has remained under near term pressure and consolidation with initial downside bias remains, hence weakness to 0.9520-25 cannot be ruled out, however, if our view that low has been formed at 0.9428 last week is correct, downside would be limited to 0.9500 and bring another rebound later. Above 0.9615-20 would suggest low is possibly formed, bring test of 0.9653-55 resistance, break there would bring another rise to 0.9680 but break there is needed to add credence to this view and extend gain to resistance at 0.9698-99.
In view of this, we are inclined to buy dollar on further subsequent decline. Below 0.9490-00 would risk weakness to 0.9470 but still reckon downside would be limited to 0.9450 and said support at 0.9428 should remain intact, bring another rebound later.
Trade Idea Wrap-up: GBP/USD – Buy at 1.3005
GBP/USD - 1.3063
Most recent candlesticks pattern : N/A
Trend : Near term up
Tenkan-Sen level : 1.3047
Kijun-Sen level : 1.2930
Ichimoku cloud top : 1.2953
Ichimoku cloud bottom : 1.2950
Original strategy :
Buy at 1.2970, Target: 1.3070, Stop: 1.2935
Position : -
Target : -
Stop : -
New strategy :
Buy at 1.2970, Target: 1.3070, Stop: 1.2935
Position : -
Target : -
Stop : -
Yesterday’s rally above previous resistance at 1.3032 confirms recent rise from 1.2774 has resumed and mild upside bias remains for this move to extend further gain towards dynamic resistance at 1.3080 (61.8% Fibonacci retracement of 1.3269-1.2774) but near term overbought condition would prevent sharp move beyond 1.3100 and reckon 1.3140-50 would hold, risk from there is seen for a retreat to take place later.
In view of this, would not chase this rise here and would be prudent to buy cable on pullback as previous resistance at 1.2996 should limit downside and bring another rise. Below the Ichimoku cloud (now at 1.2950-53) would defer and risk weakness to 1.2930 but only break of support at 1.2905-09 would signal top is formed.
USD/CAD Mid-Day Outlook
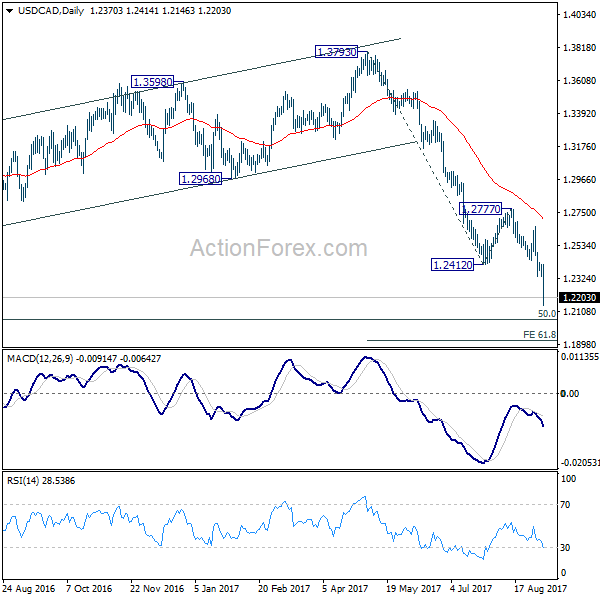
Daily Pivots: (S1) 1.2333; (P) 1.2375; (R1) 1.2415; More....
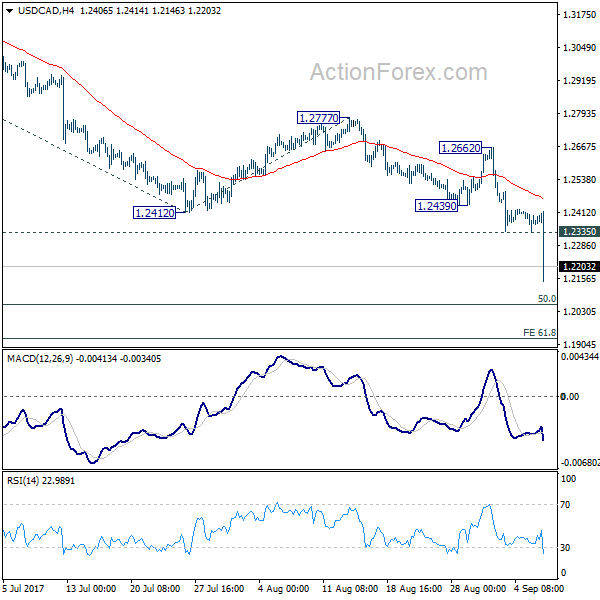
USD/CAD dives to as low as 1.2146 after BoC rate hike, as recent decline extends. Intraday bias stays on the downside. Fall from 1.3793 should target target next long term fibonacci level at 1.2048. Downside momentum as seen in daily MACD is picking up again. Firm break of 1.2048 will carry larger bearish implication and target 61.8% projection of 1.3793 to 1.2412 from 1.2777 at 1.1924 next. On the upside, above 1.2335 minor resistance will turn intraday bias neutral first. But out look will remain bearish as long as 1.2662 resistance holds.
In the bigger picture, price actions from 1.4689 medium term top are seen as a correction pattern. Such corrective fall is expected to extend to 50% retracement of 0.9406 to 1.4869 at 1.2048. At this point, we'd look for strong support from there to contain downside and bring rebound. Break of 1.2777 resistance will indicate reversal and turn outlook bullish for 1.3793 key resistance. However, sustained break of 1.2048 will dampen this view and carry larger bearish implications and bring deeper decline to 61.8% retracement at 1.1424 and below.
Canadian Dollar Surges after Bank of Canada hikes Interest Rates
Canadian dollar surged to the highest since June 2015 against its US counterpart after Bank of Canada decided to hike interest rates by additional 25 bps to 1% (BoC hike rates in July by 0.25% for the first time in seven years).
The USDCAD pair crashed after the decision, falling some 270 pips to fresh over two-year low at 1.2133.
The central bank's action was seen unlikely, according to the latest polls that showed 22% possibility of changing interest rates on today's meeting. Subsequent bounce on profit-taking after strong fall regained levels above 1.2200 handle but limited corrective action is seen before bears resume towards next targets at 1.2046 (50% of 2011/2016 0.9405/1.4688 ascend) and psychological 1.2000 level.
The pair is on track for strong bearish daily close which will mark the fifth straight close in red that is expected to weigh on the action in coming sessions.
Res: 1.2250; 1.2300; 1.2335; 1.2370
Sup: 1.2133; 1.2100; 1.2046; 1.2000
Trade Idea Wrap-up: EUR/USD – Sell at 1.1980
EUR/USD - 1.1939
Most recent candlesticks pattern : N/A
Trend : Up
Tenkan-Sen level : 1.1932
Kijun-Sen level : 1.1919
Ichimoku cloud top : 1.1915
Ichimoku cloud bottom : 1.1891
Original strategy :
Sell at 1.1980, Target: 1.1880, Stop: 1.2015
Position : -
Target : -
Stop : -
New strategy :
Sell at 1.1980, Target: 1.1880, Stop: 1.2015
Position : -
Target : -
Stop : -
Yesterday’s cable-led rebound suggests consolidation with initial upside bias would be seen and gain to 1.1950-55 cannot be ruled out, however, reckon upside would be limited to resistance at 1.1980 and bring another decline later. Below 1.1885-90 would bring weakness to 1.1850, break there would signal the rebound from 1.1823 has ended, then test of this level would follow, break there would add credence to our view that top has been formed at 1.2070 earlier and extend the fall from there to 1.1815-18 (61.8% Fibonacci retracement of 1.1662-1.2070), then 1.1790-00 but downside should be limited to previous support at 1.1773.
In view of this, we are looking to sell euro again on recovery as 1.1980 resistance should limit upside. Only a firm break above said resistance at 1.1980 would abort and signal the fall from 1.2070 has ended at 1.1823, bring further gain to 1.2000 and possibly towards 1.2025-30.