
Sample Category Title
Dollar Suffers as Global Risk Sentiment Plummets
- European equities lose more than 1% today with the German Dax underperforming (-1.95%) as risk aversion reigns over markets following tonight's North Korean missile launch. Gold prices reaches the highest level since November 2016. US stock markets open moderately lower too, with losses amounting to 0.5%.
- US President Trump has joined other world leaders in condemning North Korea for shooting a missile over Japan, saying that "all options are on the table" for a response.
- Trade tensions mounted after Trump rejected China's proposal to cut steel overcapacity and urged his officials to find a way to impose tariffs on Chinese imports, the FT reported, citing people familiar. The offer was endorsed by Commerce Secretary Wilbur Ross.
- German consumer confidence improved again in the most recent month, with another high since the start of the series in 2005. French consumer spending rebounded in July (+0.7% M/M, after a dip (0.6% M/M) in June, suggesting domestic demand remains on a healthy albeit not so spectacular growth path.
- EC President Juncker stressed that negotiations about a future EU-UK trading relationship after Britain leaves the EU could only start once divorce issues were resolved. Britain and the EC are holding a third round of talks.
- Poland should nudge interest rates up now to avoid spikes in inflation, central banker Zubelewicz said, taking a minority view. The central bank left rates unchanged last month at a record low of 1.5%, and Governor Glapinski said he expected them to stay there until the end of 2018, based on how inflation was expected to develop.
Rates
Risk aversion causes test of key US 10-yr yield support
Global core bonds profited from today's risk aversion with classic safe haven assets (JPY, CHF, gold) outperforming and riskier assets (peripheral bonds, stocks) underperforming. The strength of the single currency (see below) is exception to the rule. The German yield curve bull flattens with yields up to 5.3 bps (30-yr) lower. US yields shed 5 to 6 bps with the front end of the curve underperforming (-2.4 bps). The US 10-yr yield extensively tests 2.1% support. A sustained break suggests that the correction lower could extend towards levels from before Trump's election victory (1.8% area). We don't take such break for granted right now with a speech by US President Trump (on fiscal stimulus) and key US eco data ahead (which we expect to be strong). Longer term, new hurdles will line up (FOMC meeting, debt ceiling debate, President Trump's volatility). On intra-EMU bond markets, 10-yr yield spreads versus Germany widen 4-5 bps form Greece, Portugal and Italy.
North Korea's first missile launch over the northern part of Japan in 20 years triggered an escalation in the region's conflict. The huge economic impact of hurricane Harvey is also becoming ever more clear. German Bunds copied US Treasuries' strength in the European opening and extended their run until around European noon as stocks drifted south. The EMU eco calendar only contained second tier national data which didn't influence sentiment. Market tensions calmed going into US dealings even if US Treasuries continue receiving a decent bid.
The German Finanzagentur held a 2-yr Schatz auction (€5B 0% Sep2019). Total bids amounted only €4.67B, below the €5.44B average at the previous 4 Schatz auction and below the amount on offer. The Bundesbank set aside €0.97B for secondary market operations, resulting in an official bid-cover of 0.9. The prospect of policy normalization over the bond's lifetime kept some investors' at bay, despite today's risk off sentiment. The US Treasury concludes this week's supply operation today with a $28B 7-yr Note auction. The WI currently trades around 1.93%.
Currencies
Dollar suffers as global risk sentiment plummets
Today, geopolitical uncertainty on north Korea and the potential impact of hurricane Harvey caused an outright risk-off sentiment. Aside from the yen (and the CHF) it was the euro, not the dollar, which took up the safe haven function. EUR/USD easily cleared the 1.20 mark. USD/JPY came within reach of the 1.0813 key support, but a real test didn't occur.
Overnight, markets shifted into risk-off modus as North Korea fired a missile over Japan, provoking a sharp verbal reaction from South Korea, Japan and the US. Japanese premier Abe and US president Trump extensively discussed the issue and agreed to raise the pressure on North Korea. The yen played its role as safe haven with USD/JPY trading in the 108.75/80 area. However, the loss on Asian equity markets remained modest. It had little impact on EUR/USD. The pair traded in the 1.1975 area.
Late in the Asian session, it looked like (equity) markets would again largely ignore the geopolitical tensions, as was often the case of late. However, sentiment deteriorated sharply at the start of European trading. The dollar came under further pressure. European investors maybe grew more uncertain on the US economy due to the impact of hurricane Harvey. EUR/USD jumped above the psychological level of 1.20. This move triggered a negative vicious cycle of losses of both the dollar and of European equities. European equities at some point lost almost 2%. EUR/USD filled offers in the 1.2070 area. Understandably, core bond yields declined several basis points, but the change in interest rate differentials was very modest given the sharp moves in the FX market. USD/JPY dropped to the 108.30 area, but the key 108.13 support was left intact.
Equities traded slightly off the intraday lows as US investors joined the fray, but trading remained very nervous. The FX trading dynamics also change slightly. EUR/USD lost a few ticks, but USD/JPY remained in the defensive. EUR/JPY almost tested yesterday's top just below 131, but the test was rejected. The jury is still out, but the intra-day topping out in EUR/JPY may be eased the upward pressure on EUR/USD. For now, the uptrend of euro/downtrend of the dollar remains firmly in place. Even so, we keep a close eye on the EUR/JPY trading dynamics to monitor a potential change on the recent sharp moves.
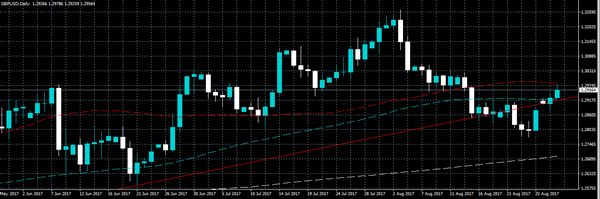
EUR/GBP tests 0.93 as Brexit talks yield no progress
Today, trading in sterling was both affected by technical/global market considerations and by fundamental issues. Regarding the 'fundamentals', the third stage in the Brexit negotiations between the EU en the UK still looks like a dead end street. EU commission President Juncker simply earmarked the UK position papers as not satisfactory. USD weakness prevailed. Cable rose temporary to the 1.2975/80 area. At the same time, the Brexit noise clearly caused a substantial underperformance of cable versus EUR/USD. In this move, EUR/GBP jumped temporary north of 0.93. The pair trades currently slightly below this big figure. Overall negative risk sentiment is also a negative factor for sterling.
SPX Elliott Wave View: At Weekly Inflection Area
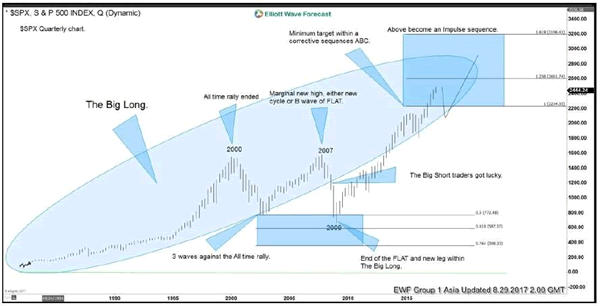
SPX S&P 500 Long Term Elliott Wave view suggests that the Index has reached the minimum target at 2234.35 to end a big cycle from an all time low. If we assume the Index starts from all-time low of 0, then the rally can be labelled as a zigzag Elliott Wave structure. The first leg wave A ended in March 2000 at 1553.11 during the dot com bubble. From 2000 peak, the Index corrected in 3 waves and reached 50% retracement at 766.67 in the year 2002. SPX then started a new leg higher which broke above 2000 peak in October 2007. Technically, with the break above 2000 peak, S&P formed a bullish sequence (a higher high) from all-time low and the natural path is to extend higher, especially considering that it has corrected 50% into 2002.
As SPX formed a new peak in the year 2007, the Market did an unexpected detour. Instead of the natural path of extending higher, the Index declined strongly in 5 waves into the year 2009 during the financial crisis due to subprime mortgage default and collapse of Lehman Brothers. This collapse is even captured in the movie titled "The Big Short" when several traders made money by correctly betting on the ensuing crash. In reality however, these traders got lucky as they were trading against a natural cycle, which happens only in a wave C of a FLAT structure.
The decline broke below 2002 low, sentiment was very negative at that time and no one was talking about buying the Index. What people don't realize is that the Market is a reflection of human progress and thus it should never go back to zero. Correction is natural and allows the market to reset. The Market ended a 3-3-5 Expanded Flat Elliott Wave structure in 2009 and then began the Big Long. Interestingly, nobody is filming or talking about the Big Long, and nowadays most people still talk about the impending big crash almost every single year even when the market keeps rallying. Almost nobody is talking about how great the move higher is as people don't understand the primary trend in the human nature is up.
Right now, S&P has reached an interesting weekly inflection area in which we can label the entire move from all time 0 as a zigzag Elliott Wave Structure. Wave A started from all-time 0 to 2000 high. The 3 waves correction from 2000 high to 2009 low is labelled as wave B and take the form of Expanded Flat. Then from 2009 low to present day, it is labelled as wave C. The minimum target wave C = A at 2234.35 has been reached, but that doesn't mean the Indices will crash from here. We acknowledge that the Index could indeed have a decent pullback from this area, but keep in mind that it's possible for the Index to extend higher within the blue box at 2234.35 (100% of A-B) – 3196.41 (161.8% of A-B). If the Index reaches 3196.41, then the whole move from all-time 0 can be labelled instead as 1-2-3. If reaching 3196.4, the third wave in this case is extended, which is the typical characteristic of wave 3 in an impulse. Thus the Big Long at this point in time can even become an extra Big Long, until it gets denied.
SPX S&P 500 Long Term Elliott Wave Chart
Dow Jones Firmly in Red
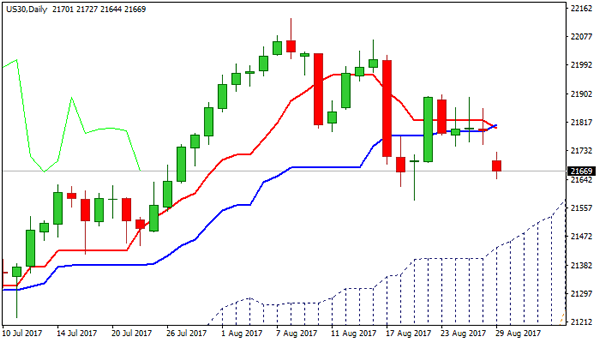
Dow Jones contract for September delivery is heading into US session on Tuesday firmly in red, following day's start with gap lower after rising geopolitical tensions prompted investors from riskier assets. Fresh weakness on Tuesday generated direction signal after triple Doji on daily chart signaled strong indecision. Rising 55SMA (currently at 21621) which contained previous attempt lower comes under pressure again. Break below is needed to confirm lower platform at 21985 and expose next strong supports at 21499 (Fibo 38.2% of 20477/22131 upleg) and 21457 (top of rising daily cloud). Strong bearish sentiment is supported by negative setup of daily studies, as bearish momentum is building up and indicators heading south. Formation of Tenkan-sen/ Kijun-sen bear-cross is reinforcing negative near-term outlook. Bearish pressure is expected to persist while today's gap remains unfilled.
Res: 21727; 21800; 21895; 21921
Sup: 21621; 21580; 21499; 21457
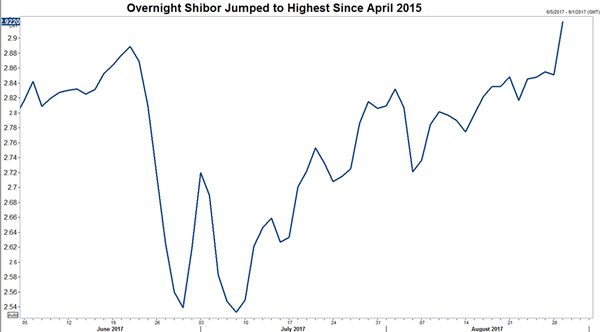
China’s Monetary Conditions Remain Tight as Deleveraging in Progress
The two key phenomena, tightening in liquidity condition and renminbi strength, in the Chinese market have persisted. Last week, PBOC auctioned RMB 80B of 3-month Treasury deposits at 4.51%, the highest since December 2014. This came in after another auction of 3-month Treasury deposits on August 18, at 4.46%. Higher interest rates signaled that the government is trying to increase the borrowing cost, tightening money supply. Indeed, liquidity conditions have remained tight in China, with both interbank rates and bond yields higher. Renminbi firmed, thanks to the broad-based weakness in the greenback and the Chinese government's capital control measures. USDCNY fixing has fallen to 6.6293, lowest level since August 2016, on Tuesday. The current liquidity environment and renminbi strength are in line with PBOC's "prudent and neutral" monetary policy stance, with the main goal of "deleveraging".
1. The Trend of Tighter Liquidity Conditions Continues
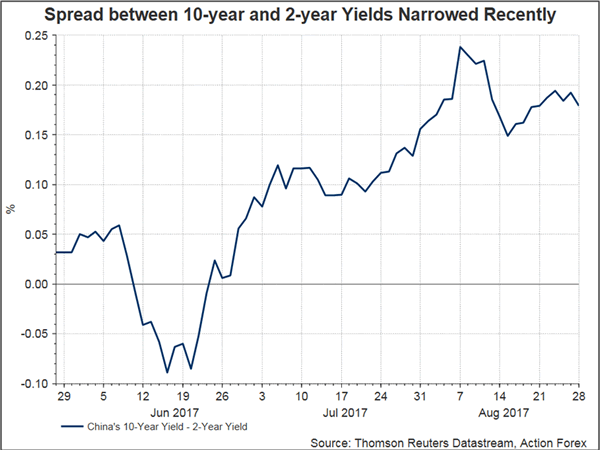
Overnight SHIBOR jumped to 2.92% on Tuesday, a level not seen since April 2015. This also marked a +7.1 bps increase from the prior day and +10.5 bps from the same period last year. Indeed, overnight SHIBOR has increased 175 bps in the first three weeks of August. The tightened liquidity condition has pushed bond yields higher. 5-year yields eased modestly to 3.65%, after soaring to a 2.5-month high of 3.652% on Monday, while 10-year yields also stayed high at 3.694%, after a rise to 3.702%, highest since May 11, 2017, on Monday. Note also that the spread between 10-year and 2-year government bond yields has narrowed recently. PBOC refrained from injecting liquidity to the market, draining a net RMB 330B, last week. We expect the liquidity would remain tight, if not tighter, in the coming month, as a record RMB 2.3 trillion in maturities of negotiable certificates of deposit (NCDs).
Negotiable Certificates of Deposit (NCDs)
One of the key areas of the government's deleveraging work is to curb NCDs which have mushroomed as a result of the accommodative monetary policies after the global financial crisis. The value of outstanding NCDs expanded to RMB 8.43 trillion as of July. NCDs contribute to 13% of total bond market in China this year, up from 1.7% in 2014.
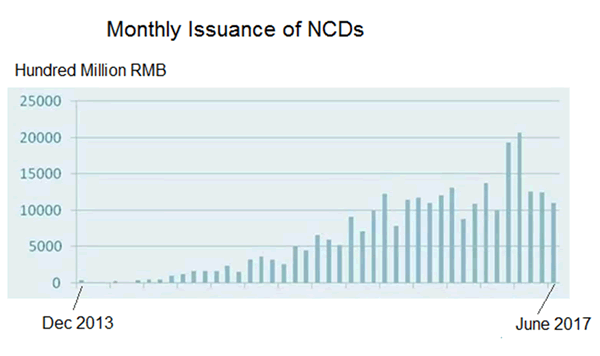
Regulatory loopholes have made NCDs a popular way of financing for small banks (banks outside of top 10 by market value accounted for 76% of total sales) in China. The unruly manipulation of NCDs as a means of financing has resulted in a serious problem of asset liability maturity mismatches that the government seeks to tackle now.
The flowchart below illustrates the mechanism of NCDs. Small banks are keen on issuing short-term NCDs to large banks which are able to acquire funds at low cost in an environment of accommodative monetary policy. Upon acquiring the funding through NCDs, small banks then invest by purchasing NCDs issued by other banks and invest in wealth management products (funds, private equities, stocks, etc) which are usually longer-term investments. The problem of asset liability maturity mismatches appears here: the small banks make profits by issuing shorter-term NCDs and investing in longer-term instruments. However, they would fail to repay its debts to the large banks as they are bound by the longer-term investments. This has created a vicious cycle as the small banks have to keep issuing new NCDs for refinancing or they would have to sell their investments.
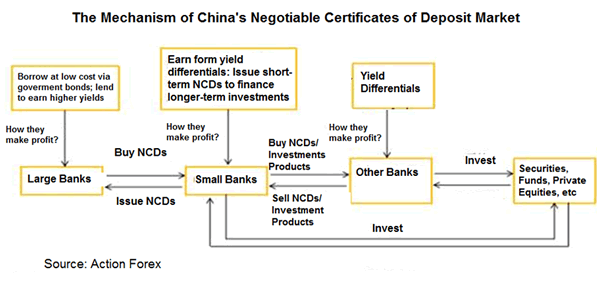
Although financial institutions are required to cap interbank liability at 33% of total liability, NCDs are not included although it has the same function as interbank liability. Therefore, NCDs have been virtually unregulated until recently. At the second quarter monetary policy report, PBOC pledged that NCD would be included in the interbank liability indicator in the macro-prudential assessment (MPA) from 1Q18 – treating NCDs as interbank liability.
As illustrated above, the root cause of NCDs is the easy money acquired by large banks. We expect the central bank to continue to maintain a relative high interest rate environment so as to increase the cost of issuing NCDs.
2. China Favors Renminbi Strength
Another phenomenon is the strength of renminbi, thanks to the broad-based weakness in the greenback and the Chinese government's capital control measures. USDCNY fixing has fallen to 6.6293, lowest level since August 2016, on August 29. We believe the government is in favor of a stronger renminbi, not only because it helps tightens the monetary policy, but also because it attracts foreign capital inflow.
Indeed, the government has continued its capital control measures so as maintain a relatively firm renminbi. The National Development and Reform Commission (NDRC) on August 18 issued new rules on foreign investments, introducing three categories, namely banned, restricted and encouraged of investments. According to NDRC, banned industries include those in the military, gambling and sex industries; restricted industries include those in real estate and hotels, film and entertainment, sports, and those that do not comply with environmental standards; and encouraged industries include those that promote the Belt and Road, improve China's technology or research and development, and those that expand oil, mining, agriculture and fishing. This marks another layer of restrictions over capital outflow.
We will be receiving the August FX reserve next week. We expect FX reserve to remain strong for another month. Given the weak USD, it is less necessary for PBOC to sell foreign currencies to support renminbi.
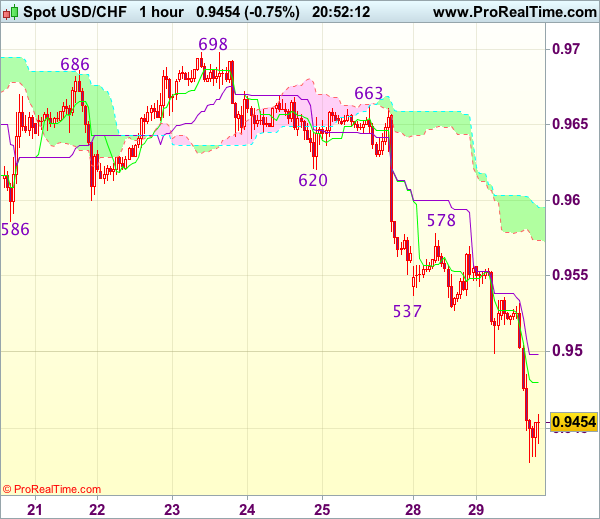
Trade Idea Update: USD/CHF – Sell at 0.9520
USD/CHF - 0.9457
Original strategy :
Sell at 0.9520, Target: 0.9420, Stop: 0.9555
Position : -
Target : -
Stop : -
New strategy :
Sell at 0.9520, Target: 0.9420, Stop: 0.9555
Position : -
Target : -
Stop : -
As the greenback has dropped again after brief recovery, adding credence to our view that top has been formed at 0.9773 earlier and bearishness is seen for the erratic decline from there to extend weakness to 0.9400-10, however, near term oversold condition should prevent sharp fall below 0.9370-75 and reckon 0.9350 would hold from here, risk from there has increased for a rebound later.
In view of this, would not chase this fall at current level and we are looking to sell dollar on recovery as previous support at 0.9537 should turn into resistance and limit dollar’s upside, bring another decline. Only above resistance at 0.9578-83 would abort and signal low is formed, bring a stronger rebound towards 0.9620.
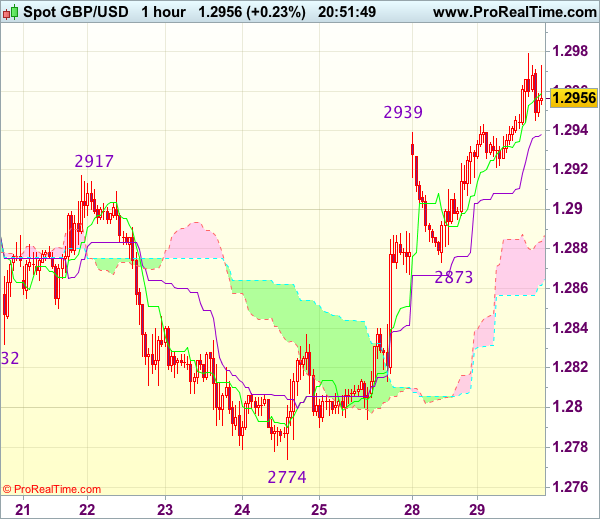
GBP/USD Rejected from 50 Day Moving Average
Broad-based U.S dollar weakness provoked a bullish move above the 1.2920 level, however, sterling has been strongly rejected from 1.2979 level, which represents the GBPUSD pairs daily time frame, 50 period moving average.
At present, the pair is trading around the 1.2950 level, as traders await the start of the U.S trading session, with North Korea and a key speech Federal Reserve voting member Charles Evans in focus.
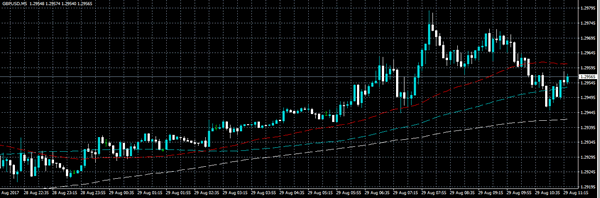
GBPUSD is strongly bullish on an intraday basis, with the pair now trading back above both 100-day and 200-day moving averages.
Technical resistance is found at 1.2980, while the1.3000 level offers strong psychological resistance. Above the 1.3000 level, the 50 percent Fibonacci retracement of the 1.2773 price low, to the 1.3268 high, is found at 1.3020.
To the downside, the M5 time frame, 200 period moving average is found at 1.2940. The 100-day moving average offers solid intraday support, at 1.2920, with the 1.2890 level acting as critical weekly support.
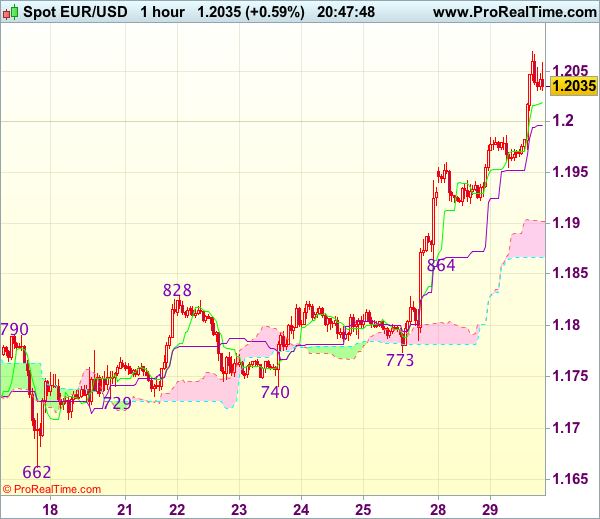
EUR/USD Hits 1.2070
The single currency has broken above the psychological 1.20 level, hitting 1.2070, in a busy European trading session, that saw the euro move to a 27-month trading high against the U.S dollar.
During the upcoming U.S trading session, the euro may soon start to challenge to the 1.2100 level, as selling in the U.S dollar index accelerates, with the greenback now firmly technically and fundamentally bearish.
Going forward, if the EURUSD pair can hold price action above the key 1.2030 support level, buyers should take the pair for a further attempt at the 1.2070 level.
Key technical resistance above the 1.2070 level is located at 1.2100, 1.2120, with historical EURUSD Fibonacci resistance found at the 1.2160 level.
To the downside, the July 2012 price low is now critical EURUSD resistance turned support, at 1.2030. Below 1.2030, the 1.2000 level is strong psychological support, with the 1.1960 level now offering the foremost support below 1.2000.
Trade Idea Update: GBP/USD – Buy at 1.2900
GBP/USD - 1.2950
Original strategy :
Buy at 1.2920, Target: 1.3020, Stop: 1.2885
Position : -
Target : -
Stop : -
New strategy :
Buy at 1.2900, Target: 1.3000, Stop: 1.2865
Position : -
Target : -
Stop : -
As cable surged again after finding renewed buying interest at 1.2873 yesterday, adding credence to our view that a temporary low has been formed at 1.2774 last week and bullishness remains for the rise from there to bring retracement of recent decline, hence further gain to 1.3000 and later towards previous resistance at 1.3032 would be seen, however, near term overbought condition should limit upside and reckon 1.3075-80 would hold from here.
In view of this, we are looking to buy sterling on pullback as 1.2900 should limit downside. Below 1.2895-00 would defer and risk test of said support at 1.2873 but only break there would signal first leg of upmove from 1.2774 has ended, risk weakness to 1.2840-50 but support at 1.2813 should remain intact, bring another rebound later.
Trade Idea Update: EUR/USD – Buy at 1.1965
EUR/USD - 1.2032
Original strategy :
Buy at 1.2000, Target: 1.2100, Stop: 1.1965
Position : -
Target : -
Stop : -
New strategy :
Buy at 1.1965, Target: 1.2065, Stop: 1.1930
Position : -
Target : -
Stop : -
As euro’s upmove has accelerated after last week’s anticipated rally above previous resistance at 1.1910 (now support), adding credence to our bullish view that recent upmove is still in progress and may extend headway to 1.2070 and then 1.2095-00, however, near term overbought condition should limit upside and reckon 1.2150-55 (61.8% projection of 1.1119-1.1910 measuring from 1.1662) would hold from here, bring retreat later.
In view of this, would not chase this rise here and would be prudent to reinstate long on pullback as 1.1955-65 should limit downside. Only below 1.1930 would defer and risk test of support area at 1.1910-13 which is likely to hold from here.
Gold Flies Alongside North Korea’s Missile
Overnight, North Korea fired a missile that flew over Japan, violating the nation's airspace. This marked further escalation in the region's geopolitical tensions, which triggered a classic risk-off market reaction. Safe haven assets such as gold, the Japanese yen, and the Swiss franc rallied on the news, while major equity indices edged lower.
In the short-term, we expect market action to be driven by incoming headlines on the subject. Japanese PM Abe already called for fresh UN sanctions on North Korea, which we view as a "soft" and diplomatic approach. Nonetheless, key US officials (such as the President) have not yet commented on this latest show of force by the North Korean regime. If we were to see another round of hard rhetoric from the US administration, or some form of action, then risk-aversion could continue to drive markets. Specifically, gold and other safe havens could gain further, while riskier assets could remain under pressure. Having said that, unless the situation intensifies to the degree of military intervention, we don't expect this negative sentiment to remain the main market theme for too long.
Gold surged during the European afternoon Monday, to break above the key psychological barrier of 1300 (S2). The metal gapped further up during the Asian morning Tuesday after North Korea fired a missile over Japan to hit resistance at 1325 (R1). The price structure on the 4-hour chart suggests a short-term uptrend marked by the uptrend line taken from the low of 10th of July. Thus, we would expect a clear break above 1325 (R1) to set the stage for more bullish extensions, perhaps towards our next resistance level of 1340 (R2). The trigger for further advances may be further escalation in geopolitical tensions.
Having said that though, given that the latest rally appears overextended, and also taking account our proximity to the return line drawn from the peak of the 7th of July, we stay careful of a possible retreat before the bulls decide to take charge again. A dip below 1313 (S1) may confirm the case and is possible to open the way for a test near the 1300 (S2) zone as a support this time. Our short-term oscillators enhance our concerns. The RSI shows signs that it could top within its above-70 zone, while the MACD, although above both its zero and trigger lines, shows signs that it could start topping as well.
Zooming out to the daily chart, we see that the 1300 (S2) zone acted as the upper bound of the wide range the yellow metal has been trading within since the 31st of January, between that hurdle and the 1200 territory. As such, its clearing make us confident that the medium-term outlook may have also turned somewhat positive.