Sample Category Title
USD/CAD Mid-Day Outlook
Daily Pivots: (S1) 1.2618; (P) 1.2650; (R1) 1.2714; More....
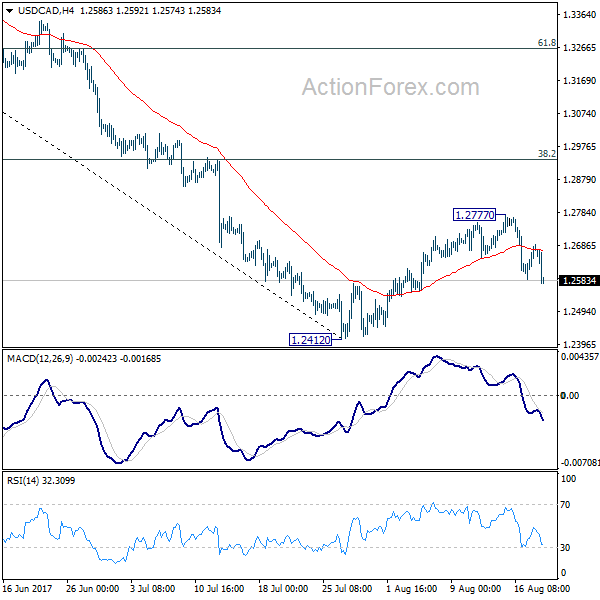
USD/CAD's decline from 1.2777 extends today after brief recovery was rejected by 4 hour 55 EMA. As noted before, corrective rise from 2.2412 should have completed at 1.2777 already. Intraday bias stays on the downside for retesting 1.2412 low. Break there will resume the larger decline and target next long term fibonacci level at 1.2048. On the upside, above 1.2777 will extend the recovery. But we'd expect upside to be limited by 38.2% retracement of 1.3793 to 1.2412 at 1.2940 to bring fall resumption.
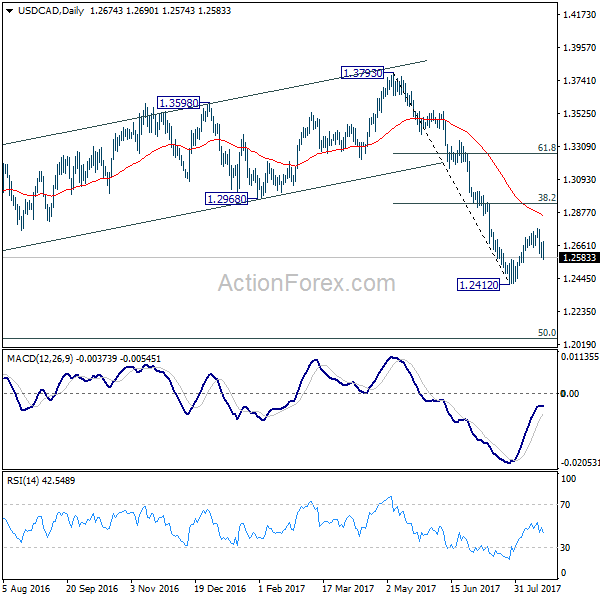
In the bigger picture, price actions from 1.4689 medium term top are seen as a correction pattern. Such corrective fall is still expected to extend to 50% retracement of 0.9406 to 1.4869 at 1.2048. At this point, we'd look for strong support from there to contain downside and bring rebound. Nonetheless, on the upside, sustained break of 1.2968, 38.2% retracement of 1.3793 to 1.2412 at 1.2940 will be the first sign of completion of the correction and will turn focus back to 1.3793 key resistance.
Dollar Broadly Lower on White House Drama, Canadian Higher after CPI
The financial markets some what stabilized mildly after the selloff triggered by the terrorist attack in Spain and drama in the White House. At the time of writing, FTSE is trading down -0.1% while DAX is down -0.4%. US futures point to a flat open. In the currency markets, Dollar is trading broadly down today, but for the week, it's still in black against Euro and Sterling. The Pound will most likely end the week as the weakest. Commodity currencies are holding the ground even though yen surged since yesterday. In particular, Canadian Dollar is helped by positive inflation data. In other markets, Gold finally takes out 1300 handle today as buying gains steam.
White House remains a major focus
The markets continue to watch and be sensitive to the developments in the White House. For now, Gary Cohn, a key force behind Trump's tax reform program is staying despite the resignation rumor. But there are growing voices of disapproval from US President Donald Trumps' own party. One of the most respected Senate Republicans Bob Corker criticized that Trump "has not yet been able to demonstrate the stability nor some of the competence that he needs to demonstrate in order to be successful." Corker went further and said hat Trump "has not demonstrated that he understands the character of this nation. He has not demonstrated that he understands what has made this nation great". Corker also called for "radical changes" to take place at the White House".
UK will release Brexit papers next week
In UK, it's reported Prime Minister Theresa May's government is going to publish papers next week, detailing the Brexit approach. Two documents will be featured on Monday. One of them will focus on the way to treat confidential EU information obtained before Brexit. The other one will focus on making available the goods placed on supply chains in EU after Brexit. There would also be another paper dealing with how the Brexit deal should be enforced and how disputed would be resolved. This could be a controversial one as UK will likely oppose to EU's proposal of using the European Court of Justice. The papers could lay out some ground for the next round of negotiation in the week of August 28.
Canada CPI rose to 1.2% yoy
Canada headline CPI rose 0.0% mom, 1.2% yoy in July, in line with consensus. That compares to June's -0.1% mom, 1.0% yoy. Core CPI common was unchanged at 1.4% yoy. Core CPI trim rose to 1.3% yoy. Core CPI median rose to 1.7% yoy. The uptick in headline CPI was the first since January, thanks to higher gasoline price. While inflation is still way off BoC's target of 2%, it's possibly picking up momentum again. BoC is clear that it's open to further rate hike depending on data. And more incoming positive growth and inflation data could prompt policy makers to consider another hike later in the year or early next year.
Released elsewhere, German PPI rose 0.2% mom, 2.3% yoy in July. Eurozone current account surplus narrowed to EUR 21.2b in June.
On the data front
German PPI and Eurozone current account are the main features in European session. Canada CPI is the main focus later in the day and U of Michigan confidence will be featured.
USD/CAD Mid-Day Outlook
Daily Pivots: (S1) 1.2618; (P) 1.2650; (R1) 1.2714; More....
USD/CAD's decline from 1.2777 extends today after brief recovery was rejected by 4 hour 55 EMA. As noted before, corrective rise from 2.2412 should have completed at 1.2777 already. Intraday bias stays on the downside for retesting 1.2412 low. Break there will resume the larger decline and target next long term fibonacci level at 1.2048. On the upside, above 1.2777 will extend the recovery. But we'd expect upside to be limited by 38.2% retracement of 1.3793 to 1.2412 at 1.2940 to bring fall resumption.
In the bigger picture, price actions from 1.4689 medium term top are seen as a correction pattern. Such corrective fall is still expected to extend to 50% retracement of 0.9406 to 1.4869 at 1.2048. At this point, we'd look for strong support from there to contain downside and bring rebound. Nonetheless, on the upside, sustained break of 1.2968, 38.2% retracement of 1.3793 to 1.2412 at 1.2940 will be the first sign of completion of the correction and will turn focus back to 1.3793 key resistance.
Economic Indicators Update
| GMT | Ccy | Events | Actual | Forecast | Previous | Revised |
|---|---|---|---|---|---|---|
| 06:00 | EUR | German PPI M/M Jul | 0.20% | 0.00% | 0.00% | |
| 06:00 | EUR | German PPI Y/Y Jul | 2.30% | 2.20% | 2.40% | |
| 08:00 | EUR | Eurozone Current Account (EUR) Jun | 21.2B | 27.3B | 30.1B | 30.5B |
| 12:30 | CAD | CPI M/M Jul | 0.00% | 0.00% | -0.10% | |
| 12:30 | CAD | CPI Y/Y Jul | 1.20% | 1.20% | 1.00% | |
| 12:30 | CAD | CPI Core - Common Y/Y Jul | 1.40% | 1.40% | ||
| 12:30 | CAD | CPI Core - Trim Y/Y Jul | 1.30% | 1.20% | ||
| 12:30 | CAD | CPI Core - Median Y/Y Jul | 1.70% | 1.60% | ||
| 14:00 | USD | U. of Michigan Confidence Aug P | 94 | 93.4 |
Trade Idea Update: USD/CHF – Stand aside
USD/CHF - 0.9605
New strategy :
Stand aside
Position : -
Target : -
Stop : -
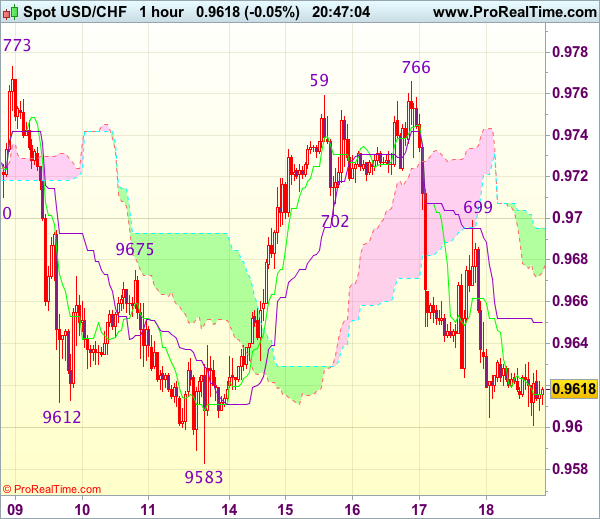
As the greenback has remained under pressure after yesterday’s selloff from 0.9699, suggesting near term downside risk remains for the fall from 0.9766 to extend weakness towards previous support at 0.9583, however, break there is needed to retain bearishness and signal another leg of decline from 0.9773 is underway and extend subsequent fall to 0.9550 which is likely to hold on first testing.
In view of this, would not chase this fall and stand aside for now. Above 0.9660-65 would bring another bounce to 0.9699 resistance but break there is needed to signal the fall from 0.9766 has ended, bring a stronger rebound to 0.9720-30, however, as broad outlook remains consolidative, said resistance at 0.9766 should hold.
Trade Idea : GBP/USD – Sell at 1.2935
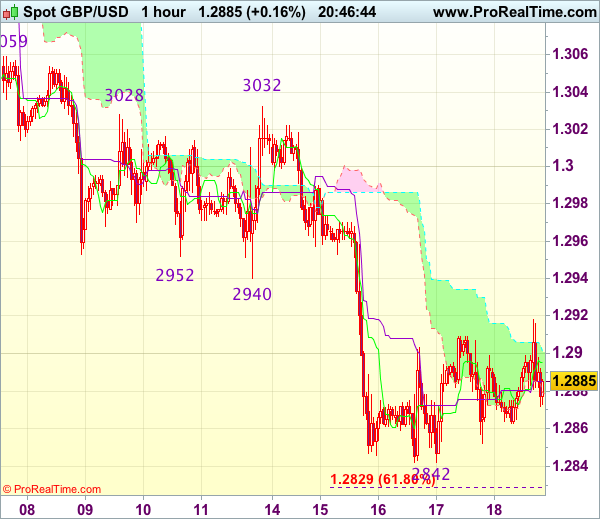
GBP/USD - 1.2886
Original strategy :
Sell at 1.2920, Target: 1.2820, Stop: 1.2955
Position : -
Target : -
Stop : -
New strategy :
Sell at 1.2935, Target: 1.2835, Stop: 1.2970
Position : -
Target : -
Stop : -
As cable has recovered after falling to 1.2842 earlier this week, suggesting consolidation above this level would be seen and corrective bounce to 1.2920 cannot be ruled out, however, reckon previous support at 1.2933-40 would turn into resistance and limit upside, bring another decline later, below said support at 1.2842 would extend recent selloff to 1.2825-30 (61.8% projection of 1.3269-1.2940 measuring from 1.3032), having said that, oversold condition should limit downside to 1.2800 and reckon 1.2770 would hold from here, bring rebound later.
In view of this, would not chase this fall here and would be prudent to sell sterling on recovery as said previous support at 1.2933 should cap cable’s upside, bring another decline. Above 1.2950 would defer and risk a stronger rebound to 1.2990-00 before another decline.
Trade Idea Update: EUR/USD – Hold long entered at 1.1715
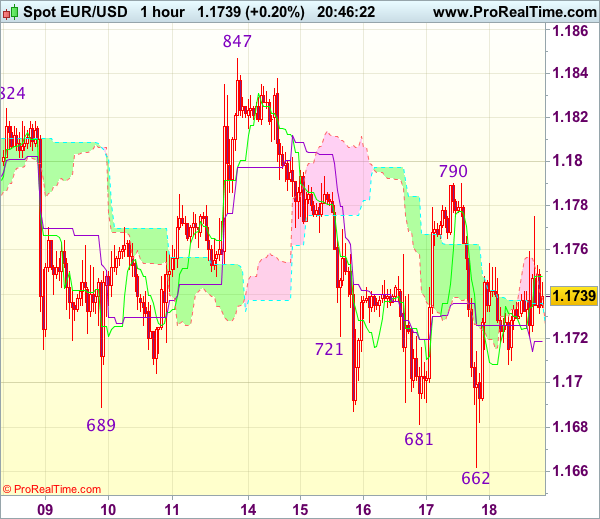
EUR/USD - 1.1743
Original strategy :
Bought at 1.1715, Target: 1.1815, Stop: 1.1680
Position : - Long at 1.1715
Target : - 1.1815
Stop : - 1.1680
New strategy :
Hold long entered at 1.1715, Target: 1.1815, Stop: 1.1680
Position : - Long at 1.1715
Target : - 1.1815
Stop : - 1.1680
Although the single currency fell briefly to 1.1662 yesterday, the subsequent rebound suggests a temporary low is possibly formed there and consolidation with mild upside bias remains for another test of indicated resistance at 1.1790, however, break there is needed to add credence to this view, bring further gain to 1.1820 but resistance at 1.1847 should hold from here.
In view of this, we are holding on to our long position entered at 1.1715. Below 1.1680-85 would risk retest of 1.1662, break there would extend the erratic decline from 1.1910 top to 1.1640-50 (50% Fibonacci retracement of 1.1370-1.1910 and previous support) but reckon 1.1600 would hold from here.
Trade Idea Update: USD/JPY – Stand aside
USD/JPY - 109.02
New strategy :
Stand aside
Position : -
Target : -
Stop : -
Although the greenback has fallen again after meeting renewed selling interest at 110.37 and near term downside risk remains for weakness towards previous support at 108.73, as broad outlook remains consolidative, reckon downside would be limited and bring rebound later due to near term oversold condition. A firm break below said support at 108.73 would signal recent decline has finally resumed and extend weakness to 108.50 first.
In view of this, would not chase this fall here and would be prudent to stand aside for now. Above 109.50-55 would bring recovery to the Kijun-Sen (now at 109.67) but upside should be limited to the lower Kumo (now at 110.13) and said resistance at 110.37 should hold from here, bring another decline.

Will Central Banks Ratchet Up Verbal Intervention?
Central banks around the globe have been increasingly vocal this year, with their trend of repeated verbal interventions sending foreign exchange markets on a wild roller-coaster ride.
The era of cheap money is coming to a timely end, with central banks now on a quest to raise rates at a pace that supports both growth and inflation. Markets will be closely watching the Jackson Hole Symposium on the 24th-26thAugust, which could provide a joint opportunity for financial heavyweights to signal policy shifts. Although there have been reports that European Central Bank President Draghi, will not deliver a new policy message at the conference, there is still a possibility that he will talk down the resurgent Euro. With July's ECB meeting minutes revealing concerns over the strengthening Euro, complicating the European Central Bank's efforts to hit the 2% inflation target, Draghi may verbally intervene at Jackson Hole to weaken the currency.
Other heavyweights such as Janet Yellen and Mark Carney, will also be on the scene with market players, closely scrutinizing any comments made regarding monetary policy. With concerns over stubbornly low inflation and political drama in Washington, weighing on the prospects of higher US interest rates, Yellen may avoid discussions on policy shifts altogether. The unsavory combination of Brexit uncertainty and soft economic fundamentals in the UK continues to weigh on the prospects of higher UK rates and this may be reflected in Mark Carney's rhetoric at the pending Jackson Hole.
Will EURGBP hit parity?
There is growing speculation that the EURGBP is on a positive trajectory towards parity in the longer term and this is understandable when considering how the pair has appreciated over 800 pips from the 0.8300 support. The improving macro-fundamentals from Europe, continue to support the Euro, while Brexit uncertainty has pressured the Sterling. With the expectations of the ECB QE tapering - fueling the bullish sentiment towards the EURGBP, further upside is on the cards.
From a technical standpoint, the EURGBP is heavily bullish on the daily charts, as there have been consistently higher highs and higher lows. Bulls remain in control above the 0.9000 higher low,with a breakout above 0.9150 encouraging a further increase towards 0.9300. A monthly close above 0.9300 should open a path higher towards 0.9600.
EUR/JPY Elliott Wave Analysis
EUR/JPY - 128.25
Despite staging a rebound initially this week, as the single currency ran into renewed selling interest at 130.40 and has retreated quite sharply, retaining our view that further consolidation below recent high of 131.40 would be seen and risk of another test of 128.05 (last week’s low) cannot be ruled out, break there would bring retracement of recent upmove to 127.96 (38.2% Fibonacci retracement of 122.38-131.40), then test of support at 127.44 but break of latter level is needed to provide confirmation, bring further fall to 126.45-50, having said that, price should stay above previous resistance at 125.82 (now support) and euro may head north again from there. Only a sustained breach below this level would signal correction of recent upmove has commenced for further fall to 125.15-20 but previous resistance at 124.65 would hold from here.
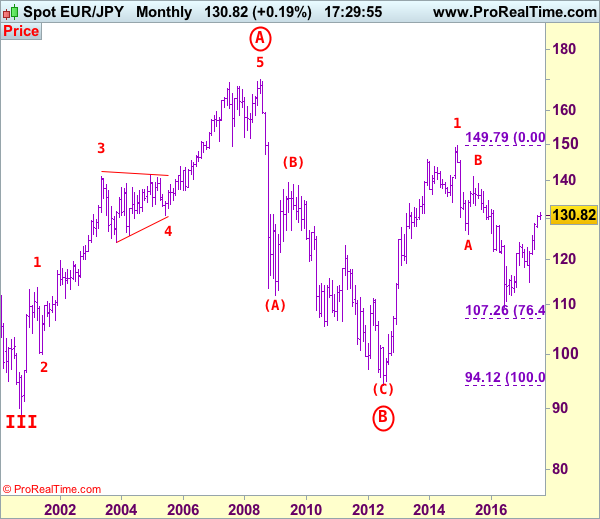
The daily chart is labeled as attached, early selloff from 169.97 (July 2008) to 112.08 is wave (A) of B instead of end of entire wave B and then the rebound from there to 139.26 is wave (B), hence, wave (C) has possibly ended at 94.12 with a diagonal triangle as labeled in the daily chart, hence upside bias is seen for further gain. Recent rally above indicated retracement level at 116.69 (50% Fibonacci retracement of the intermediate fall from 139.26-94.12) adds credence to this view and signal major reversal has commenced but first leg of this wave C has possibly ended at 149.79, hence wave 2 has commenced with wave A ended at 126.09, followed by wave B at 141.06, wave C commenced and could have ended at 109.49, above 126.00 would add credence to this view, then headway to 130.00 would follow.
On the upside, whilst initial recovery to 129.50-60 cannot be ruled out, reckon upside would be limited to 130.00 and said resistance at 130.40 would remain intact, bring another decline later. Above said resistance at 130.40 would signal the retreat from 131.40 has ended instead, risk a stronger rebound to 130.80-85 and price should falter below 131.40, bring another leg of corrective decline later this month. Only above said resistance at 131.40 would extend medium term upmove from 109.49 low (2016 low) to extend further gain to 132.00-10, however, overbought condition should prevent sharp move beyond 132.90-00 (1.236 times projection of 109.49-124.10 measuring from 114.85) and price should falter well below previous chart resistance at 134.59.
Recommendation: Stand aside for this week.
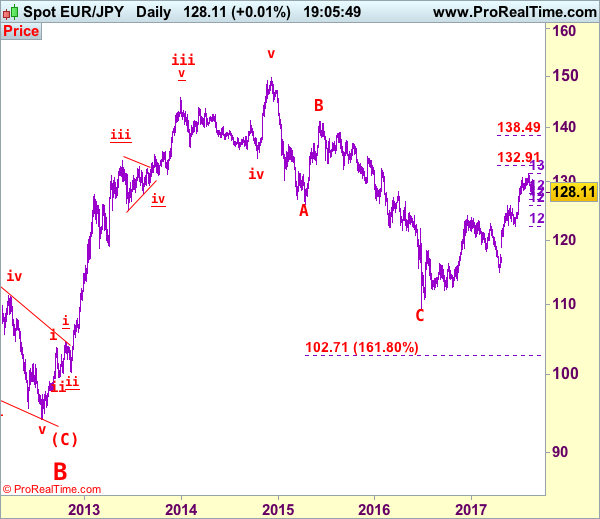
To re-cap the corrective upmove from the record low of 88.93 (18 Oct 2000), the wave A from there is subdivided as: 1:88.93-113.72, 2:99.88 (1 Jun 2001), 3:140.91 (30 May 2003), 4:124.17 (10 Nov 2003) and 5 ended at record high of 169.97 (21 Jul 2008). The brief but sharp selloff to 112.08 is viewed as a-b-c x a-b-c wave (A) of B. The subsequent rebound to 139.26 is (B) of B and (C) of (B) has possibly ended at 94.12 and in any case price should stay well above previous chart support at 88.93, bring rally in larger degree wave C towards 150.00.
Traders Risk Averse On Cohn Resignation Speculation
- Cohn resignation would cap off a dreadful week for Trump;
- Gold could breach $1,300 if Cohn resigns;
- USD softening as traders bet against another rate hike.
We're seeing risk aversion in the markets again on Friday, with the possibility of a self-inflicted crisis within Donald Trump's White House and another terror attack, this time in Barcelona, weighing on risk appetite.
Trump has been no stranger to controversy in his short time as President but the latest entirely unnecessary and avoidable situation could prove quite costly for him. Trump has already this week been forced to dissolve his manufacturing council and the strategic and policy forum, while his infrastructure council never even got off the ground, after numerous CEO's withdrew from the initiatives due to his response to the white supremacy rally in Charlottesville, Virginia, last weekend.
The next casualty could be the most costly of the lot, with speculation growing that Gary Cohn – a key figurehead in Trump's tax reform and spending initiatives – could resign from his position as National Economic Council Director. This would be a bitter blow for Trump and be the icing on the cake of what has been a dreadful week for the President. The negativity is flowing through to the markets as well as such a move would cast doubt over whether Trump will deliver on his tax reform and spending promises in the foreseeable future, two things that have been at least partly responsible for the post-election rally in the markets.
The traditional safe havens are once again being preferred today, with Gold up half a percent to trade close to $1,300 once again. It seems there's a number of factors driving the bullish case for Gold at the moment – a weak dollar, US political risk, geopolitical risk – and a Gary Cohn resignation could be the straw that breaks the camels back and drives it through $1,300. Gold has already hit a 9 month high today but a break through $1,300 could trigger much bigger gains, with $1,340 potentially offering the next test.
The yen is being favoured once again in the fx space and is now on course for a third consecutive day of gains. The yen is looking particularly bullish against the pound and a break below 140 in the pair could be the catalyst for another push lower. The dollar is a little soft once again, with Wednesday's minutes providing the dovish undertones that traders have been waiting for in recent months. With Treasury yields continuing to creep lower and the probability of a rate hike now standing at only 42%, the Fed may now have a job on its hands delivering on a third increase this year.
The preliminary UoM consumer sentiment figure is the only notable economic release on Friday but we will also hear from the Fed's Robert Kaplan again after he yesterday called for patience on rates in the face of weak US inflation.
USD/CHF Elliott Wave Analysis
USD/CHF – 0.9643
Although the greenback rebounded initially this week, as price has retreated again after faltering below resistance at 0.9773, suggesting initial downside risk is for weakness to 0.9583 support, however, as early strong rebound from 0.9438 to 0.9773 signals a temporary low has possibly been formed at 0.9438, reckon downside would be limited to 0.9540-50 and bring another rebound later. Above 0.9700 would bring another bounce to 0.9773 resistance but break there is needed to add credence to this view and extend the rebound from 0.9438 low for further gain to 0.9845-50 (61.8% Fibonacci retracement of 1.0100-0.9438) but reckon upside would be limited to 0.9890-00 and price should falter well below psychological resistance at 1.0000.
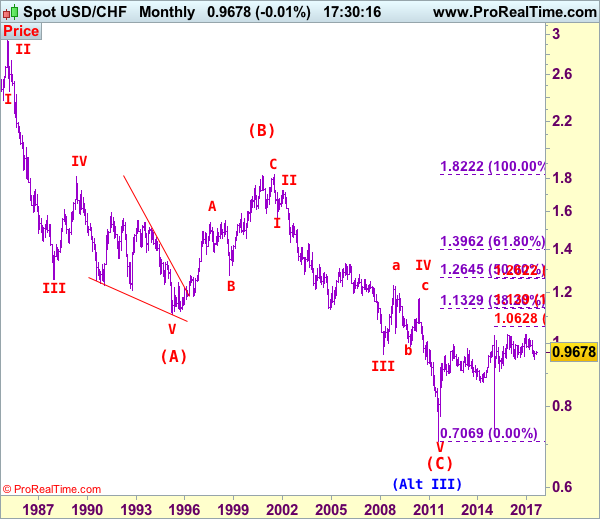
Our preferred count on the daily chart is that early selloff to 0.9630 is an end of the larger degree wave III and major correction is unfolding from there with a leg ended at 1.2298 (Nov 2008 with (a): 1.0625, (b):1.0011 and (c):1.2298), wave b ended at 0.9910 with (a): 1.0370, (b): 1.1967, (c): 0.9910. The rise from there to 1.1730 is the wave c which also marked the end of wave IV and wave V has possibly ended at 0.7068.
On the downside, whilst initial pullback to 0.9580-85 cannot be ruled out, reckon 0.9550-55 would limit downside and bring another rebound to aforesaid upside targets. Only a drop below said recent low at 0.9438 would revive bearishness and signal the erratic decline from 1.0344 top (formed back in late 2016) is still in progress and downside bias remains for this move to extend weakness to 0.9390-00, however, loss of downward momentum should prevent sharp fall below 0.9300-10, risk from there has increased for a rebound to take place probably later.
Recommendation: Buy at 0.9555 for 0.9755 with stop below 0.9455
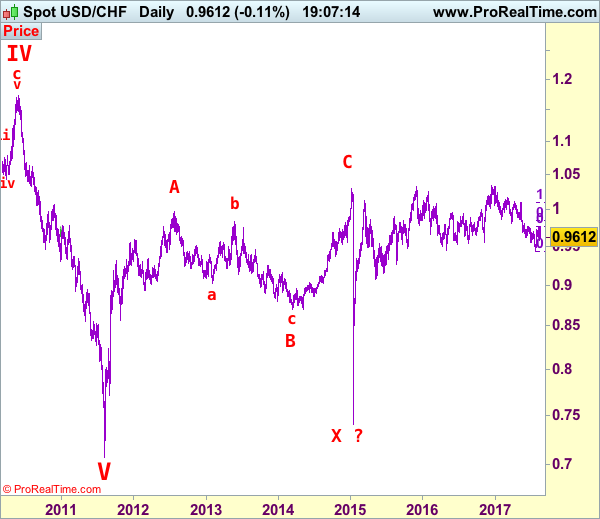
Dollar's long-term downtrend started from 2.9343 (Feb 1995) and it was unfolding as a (A)-(B)-(C) with (A): 1.1100, (B): 1.8310 (26 Oct 2000), then followed by another impulsive wave (C) with wave III ended at 0.9630 (Mar 2008). Under this count, correction in wave IV has possibly ended at 1.1730 and wave V already broke below support at 0.9630 and met indicated downside target at 0.7500 and 0.7400. The reversal from 0.7068 suggests the wave V has possibly ended and the breach of resistance at 0.9595 add credence to this view and indicated upside target at 1.0000 had been met, however, the sharp retreat from 1.0296 to 0.7401 suggests choppy trading would be seen but price should stay above said record low at 0.7068.