Sample Category Title
Geopolitical Issues Command Forex Markets Again In Absence Of Economic Data
In the absence of any significant economic data releases during the Asian session, political turmoil out of Washington and a terrorist attack in Spain dominated the news-flow in forex markets. The dollar weakened against most major currencies, with the yen getting a relatively significant boost.
Investors' concerns over the Trump administration's ability to realize any of the campaign-promised agenda were renewed this week. Following President Trump's remarks on violence in Virginia, many CEO's stepped down from business councils run by the President, which forced him to dismantle the two bodies. Further to this, the President publicly criticized two Republican Senators that disapproved his comments on race. Speculation of a potential departure of Gary Cohn, the president's lead official on tax reform added to the market unease.
Ahead of the European session, the dollar/yen pair fell to 109.24, euro/dollar rose to 1.1737 and sterling firmed to $1.2884.
The euro rose against the dollar, mostly linked to the weakness in the US currency as the released minutes from the latest European Central Bank meeting showed a dovish tone among policymakers. The euro recovered from yesterday's three-week low, despite another terrorist turmoil on the old continent. The first attack left at least 13 people dead and several injured after a van hit pedestrians on one of the busiest streets in Barcelona yesterday. The second attack was prevented by the police that shot five suicide bombers in the small town of Cambrils.
In terms of economic data, German PPI was the sole data release out of the eurozone. The annualized producer price index surprised to the upside by increasing 2.3% instead of the forecasted 2.2%. On a monthly basis, the index also surprised positively as it rose 0.2% in July, above the 0.1% forecasted and from stagnation recorded in June.
Sterling was trading higher in the wake of the weaker dollar, despite the pound's fall yesterday following the retail sales figures for July showed a slowdown in consumer spending.
The Canadian dollar rose significantly against the greenback ahead of the inflation report due later today. Dollar/loonie was last trading at 1.2645. Economists are expecting monthly inflation to rise 0.1% against a decline of 0.1% in the prior month. Annually, the consumer price index is forecasted to hit 1.2% versus 1.0% gain reported last month.
Oil prices rose, with WTI last trading at $47.14 a barrel and Brent at $51.12. Gold prices spiked during the Asian session to last trade at $1,294.12 an ounce, its highest since beginning of June.
US Dollar Grinding Lower Towards 108.80 Vs Japanese Yen
Key Highlights
- The US Dollar after trading as high as 110.95 against the Japanese Yen found offers and declined.
- The USD/JPY pair failed near a major resistance area at 110.90-111.00 and traded below the 100 SMA (H4).
- Germany's Producer Price Index for July 2017 posted an increase of 0.2% (MoM).
- Today, Canada's Consumer Price Index for July 2017 will be released, which is forecasted to increase 1.2% (YoY).
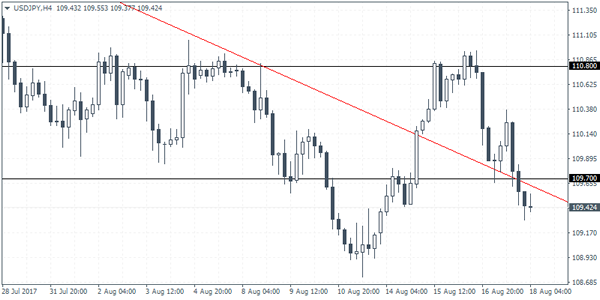
USD/JPY Technical Analysis
The US Dollar traded with a bullish bias this week until it found sellers near 111.00 against the Japanese Yen. The USD/JPY pair is trading lower and looks poised to extend declines towards 108.80.
The main reason for failure near 110.90-110.00 was a bearish trend line on the 4-hours chart. The mentioned 111.00 level is also a previous support turned resistance.
The pair declined during the past few sessions, and broke a bullish trend line at 109.88. It also cleared the 100 simple moving average (H4) and the 61.8% Fib retracement level of the last wave from the 108.72 low to 110.94 high.
Therefore, there are high chances of USD/JPY retesting the last swing low of 108.72. On the upside, an initial resistance sits at 109.90. Above 109.90, the next major hurdle for buyers is at 110.30 and the 100 SMA (H4).
Germany's Producer Price Index
Recently in the Euro Zone, the German Producer Price Index for July 2017 was released by the Statistisches Bundesamt Deutschland. The market was looking for the PPI to remain flat compared with the previous month.
The actual result was above the market expectation, as there was an increase of 0.2% in the index. Looking at the yearly change, the PPI was expected to increase by 2.2%, less than the last +2.4%. However, it came in at 2.3%.
The report pointed out that:
In July 2017 the price indices of all main industrial groups increased compared with July 2016: Prices of non-durable consumer goods rose by 3.7%, prices of intermediate goods by 3.0%. Energy prices rose by 1.9%, though the development of prices of the different energy carriers diverged.
The EUR/USD pair was neutral, and traded in a range above the 1.1700 support. On the upside, the 100 SMA (H4) at 1.1775 is a major resistance for buyers.
US Political Tensions Return
US Political tensions took center stage on Wednesday. USD lost ground following President Trump’s decision to disband two advisory councils, staffed by CEOs, and after he slammed Republican members of Congress who were critical of his recent remarks blaming weekend violence in Virginia on anti-racism activists as well as white nationalists. Eight Chief Executives, and other industry leaders, on the Presidents Manufacturing and Jobs Initiative groups had stepped down before Trump announced the disbanding of both councils. Minutes from July’s Federal Open Market Committee’s meeting revealed a split in opinion between Federal Reserve members with regards to the timing of the next interest rate hike. One side has concerns over what would happen if the central bank delayed its hiking strategy, while the other group warned about the low-inflation environment. Recent data showed the number of Americans filing for unemployment benefits fell to a 6-month low last week. Initial claims for state unemployment benefits dropped to a seasonally-adjusted 232K versus 240K expected for the week that ended August 12. US factory production dropped 0.1% last month. Overall US industrial production rose 0.2% versus expectations of 0.3%.
EURUSD was little changed overnight and currently trades around 1.1730
USDJPY traded 0.25% lower in early trading touching a low of 109.247, it is currently trading around 109.28
GBPUSD made slight gains in early trading to currently trade around 1.2885
Gold is little changed overnight currently trading around $1,288
WTI gained 0.3% in early trading and currently trades around $47.25pb
At 13:30 BST Statistics Canada will release Consumer Price Index for July month-on-month, year-on-year and Core month-on-month along with Bank of Canada CPI Core (MoM) & (YoY) for July. Forecasts are calling for unchanged to a marginal increase – all keeping in line with the Bank of Canada’s monetary policy.
At 15:15 BST FOMC Member, and President of the Dallas Federal Reserve, Robert Kaplan is scheduled to participate in a moderated Q&A session at the Dallas County Community College District Conference Day 2017 in Dallas, with audience Q&A.
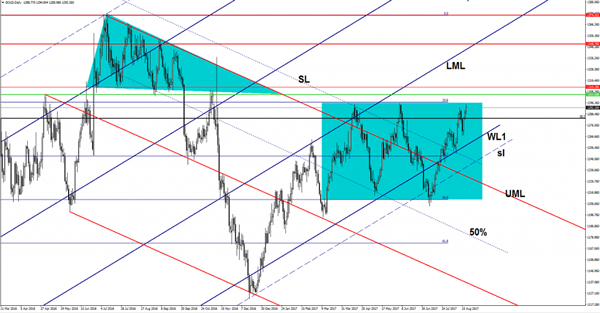
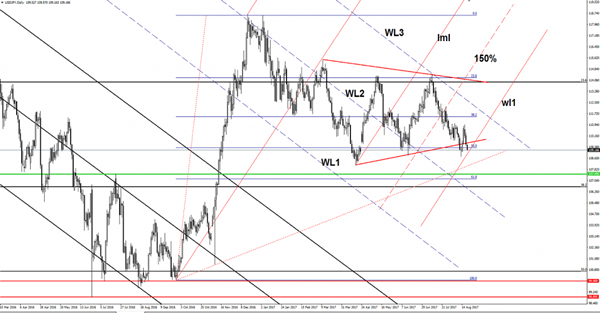
Gold Targeting New Peaks
Price rallies as the USD is going down again, you can see that is almost to hit the 23.6% retracement level and the $1295 per ounce. A breakout from the extended sideways movement is favored after the aggressive jump above the 38.2% retracement levels. Technically is expected to climb much higher after the failure to retest the warning line (WL1).
USD/JPY Breakdown In Play
Price drops like a rock and seems unstoppable on the short term. It has ignored the red uptrend line and now the 50% retracement level, a valid breakdown below these levels will bring a breakdown through the warning line (wl1) as well.
Should drop much deeper as the Nikkei’s drop is boosting the Yen, the index is very heavy on the daily chart after the false breakout above the 19700 horizontal resistance.
The major downside targets will be at the 61.8% and below at the long term 38.2% retracement level, could also be attracted by the second warning line (WL2) of the former descending pitchfork.
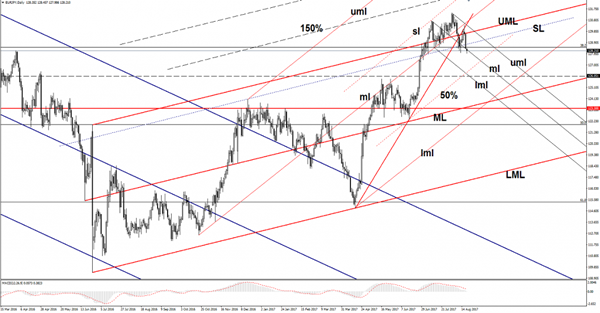
EUR/JPY On The Way Down
EUR/JPY is trading in the red and look too heavy to be stopped on the short term. Has managed to drop below the 128.04 previous low confirming a further drop in the upcoming period. The Yen appreciates versus all its rivals as the Nikkei plunged aggressively in the yesterday’s trading session.
The Nikkie failed to stabilize above the 19700 major static resistance (support turned into resistance) and now is approaching the 19309 previous low. Technically, the index was expected to drop towards the 18936 static support, such a drop will force the Yen to dominate the currency market.
Euro posted humble gains right after the German PPI was released, the indicator increased by 0.2% in July, beating the 0.0% estimate and the 0.0% growth in the former reading. The Euro-zone Current Account could bring more action, is expected to decrease from 30.1B to 27.3B in June.
Has finally dropped below the 128.00 psychological level and seems poised for more drops. It is located below the median line (ml) of the minor descending pitchfork and much below the 38.2% retracement level, the next downside target will be at the 50% Fibonacci line (ascending dotted line). The further drop will be confirmed after a retest of the broken median line (ml).
The breakdown needs confirmation to be sure that will extend the sell-off, technically is expected to drop further after the retest of the red uptrend line and the upper median line (UML) of the ascending pitchfork.
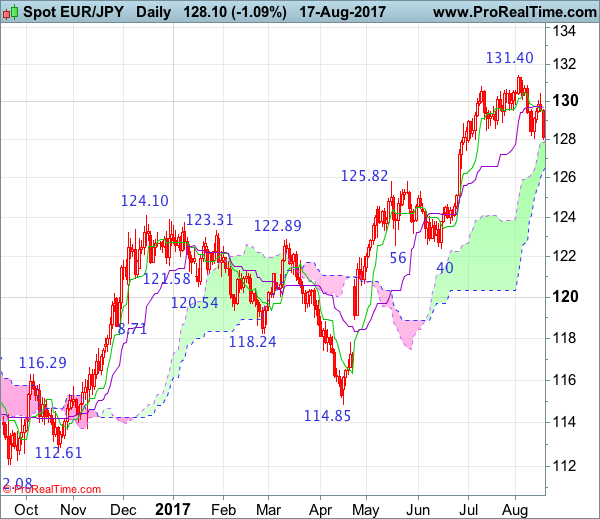
EUR/JPY Candlesticks and Ichimoku Analysis
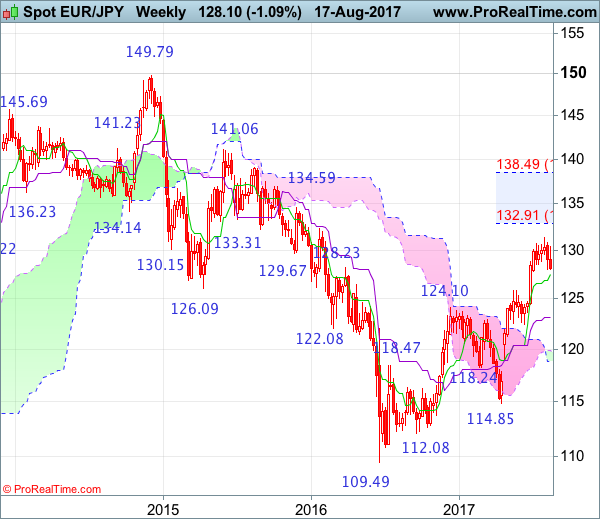
Weekly
• Last Candlesticks pattern: Window
• Time of formation: 24 April 2017
• Trend bias: Up
Daily
• Last Candlesticks pattern: Hammer
• Time of formation: 18 May 2017
• Trend bias: Up
EUR/JPY – 128.20
Although the single currency rebounded initially this week, as renewed selling interest emerged at 130.40 and price has retreated again, retaining our view that further consolidation below this month’s high at 131.40 would be seen with mild downside bias for retracement of recent upmove to 127.95-00 (38.2% Fibonacci retracement of 122.38-131.40), then 127.40-45 support, however, near term oversold condition should limit downside to 126.85-90 (50% Fibonacci retracement) and price should stay above the lower Kumo (now at 126.38), bring rebound later.
On the upside, whilst recovery to the Tenkan-Sen (now at 129.46) cannot be ruled out, reckon said resistance at 130.40 would cap upside and bring another decline later. A daily close above this resistance would defer and suggest the retreat from 131.40 top has ended instead, risk a stronger rebound but break of resistance at 130.83 is needed to shift risk back to upside for a retest of this level, having said that, only break there would revive bullishness and extend recent upmove to 132.00, then towards previous resistance at 132.33.
Recommendation: Hold short entered at 129.50 for 127.00 with stop above 130.50
On the weekly chart, euro’s retreat after early rise to 131.40 formed a black candlestick last week as suggested, retaining our view that consolidation below this level would be seen and downside bias remains for correction to 128.00, then test of the Tenkan-Sen (now at 127.53), however, a weekly close below there is needed to signal a temporary top is formed, bring retracement of recent upmove to 126.40-50 but previous resistance at 125.81 should turn into support and limit euro’s downside, reckon 124.50 would remain intact, bring rebound later.
On the upside, expect recovery to be limited to 129.50 and bring another decline. Above resistance at 130.40 (this week’s high) would bring recovery to resistance at 130.83 which is likely to hold, bring another retreat later. Above 130.83 would bring retest of 131.40 but only break there would revive bullishness and extend major upmove from 109.49 low to 131.90-00, then test of previous chart resistance at 132.33, however, overbought condition should limit upside to 133.00-10, risk from there is seen for a retreat to take place later.
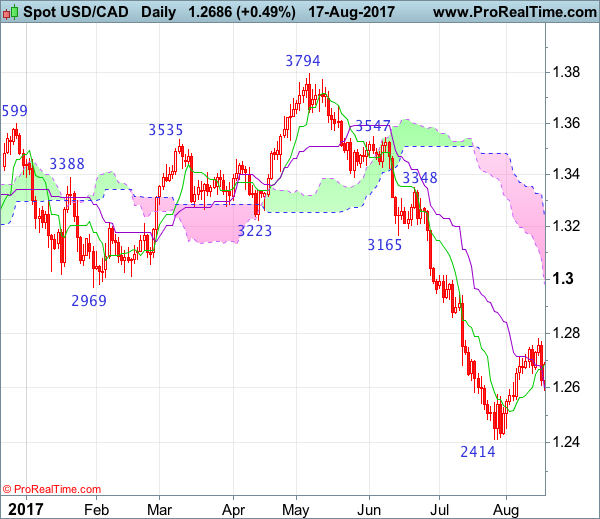
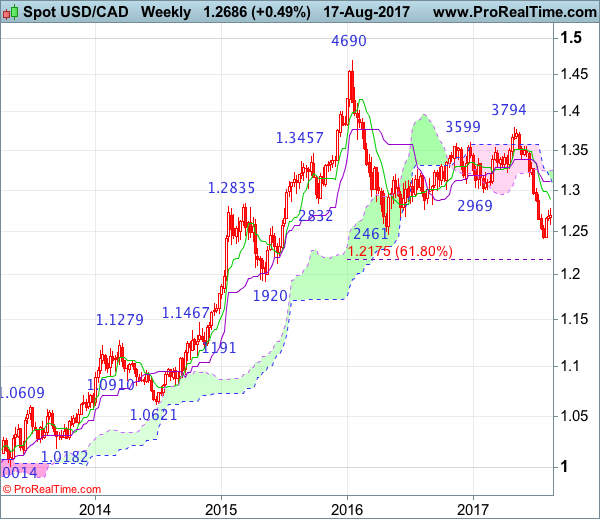
USD/CAD Candlesticks and Ichimoku Analysis
Weekly
• Last Candlesticks pattern: Shooting doji
• Time of formation: 01 May 2017
• Trend bias: Sideways
Daily
• Last Candlesticks pattern: Bearish engulfing
• Time of formation: 5 May 2017
• Trend bias: Down
USD/CAD – 1.2631
The greenback met resistance at 1.2778 earlier this week and has retreated, suggesting consolidation with mild downside bias would be seen for weakness to 1.2550, then 1.2490-00, however, break of 1.2450-55 is needed to signal recent decline has resumed for retest of 1.2414. Looking ahead, once this support is penetrated, this would confirm resumption of early downtrend to 1.2350-60 and later towards 1.2300 but price should stay well above 1.2240-50, risk from there has increased for a rebound to take place later.
On the upside, expect recovery to be limited to the Tenkan-Sen (now at 1.2683) and 1.2700-10 should hold, bring another decline later. Above said resistance at 1.2778 would defer and risk a stronger rebound to 1.2810-20 but only a daily close above previous support at 1.2859 (now resistance) would suggest a temporary low is formed instead, bring a stronger rebound to 1.2900-05, however, still reckon upside would be limited to the lower Kumo (now at 1.2979) and price should falter below resistance at 1.3015, bring another selloff later this month.
Recommendation: Sell at 1.2690 for 1.2490 with stop above 1.2790.
On the weekly chart, despite this week’s initial bounce to 1.2778, the subsequent retreat looks set to form a black candlestick with a long upper shadow this week, suggesting top is possibly formed there and consolidation below this level would be seen with downside bias for weakness to 1.2550, then 1.2500, however, break of 1.2450 is needed to signal the selloff from 1.4690 top has resumed for retest of 1.2414. Looking ahead, only break of said support at 1.2414 would provide confirmation and extend weakness to 1.2300-10 but oversold condition should prevent sharp fall below 1.2240-50 and price should stay above 1.2175 (61.8% Fibonacci retracement of 1.0621-1.4690).
On the upside, whilst initial recovery to 1.2700 cannot be ruled out, price should falter below said resistance at 1.2778 and bring another decline later. A break of said resistance would prolong consolidation above 1.2414 and risk a stronger corrective bounce to 1.2805-10 resistance, then test of previous support at 1.2859 (now resistance), above there would suggest a temporary low has been formed, bring a stronger rebound to 1.2900, then towards resistance at 1.2944 but upside should be limited to psychological level at 1.3000 and price should falter below the Kijun-Sen (now at 1.3104), bring another selloff in late Q3.
USDJPY Intraday Analysis
USDJPY (109.42): The USDJPY gave up the gains from a previous couple of days. Price action was seen falling back to the 109.58 support. A recovery off this level is required in order for any potential upside in USDJPY to be realized. Currently, prices are seen trading below the 109.58 support. The potential inverse head and shoulders pattern is still in play but could be at risk of invalidation. Thus, a daily close above 109.58 is essential to confirm the upside. A bearish close below 109.58 will suggests a retest back to the previous lows.
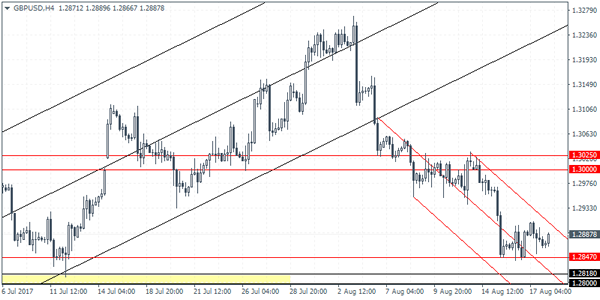
GBPUSD Intraday Analysis
GBPUSD (1.2887): The British pound managed to post a modest rebound yesterday. Slightly better than expected labor market data helped to improve the sentiment in the cable which weakened earlier in the week on account of inflation data. The rebound off 1.2835 is likely to see some upside in prices. Near-term resistance is seen at 1.2980 - 1.3000 which could be tested. If resistance is formed here, then GBPUSD could be forming the final right shoulder in the head and shoulders pattern that is evolving on the daily charts. This would suggest further downside in prices on a break below 1.2835.