Sample Category Title
GBPJPY Sees Increased Downside Momentum
GBPJPY has increased its downside momentum since early August and has dropped several big figures from the 146.80 peak to reach below 141.00.
Technical signals on the 4-hour chart remain bearish. The large drop on August 3 brought the market below the Ichimoku cloud, while the Tekan-sen and Kijun-sen lines are negatively aligned. RSI and MACD are both in bearish territory.
Only a sustained move above immediate resistance at 141.00 would shift the focus back to the upside towards 142.00. This was a prior support level and now a strong resistance level which was tested several times and would be a challenge to break. A successful move higher from here would weaken downside pressure and bring into view the level at 143.00.
Only a rise above the cloud at 144.00 would shift the bias to a more bullish one to test the 146.80 peak.
For now, the overall bearish picture gives scope for more downside to target the 140.00 handle ahead of the June 12 low of 138.66.
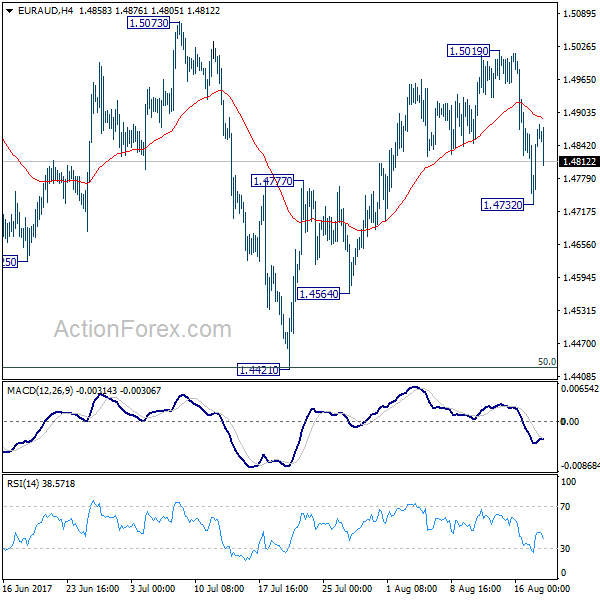
EUR/AUD Daily Outlook
Daily Pivots: (S1) 1.4776; (P) 1.4823; (R1) 1.4914; More...
EUR/AUD recovered after forming a temporary low at 1.4732 and intraday bias is turned neutral first. Overall outlook is unchanged that corrective pattern from 1.5226 is still in progress. Below 1.4732 will target a test on 50% retracement of 1.3624 to 1.5226 at 1.4427 again. On the upside, above 1.5019 will target a test on 1.5226 high instead.
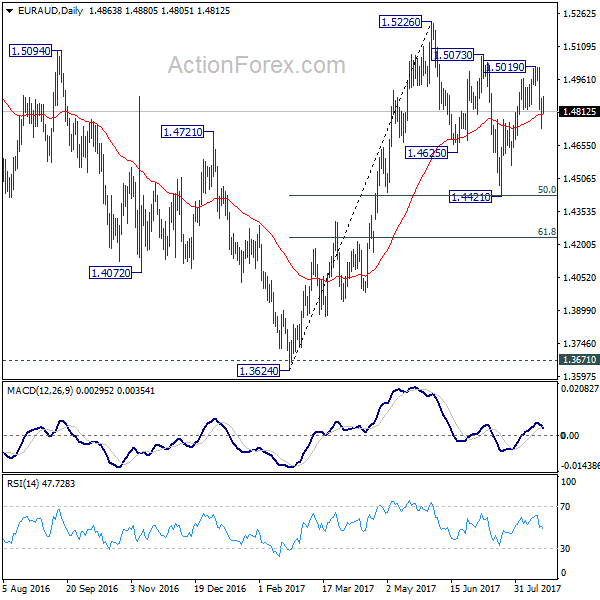
In the bigger picture, we're holding on to the view that corrective decline from 1.6587 medium term has completed at 1.3624. Rise from 1.3624 is expected to extend to retest 1.6587. The corrective structure of the fall from 1.5226 is affirming this view. Above 1.5226 will target a test on 1.6587 key resistance. However, another decline will dampen our view and would drag EUR/AUD lower to retest key support zone around 1.3624.
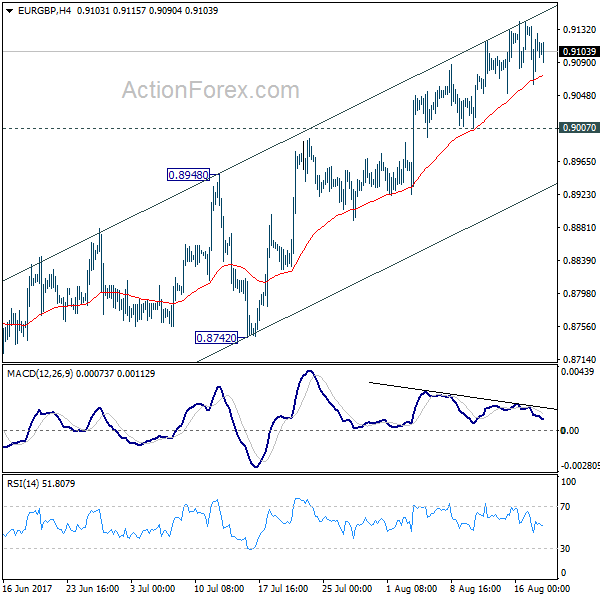
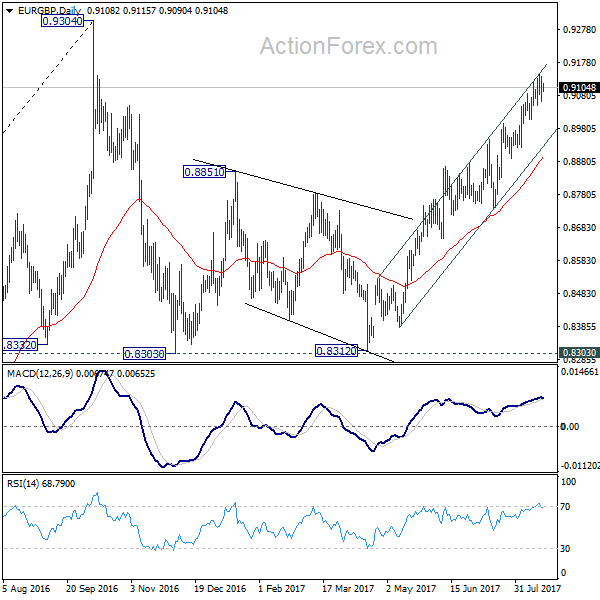
EUR/GBP Daily Outlook
Daily Pivots: (S1) 0.9069; (P) 0.9102; (R1) 0.9143; More
No change in EUR/GBP's outlook. With 0.9007 support intact, further rise is expected to target a test on 0.9304 high. At this point, there is no clear sign of up trend resumption yet. Hence, we'll be cautious on strong resistance from 0.9304 to limit upside and bring another fall. On the downside, considering bearish divergence condition in 4 hour MACD, break of 0.9007 support will indicate short term topping. Intraday bias will then be turned back to the downside for 0.8742/8948 support zone.
In the bigger picture, price actions from 0.9304 are viewed as a medium term corrective pattern. It's uncertain whether it is finished yet. But in case of another fall, we'd expect strong support from 0.8116 cluster support (50% retracement of 0.6935 to 0.9304 at 0.8120) to contain downside and bring rebound. Whole up trend from 0.6935 is expected to resume after consolidation from 0.9304 completes.
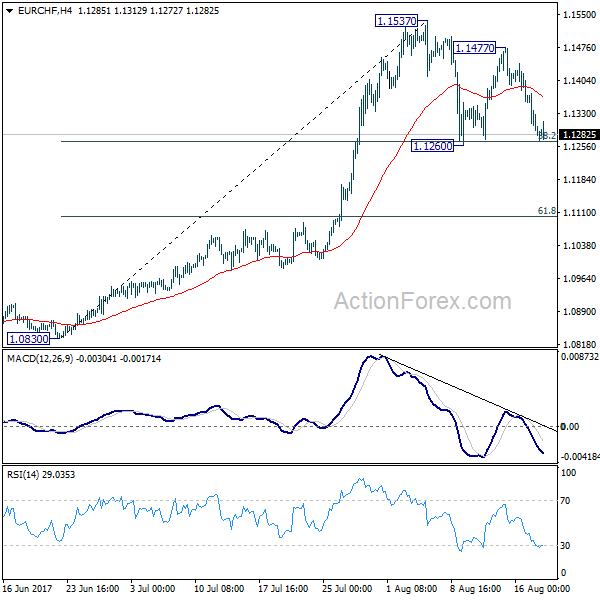
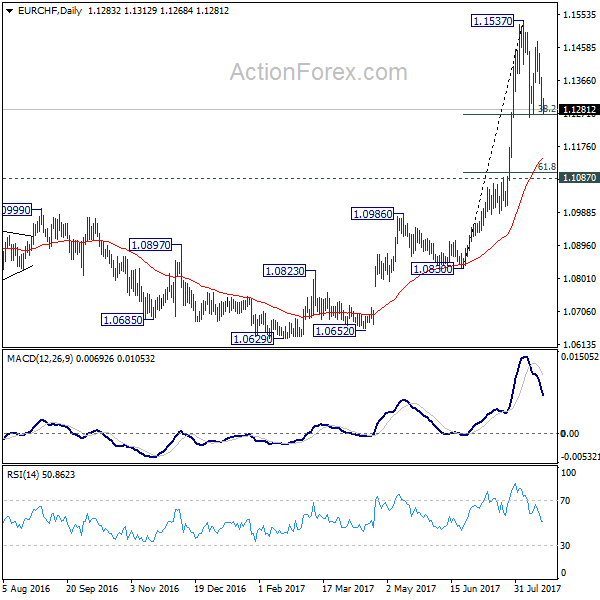
EUR/CHF Daily Outlook
Daily Pivots: (S1) 1.1254; (P) 1.1315; (R1) 1.1348; More...
At this point, EUR/CHF is staying in range of 1.1260/1537 and intraday bias remains neutral. We're expecting strong support from 38.2% retracement of 1.0830 to 1.1537 at 1.1267 to bring rebound. Break of 1.1537 resistance will resume up trend from 1.0629. However, firm break of 1.1267 will extend the correction from 1.1537 and target 61.8% retracement at 1.1100, before completion.
In the bigger picture, firm break of 1.1198 key resistance confirms resumption of the long term rise from SNB spike low back in 2015. In this case, EUR/CHF would eventually head back to prior SNB imposed floor at 1.2000. For now, this will be the favored case as long as 1.1087 resistance turned support holds.
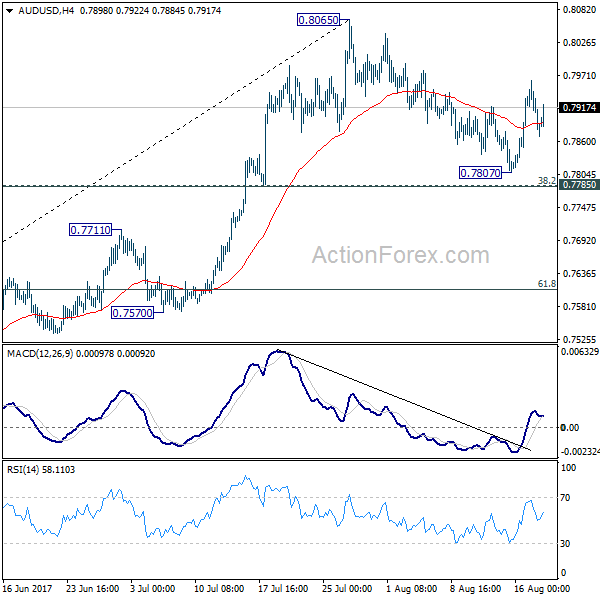
AUD/USD Daily Outlook
Daily Pivots: (S1) 0.7855; (P) 0.7908; (R1) 0.7937; More...
As noted before, the corrective pull back from 0.8065 should have completed at 0.7807, ahead of 0.7785 cluster support (38.2% retracement of 0.7328 to 0.8065 at 0.7783) as expected. Intraday bias remains mildly on the upside for retesting 0.8065 first. Firm break there will resume the medium term rise and target 100% projection of 0.6826 to 0.7833 from 0.7328 at 0.8335.
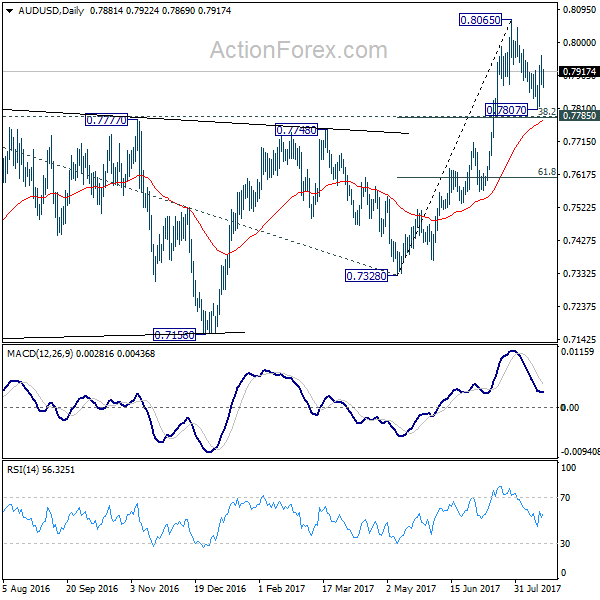
In the bigger picture, rise from 0.6826 medium term bottom is still in progress. At this point, there is no confirmation of trend reversal yet and we'll continue to treat such rebound as a corrective pattern. But in any case, break of 55 month EMA (now at 0.8100) will target 38.2% retracement of 1.1079 to 0.6826 at 0.8451. Break of 0.7328 support is needed to confirm completion of the rebound. Otherwise, further rise is now expected.
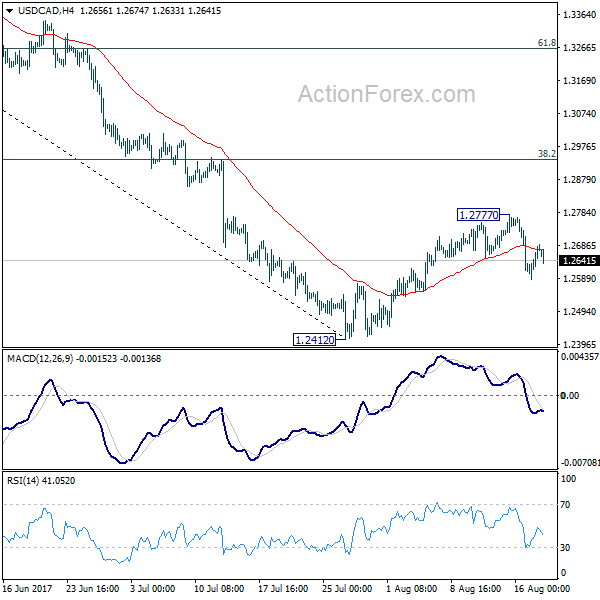
USD/CAD Daily Outlook
Daily Pivots: (S1) 1.2618; (P) 1.2650; (R1) 1.2714; More....
As noted before, the corrective recovery from 1.2412 should have completed at 1.2777 already. Further decline is expected to retest 1.2412 low. Break there will resume the larger decline and target next long term fibonacci level at 1.2048. On the upside, above 1.2777 will extend the recovery. But we'd expect upside to be limited by 38.2% retracement of 1.3793 to 1.2412 at 1.2940 to bring fall resumption.
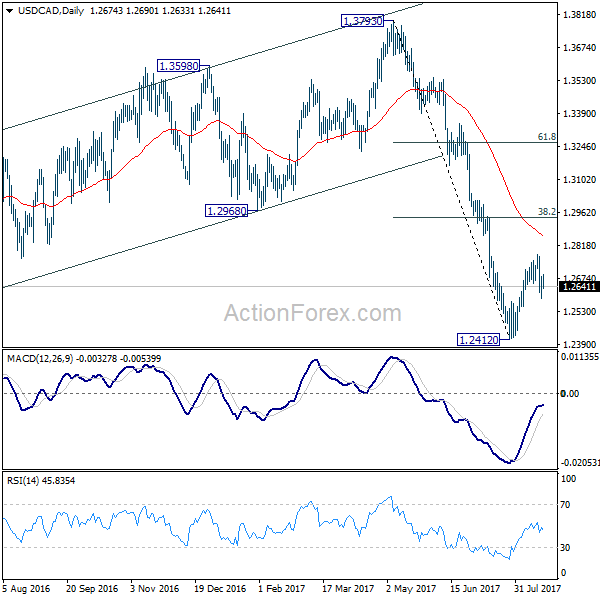
In the bigger picture, price actions from 1.4689 medium term top are seen as a correction pattern. Such corrective fall is still expected to extend to 50% retracement of 0.9406 to 1.4869 at 1.2048. At this point, we'd look for strong support from there to contain downside and bring rebound. Nonetheless, on the upside, sustained break of 1.2968, 38.2% retracement of 1.3793 to 1.2412 at 1.2940 will be the first sign of completion of the correction and will turn focus back to 1.3793 key resistance.
Yen Higher As Investors Sell Risk Assets
The USDJPY pair has come under selling pressure during the Asian session, falling to 109.30, as investors sell the U.S dollar, amidst growing doubts about U.S. President Donald Trump's ability to implement his economic agenda.
Investor confidence has also been shaken, after a terror attack involving a van, drove through crowds of tourists in Barcelona on Thursday, killing at least thirteen people and injuring more than one hundred people.
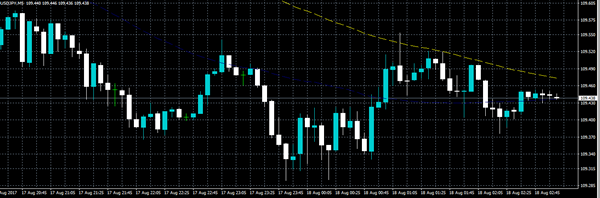
The USDJPY pair remains strongly bearish on all-time frames, with the pair continuing to be sold on any upside rallies above the 110 level.
Key technical support is found at the current weekly price low, at 109.20, with the July 14th intraday low adding further support, at 108.80. Once price closes below the 108.80 level, the April 17th low comes into focus, at 108.11, forming critical long-term support.
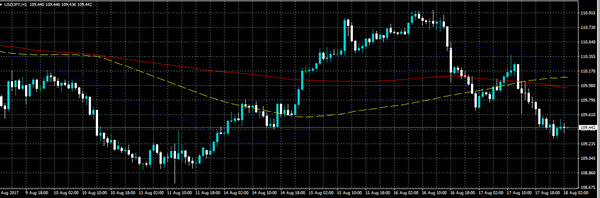
To the upside, the USDJPY weekly pivot point is found at 109.62, with the daily pivot point, above at 109.75. The 100 and 200-hour moving averages converge around the 110.10 level.
GBPUSD Holding 100-Day Moving Average
The GBPUSD pair continues to hold steady above the 100-day moving average, around the 1.2860 level, as British pound sellers struggle to close price on a daily basis underneath this key technical region.
The U.S dollar index has come under selling pressure overnight, provoking a minor bounce in the GBPUSD towards the 1.2890 level. Later today, traders will look to the release of the U.S Michigan confidence survey, as the last market moving data point of the trading week.
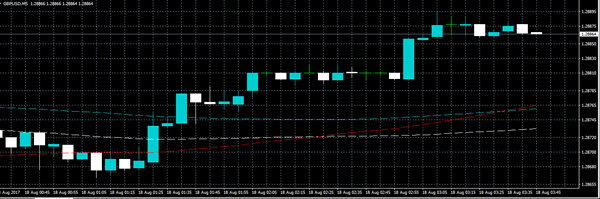
The GBPUSD pair remains strongly bearish in the medium term, only a move above the 1.3000 level can negate the pairs bearish outlook.
Key technical support is found at the daily pivot point, at 1.2878, the 100-day moving average at 1.2860. Key longer term technical support is found at 1.2811 and 1.2672.
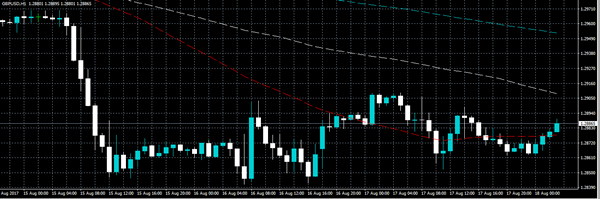
To the upside, key technical resistance is found at 1.2911, the 50-day moving average, at 1.2932, and the former daily consolidation area, 1.2951.
Markets Brace For Volatility After Wall Street Selloff
US stocks just posted their biggest one-day loss in three months, as political jitters and mixed earnings drove heavy selling on Wall Street. The reverberations of the selloff are already being felt in the futures market, with European equities already in the red.
The Dow Jones Industrial Average plunged 274 points on Thursday with all 30 of its components finishing lower. That's the first such occurrence since September.
Surprisingly, haven assets such as precious metals only saw limited upside and were little changed ahead of European trade.
The US dollar index (DXY) has also weakened in recent sessions, but is on track for a weekly gain of around 0.6%. The euro remains under pressure while the British pound searches for direction.
A steady stream of economic data will make headlines on Friday. Action begins at 06:00 GMT with German producer inflation figures. The producer price index (PPI) is expected to come in flat for July, translating into a year-over-year gain of 2.2%.
Two hours later, the European Commission's statistical agency will release the current account deficit for the month of June. At 09:00 GMT, Eurozone construction data will also make headlines.
In North America, Statistics Canada will release the latest inflation numbers for the world's eleventh-largest economy. The Canadian consumer price index (CPI) is forecast to rise 1.2% annually in July, compared with 1% the previous month. However, CPI is expected to go unchanged month-over-month.
In US data, the University of Michigan will release the closely-watched consumer sentiment index at 14:00 GMT. Sentiment data are used by investors to gauge consumer spending, which accounts for more than two-thirds of US economic output.
Energy traders will also be monitoring the weekly rig-count report from Baker Hughes Inc., which is due at 17:00 GMT.
In monetary policy, Federal Open Market Committee (FOMC) member Robert Kaplan will deliver a speech that will be closely monitored by the financial markets.
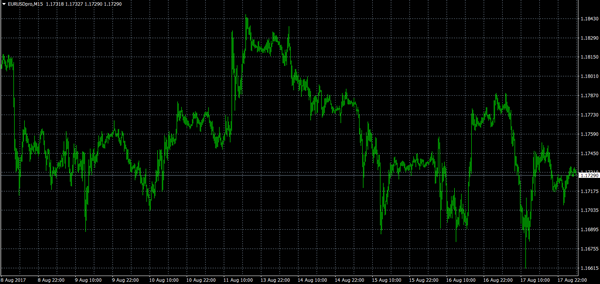
EUR/USD
The euro ran into volatility on Thursday after the European Central Bank (ECB) released the minutes of last month's policy meeting. The EUR/USD was last seen trading around 1.1730, where it faces immediate support at 1.1687.
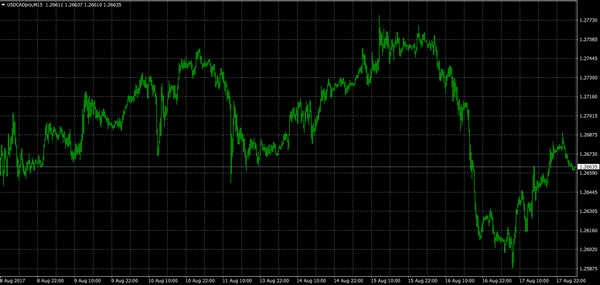
USD/CAD
The USD/CAD suffered a sharp reversal on Thursday following weeks of steady progress. After peaking at 1.2764 in mid-week trade, the pair briefly fell below 1.2600 on Thursday. The short-term outlook will depend on Canadian data and the sustainability of the greenback's latest recovery attempt.
DOW
The Dow Jones index fell 1.2% on Thursday and is currently trading at more than three-week lows. The sharp reversal is a clear sign that investors are becoming nervous about political developments surrounding President Trump. At the same time, however, the technical and fundamental pictures suggest the Dow is still primed to push higher.
USDCAD Shifts To More Bearish Stance Following Recent Bounce
USDCAD maintains a bearish market structure on the daily chart. Following a drop from a multi-month high of 1.3793, the pair attempted to bounce from a more than one-year low of 1.2413. The rally faded after retracing about 23.6% of this May 5 to July 26 downtrend.
The last two days of declines resulted in a break of the recent consolidation range that took place around this 23.6% Fibonacci level at 1.2736, which appears to have held in terms of resistance.
The near-term bias is showing signs of shifting from neutral to bearish (from August 7). The market is more susceptible to downside risk and would continue to remain so unless prices can reclaim and stay above 1.3100. This would bring USDCAD back to the 50% Fibonacci level of the recent downtrend. A rise above this would increase the odds of a sustained move to the 61.8% Fibonacci at 1.3263 and from here the focus would be on the 1.3793 peak. Clearing this point would see the market in a bullish phase.
Daily signals are bearish and are pointing to the probability of further downside with limited support at 1.2576 ahead of the low at 1.2413. From here the next major low of 1.1919 comes into view.
Overall, the daily technical picture is bearish as there was a bearish crossover of the 50-day with the 200-day moving average on July 12. The near-term bias is neutral to bearish.