
Sample Category Title
EUR/USD Daily Outlook
Daily Pivots: (S1) 1.1659; (P) 1.1725 (R1) 1.1788; More...
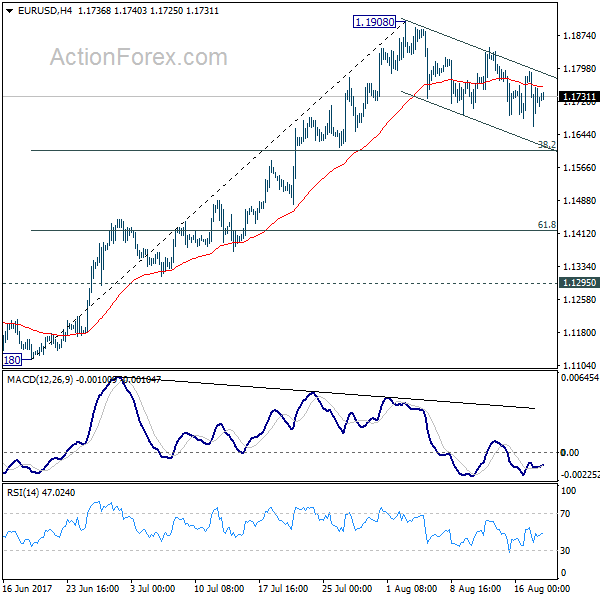
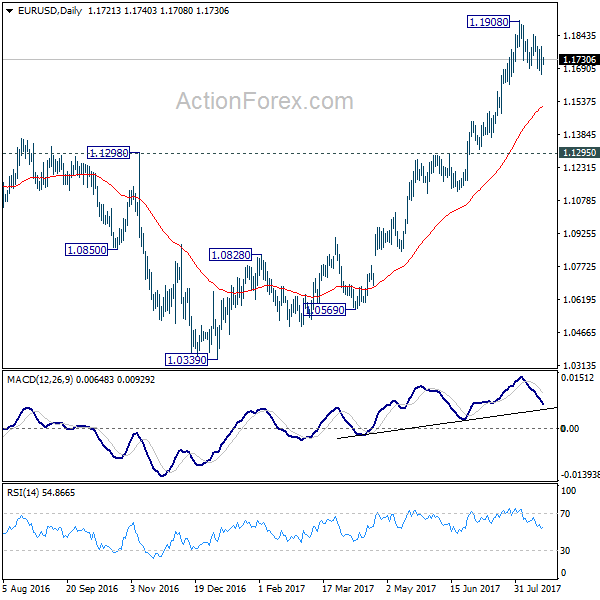
EUR/USD's corrective fall from 1.1908 is still in progress and outlook is unchanged. While deeper pull back could be seen, downside should be contained by 38.2% retracement of 1.1119 to 1.1908 at 1.1606 to bring rebound. On the upside, break of 1.1908 will extend recent up trend to 1.2042 long term support turned resistance next.
In the bigger picture, an important bottom was formed at 1.0339 on bullish convergence condition in weekly MACD. Sustained trading above 55 month EMA (now at 1.1768) will pave the way to key fibonacci level at 38.2% retracement of 1.6039 (2008 high) to 1.0339 (2017 low) at 1.2516. While rise from 1.0339 is strong, there is no confirmation that it's developing into a long term up trend yet. Hence, we'll be cautious on strong resistance from 1.2516 to limit upside. But for now, medium term outlook will remain bullish as long as 1.1295 support holds, in case of pull back.
Daily Technical Outlook And Review: EUR/USD, GBP/USD, AUD/USD, USD/JPY, USD/CAD, USD/CHF, DOW 30, GOLD
A note on lower timeframe confirming price action...
Waiting for lower timeframe confirmation is our main tool to confirm strength within higher timeframe zones, and has really been the key to our trading success. It takes a little time to understand the subtle nuances, however, as each trade is never the same, but once you master the rhythm so to speak, you will be saved from countless unnecessary losing trades. The following is a list of what we look for:
- A break/retest of supply or demand dependent on which way you're trading.
- A trendline break/retest.
- Buying/selling tails ... essentially we look for a cluster of very obvious spikes off of lower timeframe support and resistance levels within the higher timeframe zone.
- Candlestick patterns. We tend to only stick with pin bars and engulfing bars as these have proven to be the most effective.
We typically search for lower-timeframe confirmation between the M15 and H1 timeframes, since most of our higher-timeframe areas begin with the H4. Stops are usually placed 1-3 pips beyond confirming structures.
EUR/USD
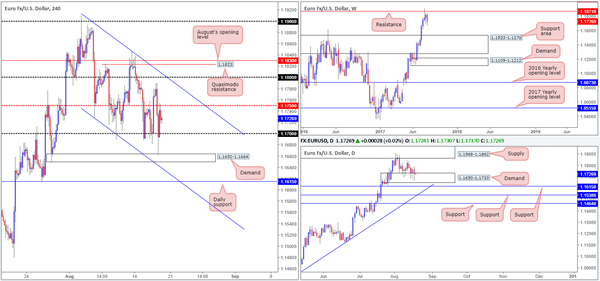
Leaving the 1.18 psychological band unchallenged, the single currency chomped its way through the H4 mid-level support at 1.1750 during yesterday’s London morning segment. This, as you can see, allowed the unit to aggressively whipsaw through the 1.17 handle, challenge a H4 demand at 1.1650-1.1664 and end the day retesting 1.1750 as resistance.
Building a case for entry in this market has been (and still is) proving difficult. On the daily timeframe, the pair remains bolstered by demand coming in at 1.1650-1.1733. A little higher up on the curve, however, the weekly timeframe shows price trading from a resistance at 1.1871.
Suggestions: Unless we’re missing something obvious here, this market remains technically challenging. A long would place you in direct conflict with potential weekly sellers, and a short against possible daily buyers! Considering this, our desk will remain on the sidelines today and look to reassess structure going into Monday’s open.
Data points to consider: US Prelim UoM consumer sentiment at 9pm, followed closely by FOMC member Kaplan speaking at 3.15pm GMT+1.
Levels to watch/live orders:
- Buys: Flat (stop loss: N/A).
- Sells: Flat (stop loss: N/A).
GBP/USD:
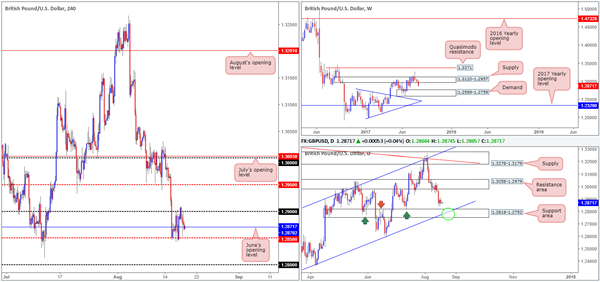
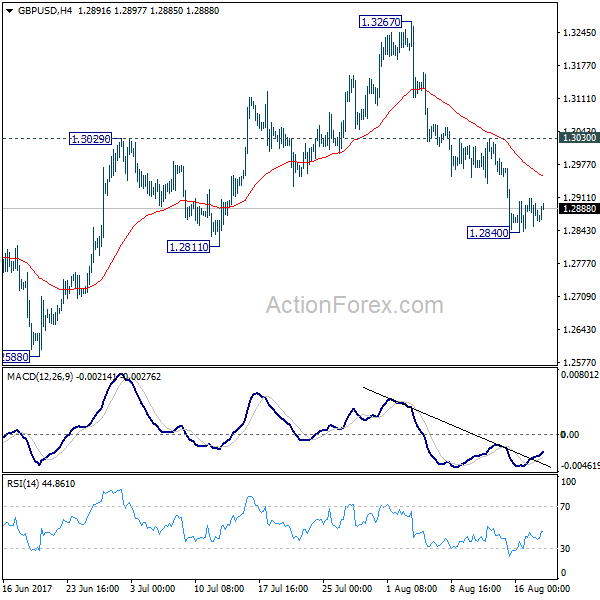
Since Tuesday, the H4 candles have been consolidating between the 1.29 handle and the mid-level support at 1.2850. While we cannot rule out the possibility of fresh upside attempts within the current H4 range, the odds of price breaching 1.2850 is high, in our humble view.
Our reasoning lies within the higher-timeframe structure. The daily support area at 1.3058-1.2979 recently gave way leaving downside free to challenge the daily support area pegged at 1.2818-1.2752 (converges with a daily channel support extended from the low 1.2365). Further supporting the bears, the weekly timeframe shows space for the market to trade as far down as the demand area coming in at 1.2589-1.2759.
Suggestions: Selling sub 1.2850, however, is problematic. Located only 30 pips below this number is the top edge of the aforementioned daily support area, shadowed closely by the 1.28 handle drawn on the H4 chart. As a result,
we are looking for the market to challenge the current daily support area and its fusing channel support (green circle). It will be from this point that we’ll begin hunting for long opportunities on the H4 timeframe and lower.
Data points to consider: US Prelim UoM consumer sentiment at 9pm, followed closely by FOMC member Kaplan speaking at 3.15pm GMT+1.
Levels to watch/live orders:
- Buys: 1.2818-1.2752 is an interesting base for long opportunities.
- Sells: Flat (stop loss: N/A).
AUD/USD
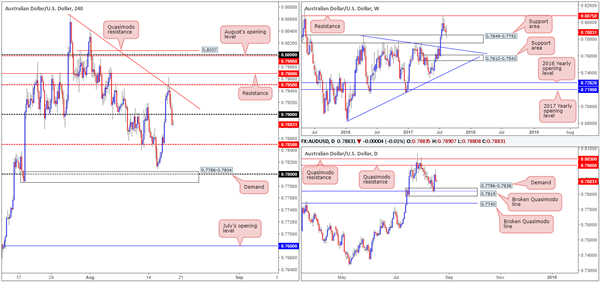
Failing to sustain gains beyond the converging H4 mid-level resistance at 0.7950 and trendline resistance (taken from the high 0.8065) saw the commodity currency change course on Thursday and head into negative territory. In recent hours the 0.79 handle was consumed, leaving the pair free to challenge the H4 mid-level support at 0.7850.
Turning our attention over to the bigger picture, we can see the weekly support area at 0.7849-0.7752 remains in play. While this may be the case, it might be worth noting that the current weekly candle exhibits indecisiveness at the moment. Down on the daily timeframe, the bounce seen from demand at 0.7786-0.7838, which encases a broken Quasimodo level at 0.7819, failed to reach the daily Quasimodo resistance at 0.7988 before turning red. By and of itself, this could imply that we may see the unit retest the demand today/ early next week.
Suggestions: While the daily picture shows room for the piece to trade lower, a short at 0.79 is not something we’d be comfortable with. Given that this market is entrenched within a strong uptrend, and weekly price holding at demand, albeit without conviction, we feel remaining on the sidelines may be the better bet here.
Data points to consider: US Prelim UoM consumer sentiment at 9pm, followed closely by FOMC member Kaplan speaking at 3.15pm GMT+1.
Levels to watch/live orders:
- Buys: Flat (stop loss: N/A).
- Sells: Flat (stop loss: N/A).
USD/JPY
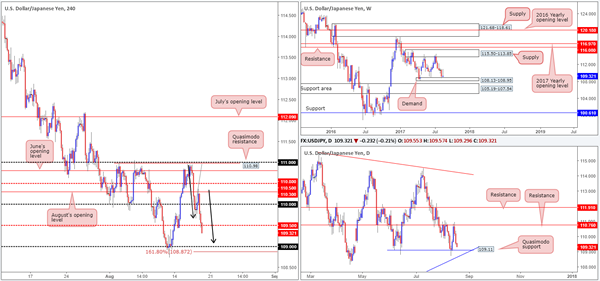
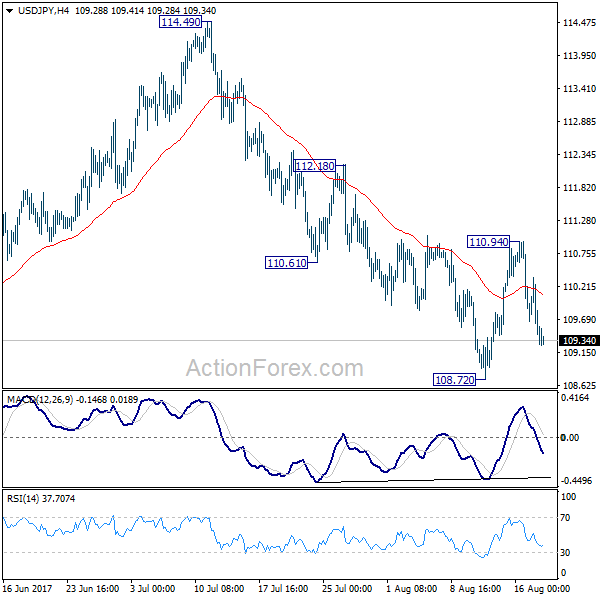
Weekly bulls, as you can see, are struggling to gather momentum from demand at 108.13-108.95. A violation of this zone will lead to price almost immediately challenging a support area seen at 105.19-107.54. A closer look at price action on the daily timeframe, however, shows that the unit is currently hovering ahead of a Quasimodo support at 109.11. This level held the market higher on Friday last week, so there’s a chance we may see history repeat itself here.
Moving across to the H4 timeframe, price recently crossed below the mid-level support at 109.50. Should the bears remain dominant here, the next level on the hit list is the 109 handle. Also of particular interest on this scale is the AB=CD approach (black arrows), completing just beneath 109 at 108.87 (161.8% Fib ext. point).
Suggestions: A long from the 109 handle could be an option today, given the H4 approach (AB=CD), daily Quasimodo support and weekly demand. To be on the safe side though, we would highly recommend waiting for a H4 bull candle to form in the shape of a full, or near full-bodied candle. Although this will not guarantee a winning trade, it will show buyer intent!
Data points to consider: US Prelim UoM consumer sentiment at 9pm, followed closely by FOMC member Kaplan speaking at 3.15pm GMT+1.
Levels to watch/live orders:
- Buys: 1.09 region ([waiting for a reasonably sized H4 bullish candle to form– in the shape of either a full, or near-full-bodied candle – is advised] stop loss: ideally beyond the candle’s tail).
- Sells: Flat (stop loss: N/A).
USD/CAD
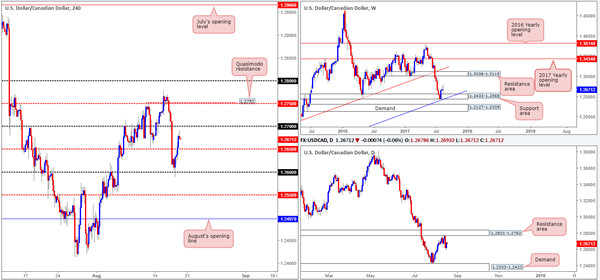
Early on in yesterday’s London segment, H4 price challenged the 1.26 handle and gravitated north. The mid-level resistance at 1.2650 was engulfed going into the US session, opening up the backdoor to 1.27. As you can see though, price has so far been unable to challenge this psychological band.
The bullish momentum seen from the weekly support area at 1.2433-1.2569 has, over the past couple of weeks, diminished. This likely has something to do with the daily resistance area at 1.2831-1.2763 that elbowed its way into view this week.
Suggestions: With selling pressure being seen from daily structure, and weekly price holding above a support area, direction is somewhat restricted at the moment.
We do, however, like the H4 Quasimodo resistance level at 1.2752, which aligns nicely with the H4 mid-level resistance at 1.2750 and the lower edge of the said daily resistance area. Nevertheless, shorting here would place you against potential weekly buying!
Data points to consider: Canadian inflation figures at 1.30pm GMT+1.
Levels to watch/live orders:
- Buys: Flat (stop loss: N/A).
- Sells: 1.2750 region ([waiting for a reasonably sized bearish candle to form– in the shape of either a full, or near-full-bodied candle – is advised] stop loss: ideally beyond the candle’s wick).
USD/CHF
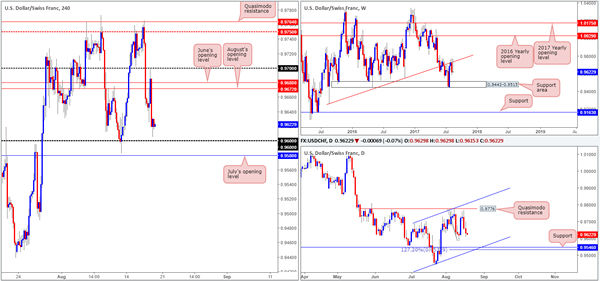
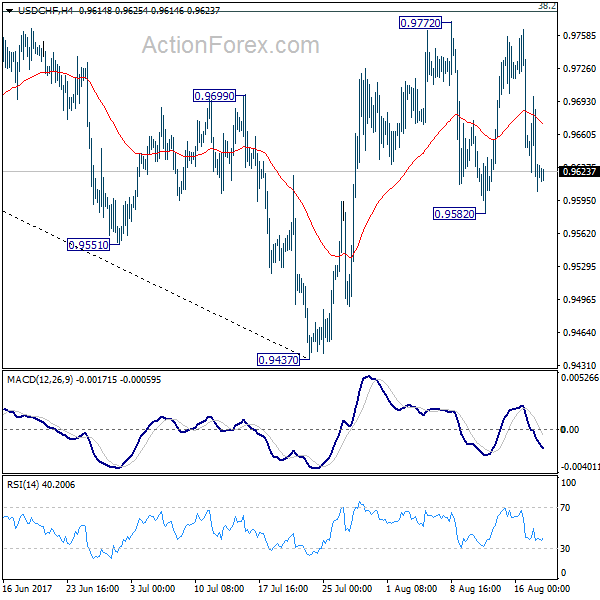
After aggressively whipsawing through June and August’s opening levels at 0.9680/0.9672 and coming within a few pips of the 0.97 handle, the pair went on to erase daily gains during the US segment. With H4 price seen hovering just ahead of the 0.96 handle right now, what’s likely in store for this market today?
According to weekly structure, further selling could be upon us. The trendline resistance extended from the low 0.9257 remains in view, and therefore could send the unit down as far as the support area penciled in at 0.9443-0.9515. Also of particular interest is the daily timeframe. The chart shows room for the pair to trade as far down as support coming in at 0.9546, which happens to unite with a channel support etched from the low 0.9438 and a AB=CD 127.2 Fib ext. at 0.9532.
Suggestions: Despite both weekly and daily structure indicating further selling could be on the cards, the 0.96 handle and July’s opening level at 0.9580 are not levels we’d feel comfortable selling into. Usually, in cases such as this, we would simply wait for these levels to be consumed and then look to trade the retest. However, given the distance between 0.9580 and 0.9546 (the daily support) is only 34 pips, we’re unfortunately left with little room to maneuver for a short.
Data points to consider: US Prelim UoM consumer sentiment at 9pm, followed closely by FOMC member Kaplan speaking at 3.15pm GMT+1.
Levels to watch/live orders:
- Buys: Flat (stop loss: N/A).
- Sells: Flat (stop loss: N/A).
DOW 30
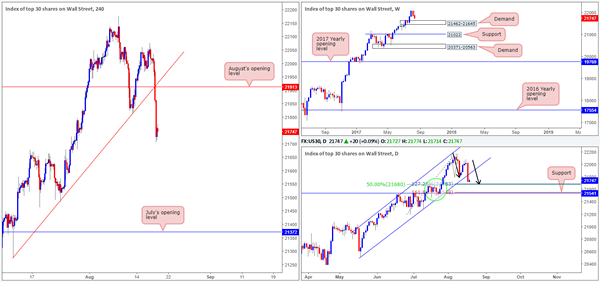
The US equity market came under considerable pressure on Thursday. The H4 trendline support etched from the low 21273, alongside August’s opening level at 21913, was engulfed as a result of this. Traders may have also noticed that daily action closed below a channel support line extended from the low 20494. With that being said, however, the daily candles are now seen loitering just ahead of an AB=CD (black arrows) 127.2% Fib ext. point at 21683, and a converging 50% support line at 21680 drawn from the low 21192.
If you’re in the process of considering whether or not it’s worth taking a long from the daily AB=CD 127.2% completion point, you may want to look at the weekly timeframe. A fresh demand is seen lurking just below current price at 21462-21645. Of particular interest is the top edge of this area being positioned just above the daily support level at 21541 (converges with daily AB=CD 161.8% Fib ext. point) and a few points below the AB=CD completion 127.2% point!
Our suggestions: Personally, a long from the daily support mentioned above at 21541 seems the most logical, in our opinion. The level, as mentioned above, fuses with a daily AB=CD 161.8% ext. point and is positioned within the noted weekly demand. Further adding to this, the trend in this market is incredibly strong, and by trading long from 21541, we can place stops below the consolidation of candles seen marked with a green circle on the daily chart at 21459.
Data points to consider: US Prelim UoM consumer sentiment at 9pm, followed closely by FOMC member Kaplan speaking at 3.15pm GMT+1.
Levels to watch/live orders:
- Buys: 21541 region (stop loss: 21459).
- Sells: Flat (stop loss: N/A).
GOLD
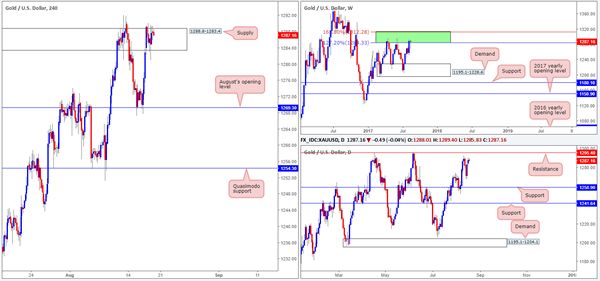
It was a relatively sober day in the gold market yesterday, with price continuing to loiter within H4 supply coming in at 1288.8-1283.4. As a result of this, much of the following report will echo thoughts put forward in Thursday’s analysis.
From the weekly timeframe, we can see that the bears are struggling to hold ground. Of course, it’s far too early to judge just yet since the green weekly resistance area (comprised of two weekly Fibonacci extensions 161.8/127.2% at 1312.2/1284.3 taken from the low 1188.1) has managed to successfully hold the metal lower on two separate occasions in the past.
The story on the daily chart, nevertheless, shows price trading nearby a resistance level at 1295.4. Apart from the two instances on 17/04/2017 and 06/06/2017, there’s little history registered with this number! For that reason, we may see price break above this line and head to the resistance carved from 1308.4, which boasts very attractive history dating back to early 2011.
The way we see things right now is the above noted H4 supply is the last barrier stopping daily price from connecting with resistance mentioned above at 1295.4.
Our suggestions: Based on the above, our desk will not be looking for (long-term) shorts until the daily resistance line plotted at 1308.4 is in play. This is due to the history surrounding this number and its position within the current weekly resistance area (allowing us to place stops tightly above this zone). Regarding intraday opportunities, we still see very little to hang our hat on at the moment.
Levels to watch/live orders:
- Buys: Flat (stop loss: N/A).
- Sells: 1308.4 region. This is, given the location of this daily resistance on the weekly timeframe, a fantastic level to be looking for a short from.
GBP/USD Daily Outlook
Daily Pivots: (S1) 1.2843; (P) 1.2876; (R1) 1.2899; More...
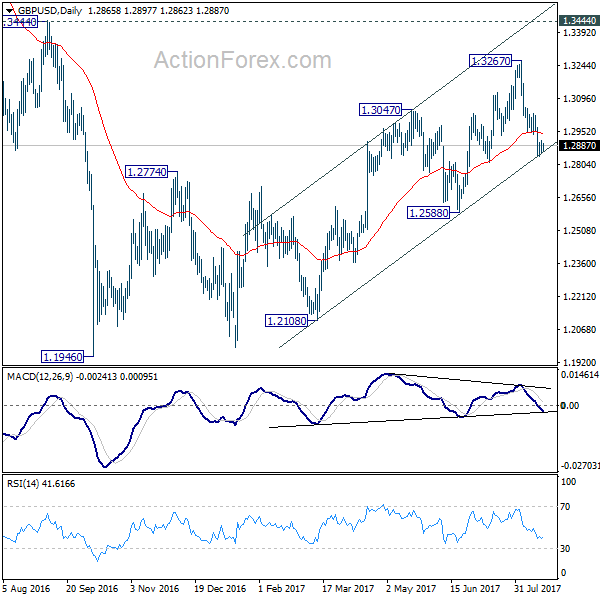
The consolidation from 1.2840 temporary low is still in progress and intraday bias remains neutral first. Outlook will stay bearish as long as 1.3030 resistance holds. We're preferring the case that correction from 1.1946 is completed at 1.3267. Below 1.2840 will target 1.2588 key support to confirm our bearish view. Nonetheless, break of 1.3030 will dampen our view and turn bias back to the upside for retesting 1.3267.
In the bigger picture, overall, price actions from 1.1946 medium term low are seen as a corrective pattern. While further rise cannot be ruled out, larger outlook remains bearish as long as 1.3444 key resistance holds. Down trend from 1.7190 (2014 high) is expected to resume later after the correction completes. And break of 1.2588 will indicate that such down trend is resuming.
USD/CHF Daily Outlook
Daily Pivots: (S1) 0.9590; (P) 0.9644; (R1) 0.9683; More...
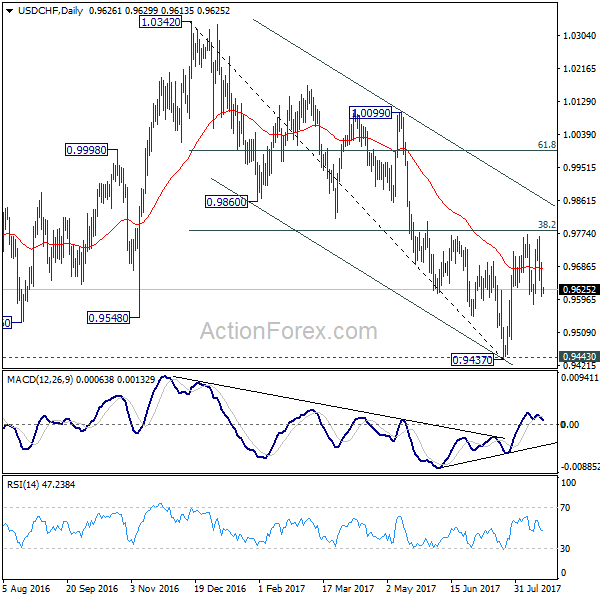
USD/CHF is staying in range of 0.9582/9772 and intraday bias remains neutral at this point. On the upside, decisive break of 0.9772 resistance will revive the bullish case of reversal. That is, whole decline from 1.0342 has completed at 0.9437 after defending 0.9443 support. USD/CHF should then target channel resistance (now at 0.9862) next. Meanwhile, the pair is bounded inside medium term falling channel and limited below 38.2% retracement of 1.0342 to 0.9437 at 0.9783 for the moment. Break of 0.9582 will turn bias back to the downside for 0.9437. This could also extend the fall from 1.0342 through 0.9437/43 key support level.
In the bigger picture, current development argues that USD/CHF has successfully defended 0.9443 key support level. And long term range trading in 0.9443/1.0342 is extending with another rise. At this point, there is no sign of an up trend yet. Hence, while further rise is expected in USD/CHF, we'll start to be cautious on loss of momentum above 61.8% retracement of 1.0342 to 0.9437 at 0.9996. However, firm break of 0.9443 will carry larger bearish implication and would target next key support at 0.9072.
USD/JPY Daily Outlook
Daily Pivots: (S1) 109.21; (P) 109.79; (R1) 110.13; More...
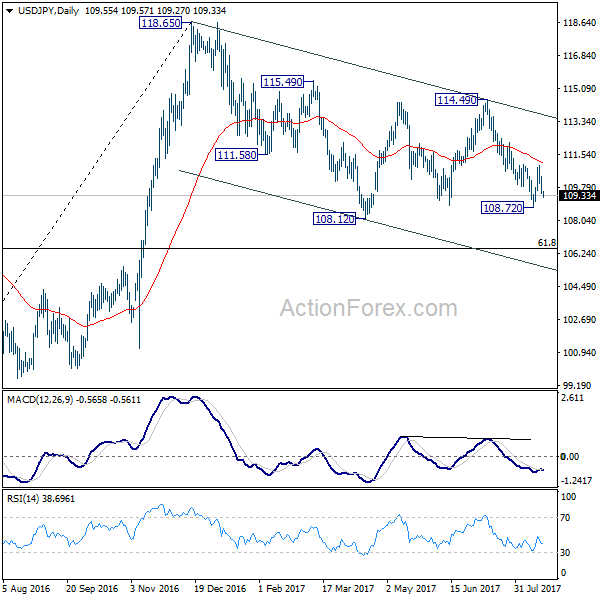
Intraday bias in USD/JPY is turned back to the downside as fall from 110.94 resumed. Overall, price actions from 118.65 are seen as a correction pattern. There is clear indication that it's completed yet. Break of 108.72 will likely resume the whole decline from 118.65 through 108.12 to next medium term fibonacci level at 106.48. On the upside, above 110.94 will extend the rebound to 112.18 resistance next. Break there will turn focus back to 114.49 key near term resistance.
In the bigger picture, the corrective structure of the fall from 118.65 suggests that rise from 98.97 is not completed yet. Break of 118.65 will target a test on 125.85 high. At this point, it's uncertain whether rise from 98.97 is resuming the long term up trend from 75.56, or it's a leg in the consolidation from 125.85. Hence, we'll be cautious on topping as it approaches 125.85. If fall from 118.65 extends lower, downside should be contained by 61.8% retracement of 98.97 to 118.65 at 106.48 and bring rebound.
EUR/JPY Daily Outlook
Daily Pivots: (S1) 127.96; (P) 128.83; (R1) 129.29; More...
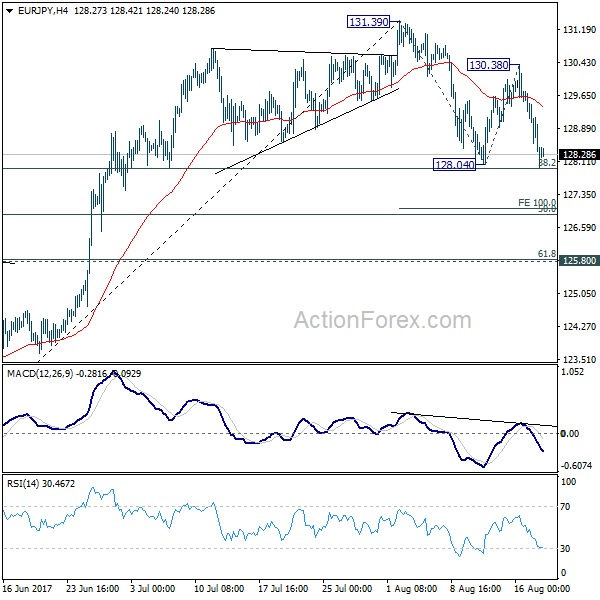
EUR/JPY's fall from 130.38 accelerates further lower and breached 128.04. Based on current momentum, the corrective fall from 131.39 will dip deeper than originally expected. Intraday bias is now on the downside. Break of 38.2% retracement of 122.39 to 131.39 at 127.95 will target 100% projection of 131.39 to 128.04 from 130.38 at 127.03. We'll looking for bottoming above 125.80 cluster support (61.8% retracement at 125.82) . On the upside, break of 130.38 is needed to signal completion of the correction. Otherwise, deeper decline is now mildly in favor.
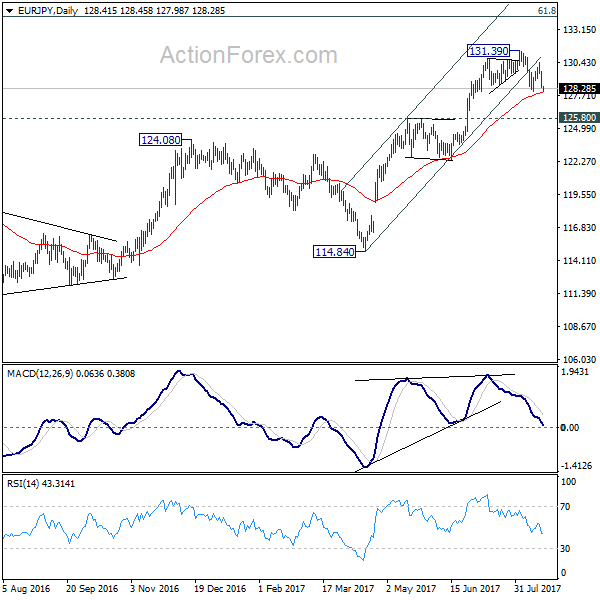
In the bigger picture, the down trend from 149.76 (2014 high) is completed at 109.03 (2016 low). Current rally from 109.03 should be at the same degree as the fall from 149.76 to 109.03. Further rise is expected to 61.8% retracement of 149.76 to 109.03 at 134.20. Sustained break there will pave the way to key long term resistance zone at 141.04/149.76. Medium term outlook will remain bullish as long as 124.08 resistance turned support holds.
EURGBP Sends A Strong Sell Signal
Key Points:
- Wedge pattern/channel constricting price actions movements.
- RSI Oscillator demonstrating some divergence as it continues to trend lower.
- Watch for a breakdown back towards the 0.9000 handle over the next few sessions.
The EURGBP has been on a relatively linear run higher of late as the pair has consolidated some of the recent fundamental and technical gains. Subsequently, the pair has climbed through the 0.9100 handle but the momentum could be about to run out given that there are presently some signs of slowing from the technical perspective.
In particular, the 4-hour timeframe provides some interesting clues as to which way the pair could move in the near term. A cursory review shows that although price has been moving concertedly to the upside, a small wedge pattern/channel has now formed which is constricting price actions movements. Subsequently, the chance of a breakout increases as the channel continues to narrow and the market is presented with its options.
In addition, the RSI Oscillator has recently exhibited a slightly bearish trend and is presently moving lower, within neutral territory, demonstrating a level of divergence which suggests that a downside move could be underway. The Stochastic Oscillator is also swinging to the downside and largely mirrors the direction which the RSI has recently taken.In fact, price action is now pushing against the lower channel constraint suggesting that there may be some pent up selling pressure.
Fundamentally, there are also many reasons to suggest a correction given the UK's strong Retail Sales figures released overnight. The key macroeconomic indicator largely went unnoticed but it is symptomatic of the broader trend toward increased consumer demand, and by extension inflation. Subsequently, speculation is rife that the Bank of England will need to act, either though monetary policy or a balance sheet taper, over the medium term. This is something which is going to be an ongoing process but may result in significantly stronger valuations for the Pound.
Ultimately, the most likely scenario, at least in the near term, is an eventual breakdown of the bottom of the current channel. This would result in some significant downside moves with price action taking a bearish direction towards support around the key 0.9000 handle, and 0.8950 in extension. This move seems to be relatively likely over the next few session given some of the apparent selling pressures evident within the broader FX book. However, it is worth noting that there are plenty of strong sentiment swings around both the world's current geopolitical risk factors, as well as the Brexit, which would bear watching closely.
Market Update – Asian Session: Asia Tracks Declines In US Equities, But Initial Losses Less Severe
Asia Summary
Following the over 2% decline seen in the Nasdaq during NY trading, Asian equities are broadly weaker. Some attributed the weakness in US equities to concerns about President Trump’s economic policies amid speculation (that was later denied) that White House Economic Advisor and former Goldman COO Gary Cohn might consider resigning . The earlier terrorist attack in Barcelona was also said to weigh. During today’s Asian session, Catalonia officials said they thwarted a separate incident in Cambrils, which is south of Barcelona.
In terms of sectors, the Japanese chip equipment sector has been in focus after Applied Materials traded higher on better than expected quarterly results and guidance.
Shares of Lenovo traded lower after the company reported an unexpected Q1 loss, amid declines in gross margins.
Key economic data
(CN) CHINA JUL PROPERTY PRICES M/M: RISE IN 56 OUT OF 70 CITES VS 60 PRIOR; Y/Y RISE IN 70 OUT OF 70 CITIES VS 70 PRIOR
Speakers and Press
China
(CN) People’s Daily: US won’t win and cannot afford trade war against China
(CN) China State Planner (NDRC) Approves CNY165.5B in fixed-asset investment projects in July
(CN) China insurance regulator (CIRC) wants insurers to disclose info related to ‘big’ investment projects and ‘major’ losses – Chinese Press
Other
(ES) Catalonia Government: One police officer was injured in alleged terrorist attack in Cambrils; there are 4 presumed terrorists that have been killed**Note: On Thursday, in Barcelona a van rammed into dozens of people at the Ramblas tourist area; Cambrils is located south of Barcelona.
(NZ) New Zealand Foreign Visitor Spending in June Year at NZ$10.3B, flat y/y; China visitor spending -16%; Avg spending per tourist NZ$3.2K, -8%; Suggests the stronger Kiwi (NZD) could be a factor
Asian Equity Indices/Futures (00:30ET)
Nikkei -1.1%, Hang Seng -0.8%, Shanghai Composite -0.2%, ASX200 -0.7%, Kospi -0.1%
Equity Futures: S&P500 +0.1% ; Nasdaq +0.3% , Dax +0.1% , FTSE100 +0.2%
FX ranges/Commodities/Fixed Income (00:30ET)
EUR 1.1709-1.1735; JPY 109.30-109.58 ; AUD 0.7870-0.7900; NZD 0.7276-0.7295
Aug Gold +0.1% at 1,293/oz; Aug Crude Oil -0.2% at $47.02/brl; Sept Copper +0.4% at $2.92/lb
GLD SPDR Gold Trust ETF daily holdings unchanged at 795.4 Mt
(CN) PBOC SETS YUAN REFERENCE RATE AT 6.6744 V 6.6709 PRIOR
(CN) China PBOC OMO injects CNY120B v CNY100B in 7 and 14-day reverse reports prior: net injection CNY20B v CNY50B prior
(CN) PBoC auctions 3-month MOF deposits at yield of 4.46%
(AU) Australia sells A$500M in 2.0% 2021 bonds, avg yield 2.1077%%, bid to cover 5.62x
Equities notable movers
Australia
Kingsgate Consolidated, KCN.AU Favorable regulatory decision in Thailand; +35%
Kogan.com, KGN.AU FY17 net profit more than doubled; +7%
Hong Kong/China
Lenovo, 992.HK, Reported unexpected Q1 Net loss as gross margins missed ests; -2.3%
US markets on close: Dow -1.2%, S&P500 -1.5%, Nasdaq -1.9%, Russell -1.8%
Best Sector in S&P500: Utilities, Real Estate -0.7%
Worst Sector in S&P500: Tech -2%
At the close: VIX 15.55 (+3.81pts); Treasuries: 2-yr 1.31% (-2bps), 10-yr 2.19% (-4bps), 30-yr 2.78% (-3bps)
US Market Summary
Unfounded market speculation that White House economic advisor Gary Cohn was considering stepping down sent prices tumbling in the morning, followed by more pressure on equities as reports came in of a horrendous terrorist attack in Barcelona, Spain. The S&P extended its fall to the lowest level in a month, while the VIX index gained 28%, rising above 15.00 for the first time in a week. Treasury yields continued to decline as investors sought safety, with the 10-year yield down 3 bps to 2.19. Gold also on the rise today amid uncertainty, with the precious metal rising 0.4% to $1,288.00
US Afterhours Mover
SPWH Reports Q2 $0.15 v $0.13e, Rev $191.5M v $192Me; Guides Q3 $0.23-0.26 v $0.24e, Rev $220-225M v $228Me, SSS -6 to -8%; +14.2% afterhours
ROST Reports Q2 $0.82 v $0.76e, Rev $3.43B v $3.37Be- Guides Q3 $0.64-0.67 v $0.77e, SSS +1-2% - Guides Q4 $0.88-0.92, SSS +1-2% +10.1% afterhours
GPS Reports Q2 $0.68 v $0.52e, Rev $3.80B v $3.77Be- Raises FY17 $2.02-2.10 v $2.00e (prior $1.95-2.05) +6.3% afterhours
ZOES Reports Q2 $0.00 v $0.02e, Rev $74.3M v $75.4Me; affirms FY17 Rev $314-322M v $316Me, SSS flat to -3%; -2.0% afterhours
European Open Briefing: Equity Markets Across The Asia-Pacific Region Were Down Early On Friday
Global Markets:
- Asian stock markets: Nikkei lost 1.25 %, Shanghai Composite dropped 0.20 %, Hang Seng down 0.75 %, ASX lost 0.67 %
- Commodities: Gold at $1292.88 (+ 0.05%), Silver at $16.96 (- 0.55 %), WTI Oil at $47.05 (-0.08 %), Brent Oil at $50.98 (-0.10 %)
- Rates: US 10-year yield at 2.20, UK 10-year yield at 1.09, German 10-year yield at 0.41
News & Data:
- GBP Retail Sales m/m 0.3 % vs 0.2 % expected
- EUR Final CPI y/y 1.3 % vs 1.3 % expected
- CAD Manufacturing Sales m/m -1.8 % vs -1.0 % expected
- USD Unemployment Claims 232 K vs 240 K expected
- USD Philly Fed Manufacturing Index 18.9 vs 18.3 expected
- USD Industrial production m/m 0.2 % vs 0.3 % expected
- Dollar slips vs yen, dented by doubts over U.S. policy agenda – RTRS
- Oil prices fall amid broader market selloff, despite tightening supplies – RTRS
Markets Update:
Equity markets across the Asia-Pacific region were down early on Friday as a sense of growing unease gripped financial markets over concerns of Terrorist attack in Barcelona as well as political uncertainties in the U.S
USD/JPY dropped below 109.40 as The dollar posted its third session of losses against the yen, falling 0.15 percent in value. Meanwhile the EUR/JPY approached 128.00 and is currently seen Trading around today’s open at around 128.30 now.
EUR/USD up almost 0.1 percent on Friday gaining from its lows (circa 1.1710) to $1.17305, making up some of the previous session's 0.4 percent drop. From a technical perspective, the Euro aggressively whipsawed through the 1.17 handle yesterday, challenging the demand at 1.1650-1.1664.
GBP/USD has ticked up from lows of around 1.2860 and is currently seen trading around 1.2890. It is notable that since Tuesday, the Cable has been Consolidating between the 1.29 handle and the mid-level support at 1.2850.
Upcoming Events:
- 12:30 GMT – (CAD) CPI m/m
- 12:30 GMT – (CAD) Core Retail Sales m/m
- 12:30 GMT – (CAD) Common CPI y/
- 12:30 GMT – (CAD) Retail Sales m/m
- 14:00 GMT – (CAD) Prelim UoM Consumer Sentiment
- 14:15 GMT – (USD) FOMC Member Kaplan Speaks
Aussie Dollar Trading Higher In The Asian Session
For the 24 hours to 23:00 GMT, the AUD declined 0.43% against the USD and closed at 0.7891.
LME Copper prices rose 0.4% or $27.0/MT to $6460.0/MT. Aluminium prices rose 1.0% or $20.5/MT to $2095.5/MT.
In the Asian session, at GMT0300, the pair is trading at 0.7896, with the AUD trading 0.06% higher against the USD from yesterday’s close.
Earlier today, in China, Australia’s largest trading partner, the house price index climbed 9.7% YoY in July. The index had risen 10.2% in the prior month.
The pair is expected to find support at 0.7856, and a fall through could take it to the next support level of 0.7817. The pair is expected to find its first resistance at 0.7949, and a rise through could take it to the next resistance level of 0.8003.
The currency pair is trading below its 20 Hr moving average and showing convergence with its 50 Hr moving average.
