Sample Category Title
EURUSD Intraday Analysis
EURUSD (1.1733): The EURUSD was a bit volatile yesterday with price action seen consolidating near the support level of 1.1730. Price action is likely to continue this way until further clear direction is established. In the short term, a minor support level has been formed at 1.1691. A break down below this level will suggest further declines to 1.1635 as suggested previously. To the upside, if price continues to push higher, then support is likely to be established at 1.1730. A bounce off this level will signal a move towards 1.1800.
ECB Meeting Minutes Suggests Concerns On Euro Rally
The minutes of the meeting from the ECB that was released yesterday showed that while officials of the governing council discussed tweaking the forward guidance, concerns about further gains in the exchange rate kept officials from making such changes. The euro initially gains on the release of the ECB minutes but soon gave back the gains.
The Japanese yen continued to strengthen on the back of the fresh terror attacks in Spain as investor's risk appetite declined. In the UK, retail sales figures were slightly better than expected but remained low compared to the month before.
Looking ahead, the economic calendar today will focus on the Canadian inflation data. Economists are expecting to see a flat print for the month following a decline of 0.1% previously. In the US, the UoM consumer sentiment data is forecast to rise to 94.0 from 93.4.
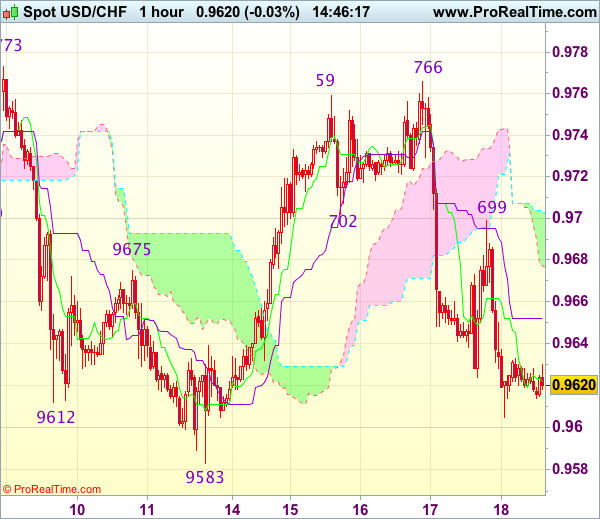
Trade Idea : USD/CHF – Stand aside
USD/CHF - 0.9615
Most recent candlesticks pattern : N/A
Trend : Near term up
Tenkan-Sen level : 0.9622
Kijun-Sen level : 0.9652
Ichimoku cloud top : 0.9702
Ichimoku cloud bottom : 0.9676
New strategy :
Stand aside
Position : -
Target : -
Stop : -
As the greenback has remained under pressure after yesterday’s selloff from 0.9699, suggesting near term downside risk remains for the fall from 0.9766 to extend weakness towards previous support at 0.9583, however, break there is needed to retain bearishness and signal another leg of decline from 0.9773 is underway and extend subsequent fall to 0.9550 which is likely to hold on first testing.
In view of this, would not chase this fall and stand aside for now. Above 0.9660-65 would bring another bounce to 0.9699 resistance but break there is needed to signal the fall from 0.9766 has ended, bring a stronger rebound to 0.9720-30, however, as broad outlook remains consolidative, said resistance at 0.9766 should hold.
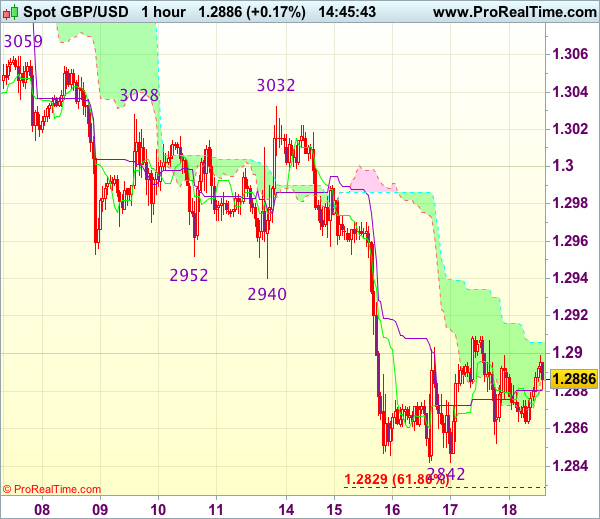
Trade Idea : GBP/USD – Sell at 1.2920
GBP/USD - 1.2895
Most recent candlesticks pattern : N/A
Trend : Near term down
Tenkan-Sen level : 1.2881
Kijun-Sen level : 1.2880
Ichimoku cloud top : 1.2906
Ichimoku cloud bottom : 1.2886
Original strategy :
Sell at 1.2920, Target: 1.2820, Stop: 1.2955
Position : -
Target : -
Stop : -
New strategy :
Sell at 1.2920, Target: 1.2820, Stop: 1.2955
Position : -
Target : -
Stop : -
As cable has recovered after falling to 1.2842 earlier this week, suggesting consolidation above this level would be seen and corrective bounce to 1.2920 cannot be ruled out, however, reckon previous support at 1.2933-40 would turn into resistance and limit upside, bring another decline later, below said support at 1.2842 would extend recent selloff to 1.2825-30 (61.8% projection of 1.3269-1.2940 measuring from 1.3032), having said that, oversold condition should limit downside to 1.2800 and reckon 1.2770 would hold from here, bring rebound later.
In view of this, would not chase this fall here and would be prudent to sell sterling on recovery as said previous support at 1.2933 should cap cable’s upside, bring another decline. Above 1.2950 would defer and risk a stronger rebound to 1.2990-00 before another decline.
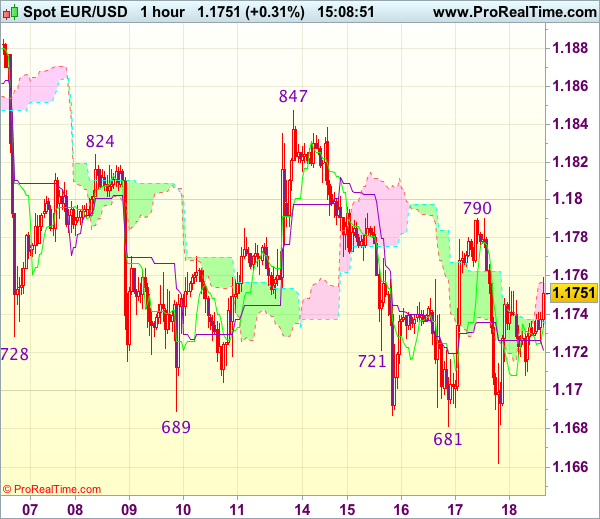
Trade Idea : EUR/USD – Hold long entered at 1.1715
EUR/USD - 1.1745
Most recent candlesticks pattern : N/A
Trend : Sideways
Tenkan-Sen level : 1.1729
Kijun-Sen level : 1.1721
Ichimoku cloud top : 1.1757
Ichimoku cloud bottom : 1.1736
Original strategy :
Bought at 1.1715, Target: 1.1815, Stop: 1.1680
Position : - Long at 1.1715
Target : - 1.1815
Stop : - 1.1680
New strategy :
Hold long entered at 1.1715, Target: 1.1815, Stop: 1.1680
Position : - Long at 1.1715
Target : - 1.1815
Stop : - 1.1680
Although the single currency fell briefly to 1.1662 yesterday, the subsequent rebound suggests a temporary low is possibly formed there and consolidation with mild upside bias remains for another test of indicated resistance at 1.1790, however, break there is needed to add credence to this view, bring further gain to 1.1820 but resistance at 1.1847 should hold from here.
In view of this, we are holding on to our long position entered at 1.1715. Below 1.1680-85 would risk retest of 1.1662, break there would extend the erratic decline from 1.1910 top to 1.1640-50 (50% Fibonacci retracement of 1.1370-1.1910 and previous support) but reckon 1.1600 would hold from here.
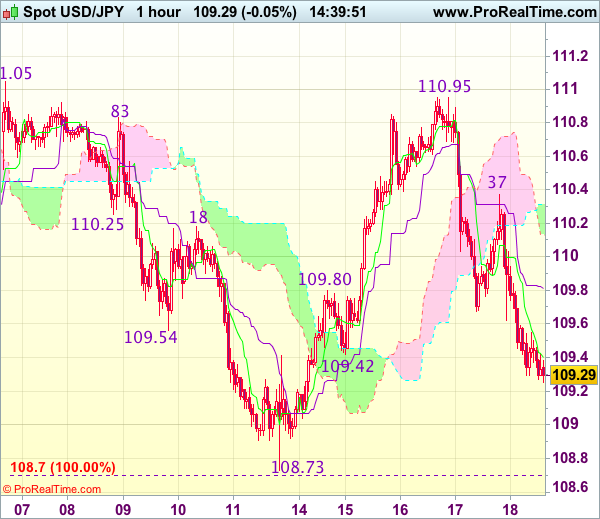
Trade Idea : USD/JPY – Stand aside
USD/JPY - 109.17
Most recent candlesticks pattern : N/A
Trend : Near term up
Tenkan-Sen level : 109.35
Kijun-Sen level : 109.76
Ichimoku cloud top : 110.31
Ichimoku cloud bottom : 110.13
New strategy :
Stand aside
Position : -
Target : -
Stop : -
Although the greenback has fallen again after meeting renewed selling interest at 110.37 and near term downside risk remains for weakness towards previous support at 108.73, as broad outlook remains consolidative, reckon downside would be limited and bring rebound later due to near term oversold condition. A firm break below said support at 108.73 would signal recent decline has finally resumed and extend weakness to 108.50 first.
In view of this, would not chase this fall here and would be prudent to stand aside for now. Above 109.50-55 would bring recovery to the Kijun-Sen (now at 109.76) but upside should be limited to the lower Kumo (now at 110.13) and said resistance at 110.37 should hold from here, bring another decline.
The White House Rumors And Barcelona Attack Weigh On Market Sentiment
Dollar Slips Vs Yen As Risk Sentiment Wobbles. Risk-aversion sentiment pushed gold and the Japanese yen to their highest level since 11 August. The dollar inched lower versus the yen on Friday, hampered by renewed investor concerns over the Trump administration’s ability to push forward its economic policy agenda. The dollar fell 0.2 percent to 109.41 yen, adding to its 0.6 percent drop on Thursday.
Canadian Dollar Off Two-Week High. The Canadian dollar weakened against its U.S. counterpart on Thursday, as White House drama and an attack in Barcelona reduced investor appetite for the loonie after it hit a nearly two-week high earlier in the day. “People are rushing into the U.S. dollar out of Canada, but they are also rushing out of the U.S. dollar into the euro, gold, Swiss and yen,” said Eric Theoret, a currency strategist at Scotiabank.
Euro Steady But Down 0.8 Percent For The Week. The euro had tumbled to a three-week low of $1.1662 on Thursday, after the minutes of the European Central Bank’s July 20 policy meeting showed policymakers were worried that the repricing of the currency could overshoot. Even with its losses this week, the euro is still up more than 11 percent so far this year.
Elliott Wave View: Dow Future
Short term Dow Futures (YM_F) Elliott wave view suggest that the rally to 8/08 peak 22177 ended the “Cycle” from Feb 11, 2016 low. The decline from there is unfolding as an impulse suggesting the index could be following a Elliott Wave Zigzag pattern in larger degree correction. From there Intermediate wave (1) ended at 21789 in 5 waves at 21789 low and bounce from there ended in 3 swings at 22070 peak as another zigzag pattern within intermediate wave (2).
The decline from there is unfolding as an impulse Elliott wave structure within intermediate wave (3). Below from 21789 peak, Minor wave 1 ended at 21993, Minor wave 2 ended at 22034 peak. Below from there Minute wave ((i)) ended at 21885, Minute wave ((ii)) ended at 21950, Minute wave ((iii)) ended at 21705 low and above from there doing a Minute wave ((iv)) bounce. Which is expected to unfold in 3 swings and shouldn’t pass the 0.382% fibonacci retracement area 21798 of Minute wave ((iii)) for the idea to remain alive for further downside in Minute wave ((v)) of 3 lower initially. We don’t like selling the pullback and expect further downside extension as far as pivot from 22070 peak & more importantly from 22177 peak remains intact to continue correction lower.
Dow Futures 1 Hour Elliott Wave Chart
According to Elliott wave theory, the zigzag is a 3-wave structure that has an internal subdivision of (5-3-5) oscillation sequence. The internal oscillations are labeled A, B, C where A = 5 waves, B = 3 waves and C = 5 waves. This means that A and C can be impulsive or diagonal waves. The A and C waves must meet all the conditions of wave structure 5, such as: having an RSI divergence between wave subdivisions, ideal Fibonacci extensions, ideal retracts, etc. In the graph below, we can see how the Zig Zag structure of Elliott Wave looks. 5 waves down in A, 3 waves in B and 5 waves down in C
US President Trump Abandoned Plans To Create An Infrastructure Advisory Council Yesterday
Market movers today
Today is set to be a relatively quiet day in terms of data releases.
Focus is on the US, where University of Michigan Consumer Confidence for August is due for release. In the wake of increasing tension and harder rhetoric between the US and North Korea recently, we expect the consumer confidence figure to be lower than the previous month's. Furthermore, Fed's Kaplan (voter, dovish) also speaks today.
The Canadian CPI figures for July will also be of interest , in light of the recent hawkish turn of the Bank of Canada and markets will focus on whet her the BoC's projected rebound in inflation will actually materialise, despite falling inflation expectations.
Selected market news
ECB minutes yesterday revealed that the Governing Council expressed concern over risk of euro overshooting. The effective euro has strengthened further since the ECB meeting in July. On the back of the ECB minutes EUR/USD slid and the EUR fixed income market rallied slightly.
Yesterday, euro area headline and core inflation in July were confirmed at 1.3% y/y and 1.2% y/y, respectively. Service price inflation (~60% of core inflation) was revised slightly higher to 1.6% y/y and therefore it was unchanged from June. Non-energy industrial goods price inflation (~40% of core inflation) was lifted by durables goods price inflation. Looking ahead, we expect the stronger euro to drag down this part of service price inflation.
US President Trump abandoned plans to create an infrastructure advisory council yesterday. Last month Trump signed an executive order to establish the advisory council with members drawn from realestate, construction, transportation and other sectors of the economy (see Reuters, 17, August ).
US initial jobless claims released yesterday fell to 232k in July (from 244k), which is the lowest level since February. This adds to signs showing some re-acceleration into H2 18. The Philly Fed business condition index fell slightly to 19.5 from 18.9, which was still higher than consensus at 18.0.
Daily Technical Analysis: USD/JPY Bearish ABC Zigzag Challenges 78.6% Fibonacci
Currency pair USD/JPY
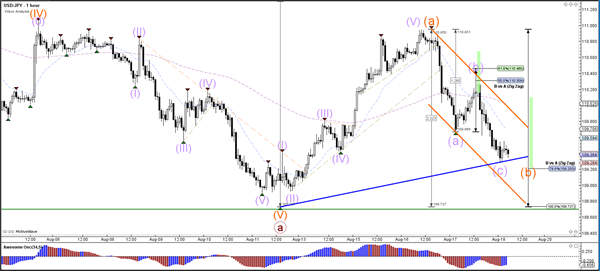
The USD/JPY is following the path of least resistance mentioned in the wave analysis earlier this week: a turn at the 38.2% Fibonacci resistance level at wave A (orange) followed by an ABC deep correction within wave B (orange). A bullish bounce could complete wave B and start wave C, but this ABC zigzag is invalidated if price manages to break below the 100% Fib at 108.73.
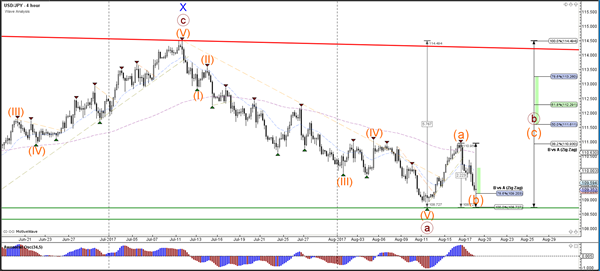
The USD/JPY indeed completed an ABC (purple) as expected within wave B (orange).
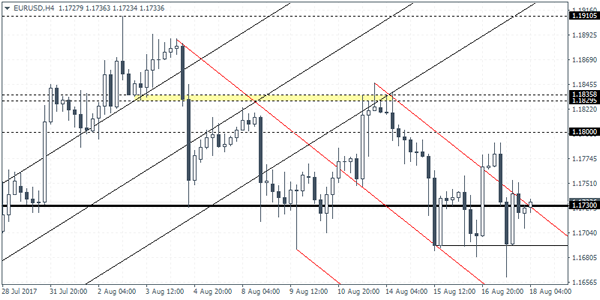
Currency pair EUR/USD
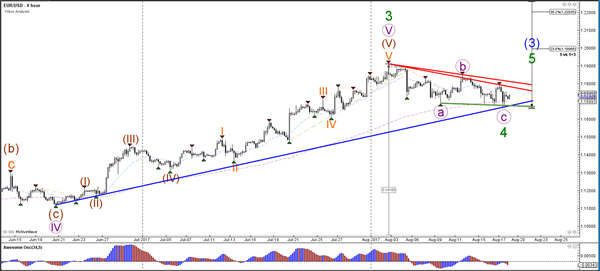
The EUR/USD made one more lower low at 1.0660 yesterday, which invalidated the immediate bullish reversal. However, price is still above the long-term trend line (blue), local support (green), and long-term moving average, which favours a wave 4 (green) correction. A bullish break above resistance (red) would confirm the end of wave 4 and start of wave 5.
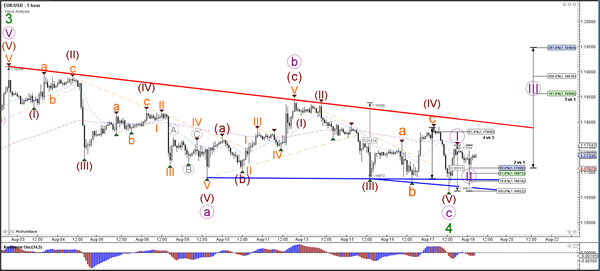
The EUR/USD seems to have made a wave 4 (brown) extension with wave ABC (orange). Price be again attempting to build a wave 1-2 (purple) as long as price stays above the 100% Fib level. A break above resistance (red) line could see wave 3 start.
Currency pair USD/JPY
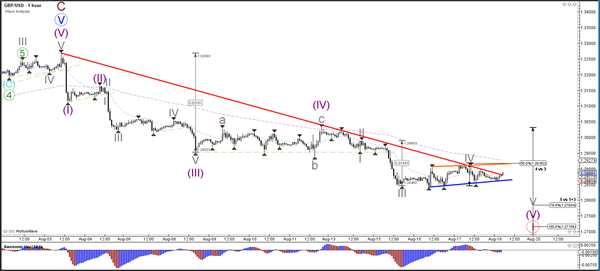
The GBP/USD is building a bear flag pattern and testing the resistance trend line (red). A bullish break should start a wave 2 (red) correction whereas a bearish break could still indicate the continuation of wave 5 of wave 1 (red).
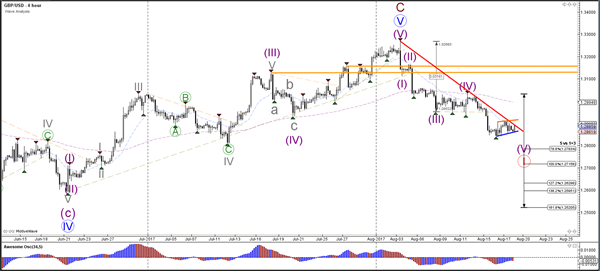
GBP/USD could be building bear flag chart pattern (orange/blue) within a wave 4 (grey). This scenario is invalidated if price manages to break above the top of the bear flag (orange line) and 50% Fib of wave 4 vs 3.