
Sample Category Title
The Euro Lost Traction and Fell to Fresh Three-Week Low
The Euro lost traction and fell to fresh three-week low at 1.1662 after repeated rejection at 1.1800 resistance zone and was additionally pressured by better than expected US data. Also, dovish tone from the ECB minutes suggests that the central bank may stand aside in September's meeting and further delay signaling its QE program tapering. With bearish near-term technicals and dailies building up bearish momentum, near-term risk remains shifted lower. Violation of key supports at 1.1680 zone could be seen as strong bearish signal, however, close below is needed to complete failure swing pattern on daily chart and confirm scenario for extension towards next strong support at 1.1607 (Fibo 38.2% of 1.1188/1.1910 upleg). Bearish outside day is forming on daily chart and could add pressure on the pair's near-term action. Converging 10/20SMA's are attempting to form bear-cross at 1.1760 which now acts as strong resistance.
Res: 1.1737; 1.1760; 1.1789; 1.1838
Sup: 1.1685; 1.1662; 1.1640; 1.1607
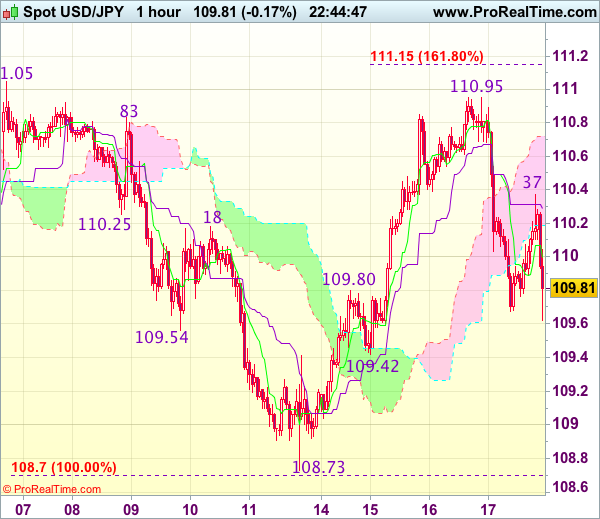
Trade Idea Wrap-up: USD/JPY – Stand aside
USD/JPY - 109.84
Most recent candlesticks pattern : N/A
Trend : Near term up
Tenkan-Sen level : 110.00
Kijun-Sen level : 110.29
Ichimoku cloud top : 110.72
Ichimoku cloud bottom : 110.19
New strategy :
Stand aside
Position : -
Target : -
Stop : -
Despite yesterday’s marginal rise to 110.95, the subsequent selloff on dollar’s broad-based weakness, dampening our bullishness and suggesting the rebound from 108.73 has ended at 110.95, hence downside risk is seen for weakness to 109.60, then test of support at 109.42, however, as broad outlook remains consolidative, reckon downside would be limited to 109.00-05 and said support at 108.73 should remain intact.
In view of this, would be prudent to stand aside for now. Above 110.40 would bring recovery to the upper Kumo (now at 110.72), however, price should falter below said resistance at 110.95, bring another retreat later.
Canadian Manufacturing Sales Pulled Back in June
Highlights:
- Manufacturing sales fell 1.8% in June.
- The drop was broadly-based with declines in 15 of 21 industries although prices accounted for more than half of a large 7.1% drop in petroleum & coal sales.
- Sale volumes fell 1.0%. That did not fully retrace the 1.2% jump in May. The measure was still up solidly from a year ago.
- Machinery sale volumes averaged 20% above year-ago levels in Q2
- Overall Q2 GDP growth still looks broadly on track to match Q1's 3.7% increase.
Our Take:
Manufacturing sales took a breather in June but the 1% drop in sale volumes still did not fully retrace the 1.2% increase in May. The often-volatile measure is still up almost 4% from a year ago. That's down from almost 5% in May but is still the second-highest year-over-year reading since December of 2014. Sales of machinery have led the way, averaging 20% above year-ago levels in volume terms in the second quarter. Part of that probably reflects stronger activity in the U.S. industrial sector year-to-date but domestic Canadian business investment has also been showing encouraging signs of life. Concerns about the recently commenced NAFTA renegotiation - and any potential for resulting trade protectionism - does present some potential downside risks going forward. At this point, though, we expect today's dip lower in sales likely is more of a downward blip on an improving trend than a fundamental slowing.
Canadian Manufacturing Sector Hits a Speedbump in June
Canadian manufacturing sales fell 1.8% in June, worse than the 1.0% decline expected by the markets. But, the decline came atop of positive revisions to the previous month, which is now reported as 1.3% gain (prev. 1.1%). After accounting for price changes the volume of sales was down by a less severe 1.0% on the month. But again, this came atop of upward revision to the previous month, where the 1.1% gain was revised to a 1.2% increase.
Both durables and nondurables contributed to the decline. Non-durables declined 2.2% as petroleum (-7.1%) and chemicals (-4.5%) experienced large declines. Durables fell 1.5% as declines in wood (-2.9%), transport equipment (-2.3%), and primary metals (-2.3%) more than offset gains in electronics (+2.3%) and machinery (+1.8%).
Regionally, manufacturing sales were down in all provinces but for Manitoba (+6.0%) and B.C. (+0.9%). Declines were particularly pronounced in energy producing Newfoundland (-13.5%), Alberta (-2.0%), and Saskatchewan (-1.9%), but the manufacturing-heavy Quebec (-3.3%) and Ontario (-1.7%) also saw sizeable declines.
Inventories were down 0.2% on the month, with the inventory-to-sales ratio up slightly to 1.36 on the weakness in shipments. Forward looking indicators were very disappointing with new and unfilled orders down 3.0% and 2.1%, respectively in June.
Key Implications
After several strong months the Canadian manufacturing sector hit a speedbump in June with sizeable declines in both value and volume terms made only slightly more palatable by the upward revisions to the previous month. The June report does not alter our view of second quarter performance, with GDP still on track to expand by about 3.7%, but suggests that a marked deceleration of growth in Q3 in in the cards.
The theme of weakness in the third-quarter (and beyond) is corroborated by the forward looking indicators with both new and unfilled orders pulling back sharply on the month. To make matters worse, this morning's U.S. industrial production report indicated that manufacturing activity south of the border declined of 0.1% in July.
Still, we expect U.S. economic growth to be generally supportive for Canadian manufacturing activity going forward. However, this support will be somewhat offset by a higher loonie which is unlikely to pare back its recent gains too much in light of expected continued tightening of monetary policy by the Bank of Canada. Having said that, the medium-term outlook for the sector remains highly uncertain given recently begun renegotiations of the North American Free Trade Agreement – with the first round of discussions taking place today.
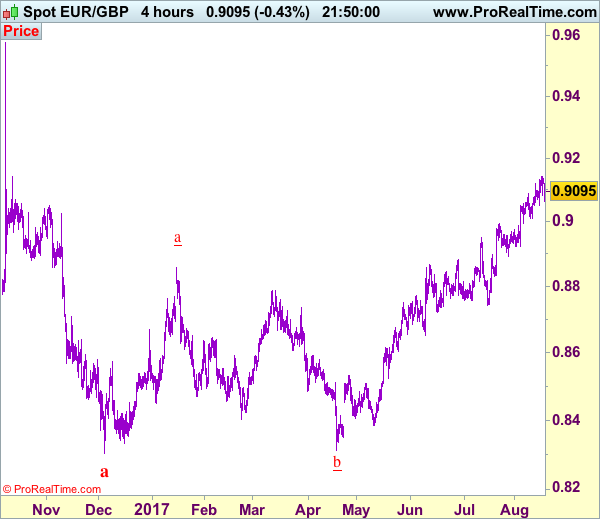
Trade Idea: EUR/GBP – Buy at 0.9000
EUR/GBP - 0.9103
Recent wave: Major double three (A)-(B)-(C)-(X)-(A)-(B)-(C) is unfolding and 2nd (A) has possibly ended at 0.6936.
Trend: Near term up
Original strategy :
Buy at 0.9000, Target: 0.9130, Stop: 0.8960
Position : -
Target : -
Stop : -
New strategy :
Buy at 0.9000, Target: 0.9130, Stop: 0.8960
Position : -
Target : -
Stop : -
As the single currency has retreated after yesterday’s brief rise to 0.9143, retaining our view that minor consolidation below this level would be seen and pullback to 0.9050-55 cannot be ruled out, however, reckon downside would be limited to 0.9015-20 and renewed buying interest should emerge around 0.9000, bring another upmove later, break of said resistance would extend recent erratic rise to 0.9160, however, weakening of near term upward momentum should prevent sharp move beyond 0.9180-85 and price should falter below 0.9200.
In view of this, would not chase this rise here and would be prudent to buy euro on subsequent pullback as 0.9000-05 would limit downside. Below 0.8960-70 would defer and suggest a temporary top is possibly formed, bring correction to 0.8922 support which is likely to hold from here.
Our preferred count is that, after forming a major top at 0.9805 (wave V), (A)-(B)-(C) correction is unfolding with (A) leg ended at 0.8400 (A: 0.8637, B: 0.9491 and 5-waver C ended at 0.8400. Wave (B) has ended at 0.9413 and impulsive wave (C) has either ended at 0.8067 or may extend one more fall to 0.8000 before prospect of another rally. Current breach of indicated resistance at 0.9043 confirms our view that the (C) leg has ended and bring stronger rebound towards 0.9150/54, then towards 0.9240/50.
Trade Idea: USD/CAD – Sell at 1.2690
USD/CAD - 1.2630
Trend: Down
Original strategy :
Sell at 1.2825, Target: 1.2625, Stop: 1.2885
Position: -
Target: -
Stop: -
New strategy :
Sell at 1.2690, Target: 1.2490, Stop: 1.2750
Position: -
Target: -
Stop:-
As the greenback has retreated quite sharply yesterday, suggesting top is possibly formed at 1.2778 earlier this week and consolidation with downside bias is seen for weakness to 1.2540-50, however, a sustained breach below there is needed to signal the wave iv correction from 1.2414 (wave iii trough) has ended at 1.2778, brig further fall to 1.2490-00 but support at 1.2451 should hold on first testing. We are keeping our count that wave v as well as wave (C) ended at 1.3794 and impulsive wave (i ii, i ii) is now unfolding with minor wave iii possibly ended at 1.2414, hence wave iv correction is underway.
In view of this, we are looking to sell on recovery but at a lower level as 1.2690-00 should limit upside. Only break of said resistance at 1.2778 would abort and signal the rebound from 1.2414 is still in progress for retracement of recent decline to 1.2825-30 but still reckon upside would be limited to 1.2880-85 (50% Fibonacci retracement of wave iii) and price should falter well below 1.2990-95 (61.8% Fibonacci retracement), bring retreat later.
To recap, wave B from 1.3066 is unfolding as an a-b-c and is sub-divided as a: 1.2192, b: 1.2716 and wave c is a 5-waver with i: 1.1983, ii: 1.2506, extended wave iii with minor iii at 1.0206, wave iv ended at 1.0781 and wave v as well as wave iii has ended at 0.9931, hence the subsequent choppy trading is the wave iv which is unfolding as (a)-(b)-(c) with (a) leg of iv ended at 1.0854, followed by (b) leg at 1.0108 and (c) leg as well as the wave iv ended at 1.0674. The wave v is sub-divided by minor wave (i): 0.9980, (ii): 1.0374, (iii): 0.9446, (iv): 0.9913 and (v) as well as v has possibly ended at 0.9407, therefore, consolidation with upside bias is seen for major correction, indicated target at 1.3700 and 1.4000 had been met and further gain to 1.4700 would be seen later.

Sterling Posts Losses on Softer Retail Sales
Following the UK CPI and labor figures published earlier this week, the Office for National Statistics released another report today on retail sales for the month of July. This showed household spending growing at a slower pace compared to a year before. As a result, sterling dipped into losses against its US and eurozone counterparts.
Looking at the numbers, UK retail sales pulled back in July after a strong rally in the previous month as British consumers cut their purchases on most products, with food items being an exception. On a yearly basis, household spending picked up by 1.3%, while analysts anticipated a growth of 1.4%. This was below the 2.8% recorded in June. Month-on-month, retail sales growth remained unchanged at 0.3%, exceeding the 0.2% expected. Moreover, in the three months to July, the figure stood at 1.8%, posting the weakest expansion since November 2013.
Excluding auto sales and fuel, retail sales were up by 1.5% year-on-year, rising above the forecast of 1.3%. Yet, this was lower than the 2.8% observed in June (downwardly revised from 3.0%). On a monthly basis, household spending slipped from 0.6% to 0.5%, above the 0.2% anticipated by analysts.
The above statistics might suggest inflationary pressures are taking a toll on household spending and consequently signal that GDP growth is less likely to show significant improvement in the foreseeable future. Note that, inflation has more than quadrupled over the last twelve months, whilst BOE policymakers project the rate to increase even further, peaking at 3.0% annually in October. Furthermore, data on Wednesday showed that despite average weekly earnings for the three months to July strengthening, annual growth in real wages for the second quarter was down by 0.5%, recording the biggest fall in three years.
Turning to the forex markets, sterling reversed yesterday's gains versus the dollar in the wake of softer household spending. Pound/dollar fell by 0.25% to a session low of 1.2856 from 1.2888 prior the data release but managed to climb to 1.2870 during afternoon European trading hours.Euro/pound initially went up by 0.20% to 0.9109 but then declined to 0.9085 after the ECB meeting minutes revealed policymakers' concerns over a rising euro.
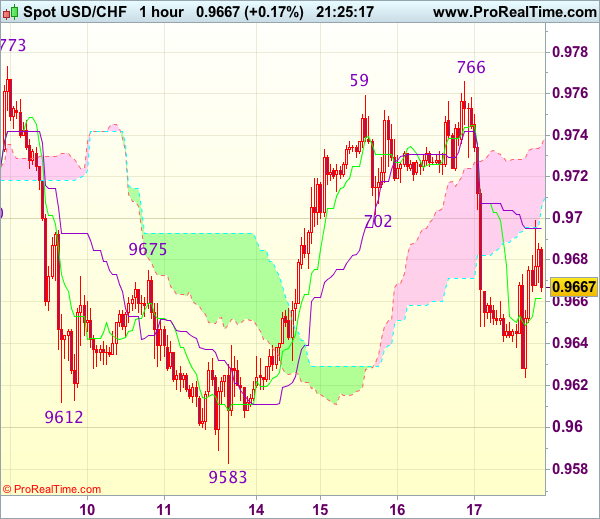
Trade Idea Update: USD/CHF – Stand aside
USD/CHF - 0.9667
New strategy :
Stand aside
Position : -
Target : -
Stop : -
Despite yesterday’s brief rise to 0.9766, the subsequent sharp retreat after faltering below resistance at 0.9773 dampened our bullishness and further choppy consolidation below said resistance would be seen, hence weakness to 0.9630-35 cannot be ruled out, however, reckon downside would be limited to 0.9600-05 and support at 0.9583 should remain intact, bring another rebound later.
On the upside, whilst recovery to 0.9700-05 cannot be ruled out, reckon upside would be limited to the upper Kumo (now at 0.9735) and price should falter well below resistance at 0.9766, bring another retreat later. As near term outlook is mixed, would be prudent to stand aside in the meantime.
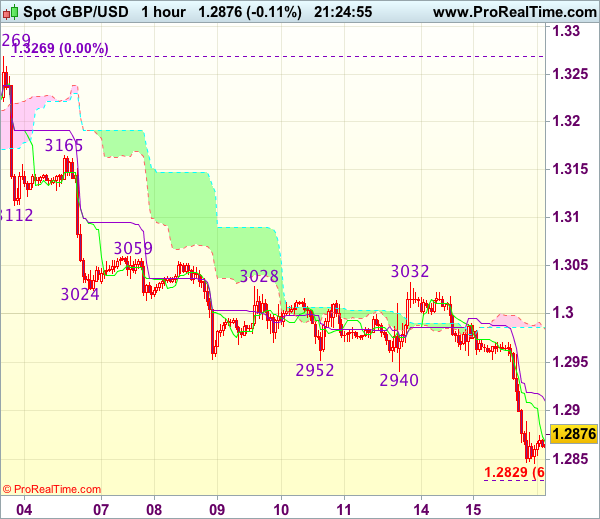
Trade Idea Update: GBP/USD – Sell at 1.2920
GBP/USD - 1.2877
Original strategy :
Sell at 1.2920, Target: 1.2820, Stop: 1.2955
Position : -
Target : -
Stop : -
New strategy :
Sell at 1.2920, Target: 1.2820, Stop: 1.2955
Position : -
Target : -
Stop : -
As cable has remained under pressure after yesterday’s selloff, adding credence to our bearish view that the decline from 1.3269 top is still in progress for retracement of early upmove, hence downside bias remains for further weakness to 1.2825-30 (61.8% projection of 1.3269-1.2940 measuring from 1.3032), having said that, near term oversold condition should limit downside to 1.2800 and reckon 1.2770 would hold from here, bring rebound later.
In view of this, would not chase this fall here and would be prudent to sell sterling on recovery as said previous support at 1.2933 should turn into resistance and cap cable’s upside, bring another decline. Above 1.2950 would defer and risk a stronger rebound to 1.2990-00 before another decline.
Euro Sinks after ECB Minutes
The EURUSD pair has moved to a 14-day trading low, after soft eurozone inflation figures, and considerably dovish ECB meeting minutes, where ECB policy makers played down tapering, and expressed concern about the foreign exchange market's overshooting.
So far, the EURUSD has found intraday support from the pairs monthly pivot point, at 1.1665, after being strongly rejected from the euro's 200-week moving average, at 1.1783.
Key EURUSD technical resistance is found at the 2015 price high, at 1.1713, and the pairs daily pivot point, at 1.1737. Above the 1.1737 level, the 100-hour moving average is found at 1.1765.
To the downside, the 1.1665 level remains the key support area capping further extended intraday losses for the EURUSD.
Below the monthly pivot, the 8-hour 100 period moving average is found at 1.1639, with the July 26th swing low offering further support at 1.1610.