Sample Category Title
GOLD Continued Bearish Consolidation
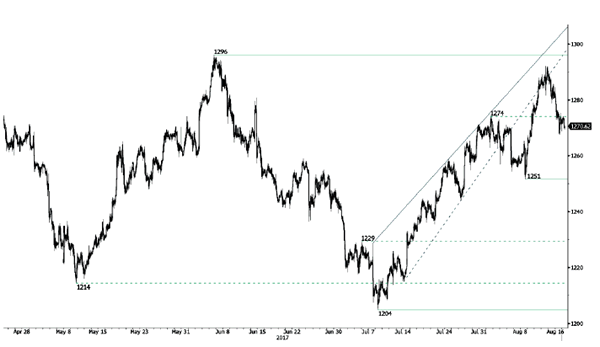
Gold continues its consolidation lower. Hourly support is given at 1251 (08/08/2017 low). Stronger support lies at 1204 (10/07/2017 high). The commodity has failed for the time being to head towards resistance given at 1296 (06/06/2017 high). Expected to show renewed buying pressures.
In the long-term, the technical structure suggests that there is a growing upside momentum. A break of 1392 (17/03/2014) is necessary ton confirm it, A major support can be found at 1045 (05/02/2010 low).
EUR/CAD Elliott Wave Analysis
EUR/CAD – 1.4939
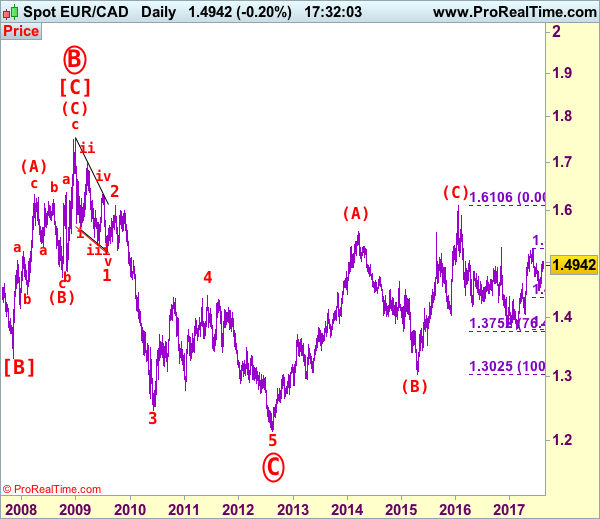
As euro has maintained a firm undertone after breaking above resistance at 1.4980, adding credence to our view that the fall from 1.5259 top has ended at 1.4478 last month, hence consolidation with mild upside bias remains for gain to 1.5050, then 1.5100-10, however, reckon near term overbought condition would limit upside to 1.5155-60 and price should falter well below said resistance at 1.5259, bring retreat later.
Our latest preferred count is that larger degree wave [C] from 1.3289 as well as circle wave B ended at 1.7509 in Dec 2008 with (A): 1.6325, (B): 1.4719 followed by wave (C) at 1.7509, hence circle wave C is unfolding with wave 1 ended at 1.5186 (diagonal wave 1), wave 2 at 1.6096, impulsive wave 3 has ended at 1.2451, followed by wave 4 at 1.4380, in view of recent strong rebound, we are now treating the wave 5 as well as larger degree circle wave C has ended at 1.2129, hence (A)-(B)-(C) correction has commenced from there with impulsive wave (C) now unfolding and indicated initial upside target at 1.6000 had been met and reckon 1.6500 would hold.
On the downside, whilst initial pullback to 1.4890-00 and possibly 1.4835-40 cannot be ruled out, reckon downside would be limited to 1.4790-00 and bring another rise later. A drop below support at 1.4709 would suggest top is formed instead, bring test of previous resistance at 1.4684 but break there is needed to signal the rebound from 1.4478 has ended, bring further fall to 1.4620-30, then 1.4580-85, once this level is penetrated, this would confirm and signal another leg of decline from 1.5259 is underway for retest of 1.4478 first.
Recommendation: Stand aside for this week.
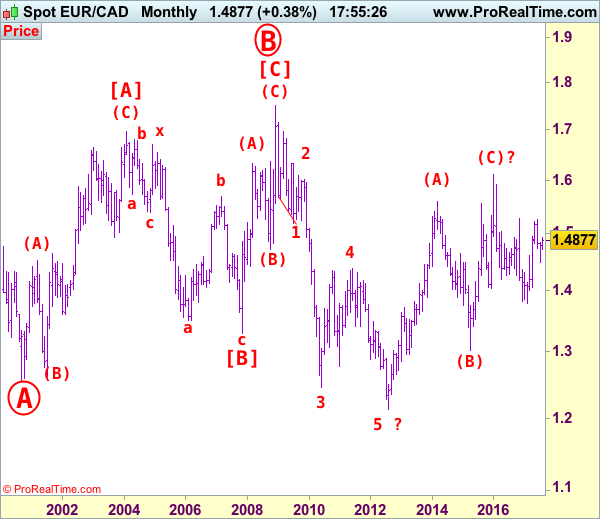
On the bigger picture, our long-term count on the monthly chart is that a big sideways consolidation from 2000 low of 1.2557 has possibly ended at 1.7509 as circle wave B with [A]: 1.6976 ( (A): 1.4513, (B): 1.2612, (C): 1.6976), wave [B]: 1.3289 is a double three with 1st a-b-c: 1.5384, x: 1.6709 and 2nd a-b-c: 1.3289. As indicated above, the wave [C] has ended at 1.7509. The selloff from there is now unfolding which itself should be labeled as an impulsive wave with wave 1: 1.5186 (diagonal wave 1), followed by wave 2: 1.6096 and wave 3: 1.2451, wave 4: 1.4380, wave 5 as well as larger degree circle wave C has possibly ended at 1.2129 and major correction has possibly commenced for retracement of recent decline towards 1.4000, then 1.4180-90 (38.2% Fibonacci retracement of 1.7509-1.2129). Below said support at 1.2129 would risk weakness to psychological support at 1.2000 and then 1.1851 (50% projection of 1.7509-1.2451 measuring from 1.4380) but reckon 1.1500 would remain intact, bring reversal later.
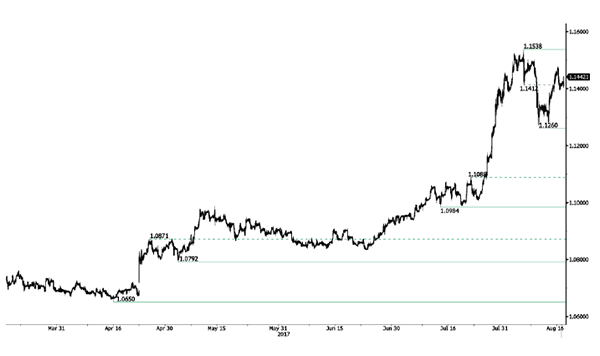
EUR/CHF Bouncing Higher
EUR/CHF's short-term buying pressures are back on. Hourly support is now located at 1.1260 (04/08/2017 low). Expected to show continued increase.
In the longer term, the technical structure has reversed. Strong resistance at 1.1200 (04/02/2015 high) has been broken. Yet,the ECB's QE programme is likely to cause persistent selling pressures on the euro, which should weigh on EUR/CHF. Supports can be found at 1.0184 (28/01/2015 low) and 1.0082 (27/01/2015 low).
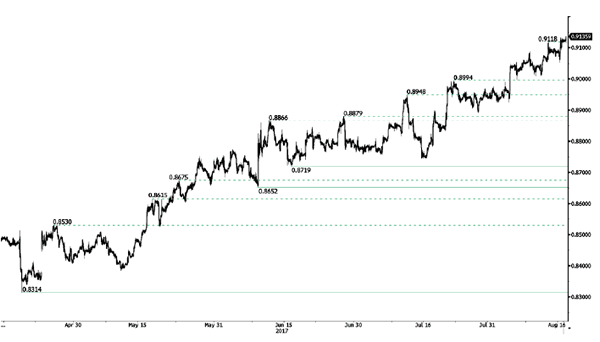
EUR/GBP Consolidating Below 0.9100
EUR/GBP is trading around its highest levels of the year despite ongoing consolidation. Hourly resistance lies at 0.9087 (08/08/2017 high). Hourly support is given at a distance at 0.8742 (16/06/2017 low). Downside risks are nonetheless important.
In the long-term, the pair has largely recovered from recent lows in 2015. The technical structure suggests a growing upside momentum. The pair is trading above from its 200 DMA. Strong resistance can be found at 0.9500 psychological level.
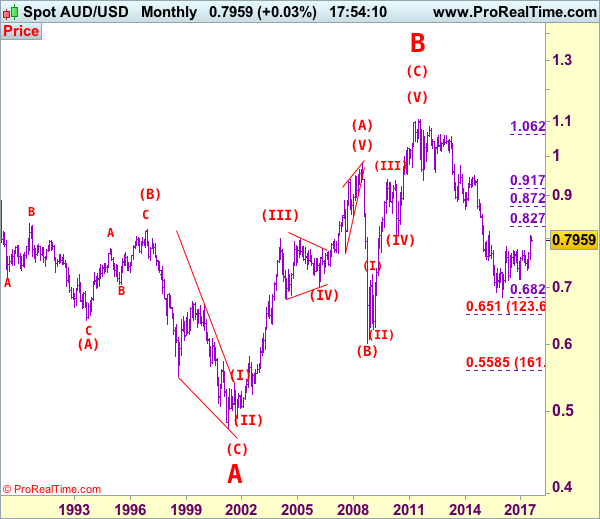
AUD/USD Elliott Wave Analysis
AUD/USD – 0.7823
Aussie has continued trading lower after retreating from recent high of 0.8066, suggesting a temporary top has possibly been formed there and near term downside risk remains for the retreat from there to bring retracement of early upmove, hence weakness to 0.7760 (61.8% Fibonacci retracement of 0.7571-0.8066) cannot be ruled out, however, a drop below previous resistance at 0.7712 is needed to provide confirmation, bring subsequent decline towards 0.7650.
We are keeping our count that top has been formed at 1.1081 (wave 5 of V) and major correction (A-B-C-X-A-B-C) has commenced, indicated downside targets at 0.7945 (61.8% Fibonacci retracement of entire rise from 0.6007-1.1081) and 0.7750 had been met and downside bias is seen for further weakness to 0.6800, then 0.6700 but reckon 0.6500 would hold from here.
Our preferred count is that the rally from 0.6007 to 0.7270 (7 Jan 2009) is marked as wave A, the retreat to 0.6248 (2 Feb 2009) is wave B and the subsequent upmove is labeled as wave C with wave (iii) and wave (iv) ended at 0.8265 and 0.7700 respectively and wave (v) as well as 3 ended at 0.9407, then wave 4 ended at 0.8066 (instead of 0.8578). The wave 5 has met our indicated projection target of 1.1060 and could ended at 1.1081, this level is now treated as the peak of wave (C) as well as larger degree wave B, hence major fall in wave C has commenced, our initial downside target at psychological support at 0.7000 has just been met and further weakness to 0.6500 would be seen later.
On the upside, whilst recovery to 0.7875-80 cannot be ruled out, reckon resistance at 0.7919 would limit upside and bring another decline later. A daily close above this level would suggest first leg of corrective decline from 0.8066 top has ended, risk a stronger rebound to 0.7950, then 0.7980, however, upside should be limited to 0.8000 and bring another decline. A daily close above 0.8000 would bring retest of 0.8066 but break there is needed to signal medium term erratic rise from 0.6827 (2016 low) has resumed and extend gain to 0.8100, then towards previous resistance at 0.8163.
Recommendation: Stand aside for this week.

Our alternate count on the daily chart treated the top formed in 2008 at 0.9851 could be a larger degree wave I and was followed by a deep and sharp correction in wave II to 0.6007 and wave III is unfolding from there.
The long-term uptrend started from 0.4775 (2 Apr 2001) with an impulsive structure. Wave I is labeled as 0.4775 to 0.9851 (15 Jul 2008), wave II has ended at 0.6007 (Oct 2008) and wave III is still in progress which may extend further gain to 1.1265.
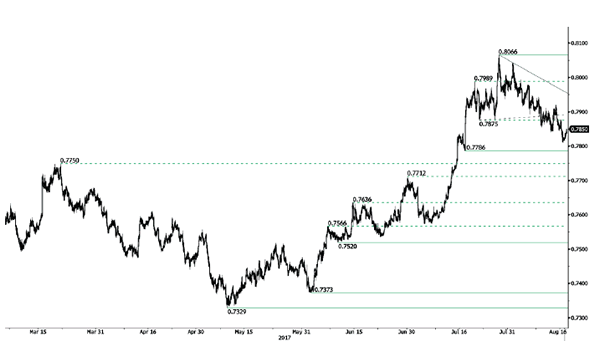
AUD/USD Growing Selling Pressures
AUD/USD's short-term technical structure is bearish. Hourly support can be found at 0.7786 (18/07/2017 low) has been broken. Hourly resistance is given at 0.8066 (27/07/2017 high) . Expected to show continued decline.
In the long-term, we are waiting for further signs that the current downtrend is ending. Key supports stand at 0.6009 (31/10/2008 low) . A break of the key resistance at 0.8295 (15/01/2015 high) is needed to invalidate our long-term bearish view.
USD/CAD Short-Term Bullish Momentum Continues
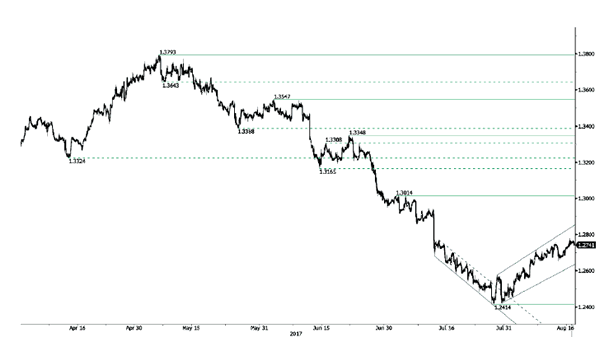
USD/CAD's short-term bullish momentum continues. The road is wide open for further increase. Hourly support is given at a distance at 1.2414 (27/07/2017 low). Expected to show continued increase.
In the longer term, the pair has broken longterm support that can be found at 1.2461 (16/03/2015 low) before bouncing back. Strong resistance is given at 1.4690 (22/01/2016 high). The pair should head further lower.
USD/CHF Testing Another Time Resistance At 0.9771
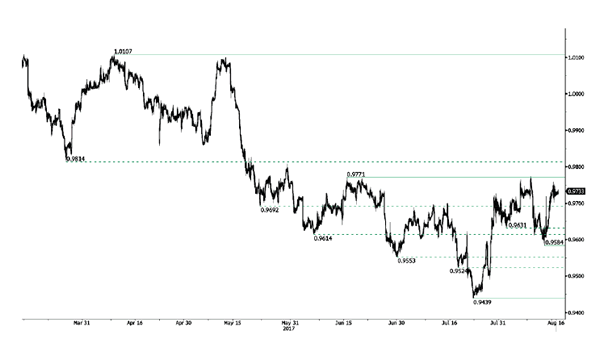
USD/CHF is pushing higher. Resistance is given at 0.9771 (15/06/2017 high). Hourly support lies at at 0.9584 (08/11/2017 low). Expected to to bounce back lower.
In the long-term, the pair is still trading in range since 2011 despite some turmoil when the SNB unpegged the CHF. Key support can be found 0.8986 (30/01/2015 low). The technical structure favours nonetheless a long term bullish bias since the unpeg in January 2015.
USD/JPY Strengthening
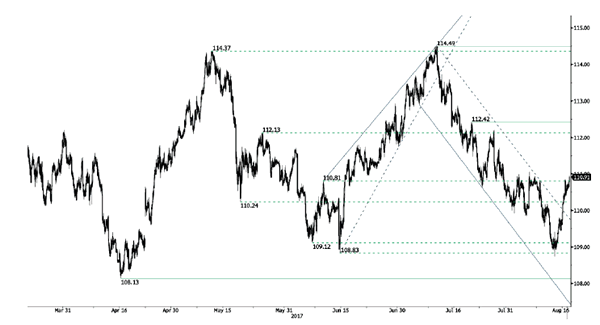
USD/JPY has exited short-term downtrend channel after the rebound at 108.83 (17/04/2017 low). Expected to show another leg higher.
We favor a long-term bearish bias. Support is now given at 96.57 (10/08/2013 low). A gradual rise towards the major resistance at 135.15 (01/02/2002 high) seems absolutely unlikely. Expected to decline further support at 93.79 (13/06/2013 low).
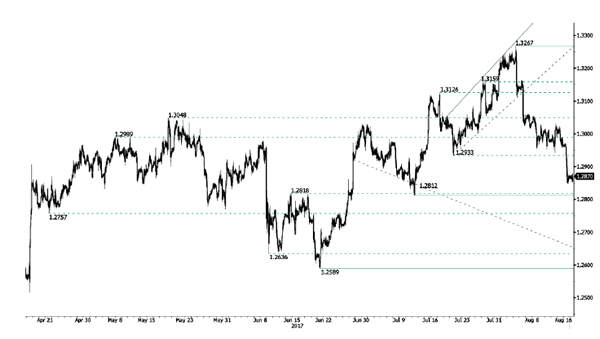
GBP/USD Breaking Support At 1.2933
GBP/USD is trading lower. Hourly resistance is given at 1.3267 (03/08/2017 high). Hourly support given at 1.2933 (20/07/2017 low) has been broken. Expected to show continued bearish pressures.
The long-term technical pattern is even more negative since the Brexit vote has paved the way for further decline. Long-term support given at 1.0520 (01/03/85) represents a decent target. Long-term resistance is given at 1.5018 (24/06/2015) and would indicate a long-term reversal in the negative trend. Yet, it is very unlikely at the moment.