Sample Category Title
EUR/USD Weakening
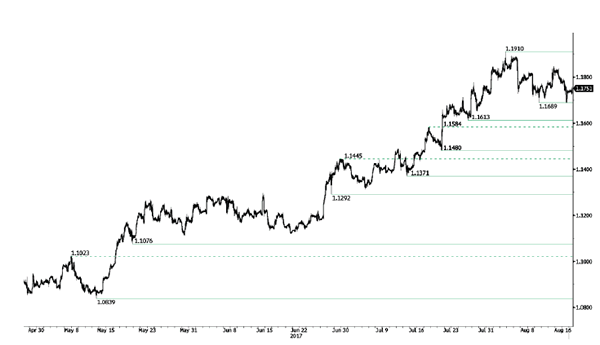
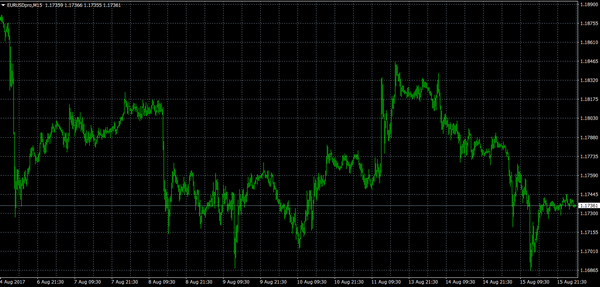
EUR/USD bearish pressures are on. Hourly resistance is given at 1.1910 (02/08/2017 high) while hourly support can be found at 1.1689 (09/08/2017 high). Stronger support lies at 1.1613 (26/07/2017 low). Expected to show further short-term selling pressures.
In the longer term, the momentum is now turning largely positive. We favour a continued bullish bias. Key resistance holding at 1.1871 (24/08/2015 high) has been broken while strong support lies at 1.0341 (03/01/2017 low).
USD Broadly Higher Ahead Of FOMC Minutes
Minutes to highlight divergence among Fed members
The solid print in retail sales and Empire Manufacturing Index yesterday helped the greenback to catch his breath. Retail sales advanced strongly in July, climbing 0.6%m/m (versus 0.3% expected), while previous month’s reading was revised to +0.3% (from -0.2% initially estimated). The core measure that excludes auto dealers and gasoline stations picked up 0.5%m/m following an upwardly revised figure of 0.3% in June. After a series of disappointing reports, it seems US consumer are finally ready to open their pockets. This acceleration a consumption is definitely of good omen for GDP growth as households consumption account for roughly 70% of the US economy and also to inflation. However, for the ladder, it will take a longer period to translate into firmer inflation reading.
The July FOMC minutes will be published later today and will likely show divergence, as usual, among Fed members. Last week, Bullard and Kashkari comments were quite dovish as they highlighted the persistent weak inflation pressures, while earlier this week Dudley appeared confident about the inflation outlook. Divergence, we told you. All in all, we believe that the minutes won’t be a game changer as the Fed will keep the surprise until September in order to have more flexibility.
The greenback extended gains this morning, rising the most against the Swiss franc, the Japanese yen and the euro. However commodity currencies and the pound sterling were edging higher, mostly due to positive local developments (strong wage growth in Australia, a pick-up in commodity prices and positive developments in the EU-UK relationship outlook).
EURCHF is heading higher but not for long
The Helvetic currency is suffering against the euro and the pair is back below 1.15. We nonetheless do not believe that the pair will continue to head towards 1.20 and the ongoing move may not be sustainable in the medium-term.
The fundamentals behind the recent surge of the single currency against the euro appears unclear. The economic and political situation have not changed during the summer. Yet we consider that this is only a catch-up as the euro strengthened against major G10 currencies on growing expectations of the Eurozone recovery. Markets now expect the ECB to narrow the monetary policy divergence with the Fed
European geopolitical tensions are also very calm during this summer. It is also important to remember that the massive Greek debt issue is far from solved and this will likely weigh again on the European Union unity.
Those basic reasons are our rationale on why downside pressures on the EURCHF pair are set to appear again. Markets definitely overestimate the Eurozone recovery.
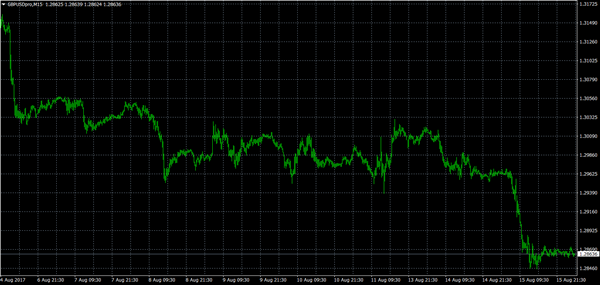
Trade Idea: GBP/USD – Sell at 1.2980
GBP/USD – 1.2903
Original strategy :
Sell at 1.2950, Target: 1.2800, Stop: 1.3010
Position: -
Target: -
Stop: -
New strategy :
Sell at 1.2980, Target: 1.2815, Stop: 1.3040
Position: -
Target: -
Stop:-
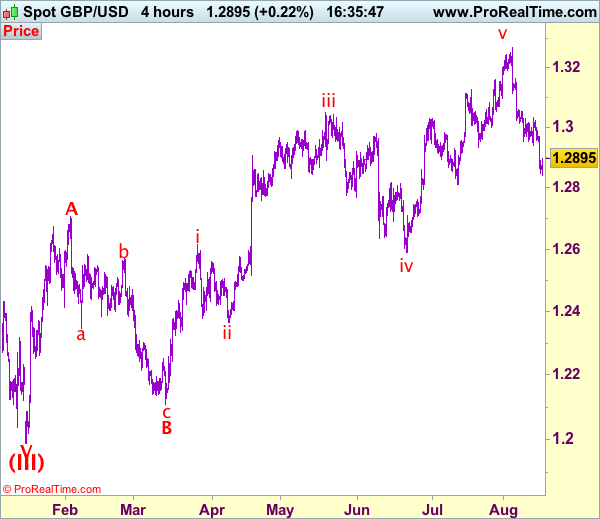
As cable has rebounded after intra-day initial marginal fall to 1.2842, suggesting consolidation above this level would be seen and corrective bounce to 1.2950 is likely, however, reckon upside would be limited to 1.2980-90 and bring another decline, below said support at 1.2842 would add credence to our view that the selloff from 1.3269 top is still in progress and bearishness remains for this move to bring correction of early upmove, hence further weakness to 1.2812 support would be seen but near term oversold condition should prevent sharp fall below 1.2800 and reckon 1.2740-50 would hold on first testing, bring rebound later.
In view of this, would not chase this fall here and would be prudent to sell cable on recovery as 1.2980-90 should limit upside, above resistance at 1.3032 would defer and suggest low is formed, risk a stronger rebound to 1.3059 and possibly towards 1.3100 but previous support at 1.3112 (now resistance) should remain intact, bring another decline.
Our preferred count on the daily chart is that cable's rebound from 1.3500 (wave (A) trough) is unfolding as a wave (B) with A ended at 1.7043, followed by triangle wave B and wave C as well as wave (B) has ended at 1.7192, the subsequent selloff is the larger degree wave (C) which is still unfolding with minor wave (III) of larger degree wave 3 ended at 1.1986, hence wave (IV) correction is in progress which could either be a triangle wave (IV) of a complex formation but upside should be limited to 1.3500 and price should falter well below 1.4000, bring another decline in wave (V) of 3 for weakness to 1.1500, then 1.1200.
US Dollar In Monstrous Uptrend Vs Canadian Dollar
Key Highlights
- The US Dollar after trading as low as 1.2413 on 26th July 2017 against the Canadian Dollar started an uptrend.
- There is a major ascending channel pattern with support at 1.2730 forming on the 4-hours chart of USD/CAD.
- The Net Long-Term TIC Flows for June 2017 released recently in the US posted $34.4B, more than the forecast of $28.3B.
- Today, the US Housing Starts Change for July 2017 will be released, which is forecasted to increase by 0.5%.
USDCAD Technical Analysis
August 2017 is turning out to be bullish for the US Dollar versus the Canadian dollar. The USD/CAD pair after forming a bottom near 1.2420 started an uptrend and currently trading above 1.2700.
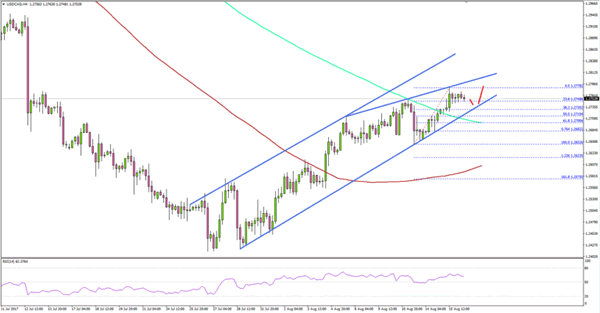
The upside move was steady, and during the rise there was a break above the 1.2600 resistance and the 100 simple moving average (H4). The pair is following a major ascending channel pattern with support at 1.2730 on the 4-hours chart.
On the upside, there is also a connecting resistance trend line positioned at 1.2780. It seems like a contracting triangle with resistance at 1.2780 is formed inside the channel.
On the downside, an initial support is around the 23.6% Fib retracement level of the last wave from the 1.2652 low to 1.2778 high.
To sum up, the pair is likely to remain in the uptrend and it may soon trade towards 1.2800 in the near term.
US Net Long-Term TIC Flows
Recently in the US, the Long-Term TIC Flows report for June 2017 was released by the US Department of Treasury. The market was looking for the Net Long-Term TIC Flows to be $28.3B, down from the last $91.9B.
The actual result was a touch above the forecast, as the Net Long-Term TIC Flows were $34.4B in June 2017. The total Net TIC Flows were $7.7B, down from the last revised reading of $54.7B.
The report pointed out that:
Foreign residents increased their holdings of long-term U.S. securities in June; net purchases were $35.3 billion. Net purchases by private foreign investors were $20.8 billion, while net purchases by foreign official institutions were $14.5 billion.
The market sentiment is mostly positive for the greenback, and USD/CAD is likely to gain traction for a run towards 1.2800.
Today’s US Housing Starts Change for July 2017 might impact the US Dollar. Any major rise in the Housing Starts in July 2017 could lift the bullish sentiment further for USD/CAD.
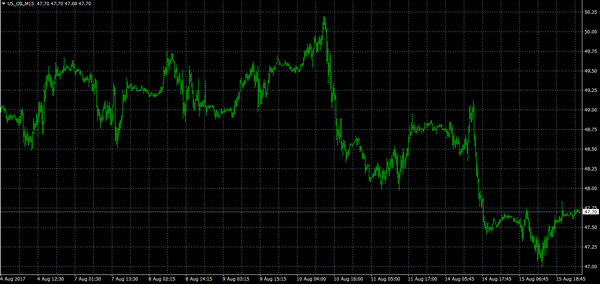
Dollar Torpedos Gold Whilst Oil Checks Its Inventory
Huge inventory draw saves crude's blushes as a stronger dollar twists the knife in gold's side.
The American Petroleum Institute (API) rode to oil's rescue overnight reporting a massive 9.2 million barrel drawdown in inventories against an expected 3.6 million barrels. Ahead of this number both Brent and WTI had been under heavy selling pressure from stale long positioning against a backdrop of falling China demand and increased OPEC and U.S. shale production.
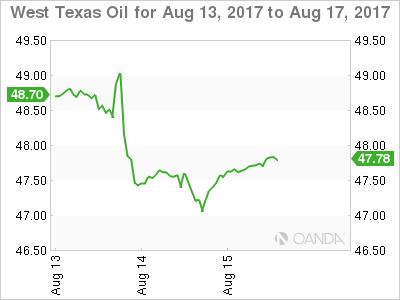
Both contracts rallied some two percent off their lows to close up around 0.50% on the day. The technical picture, however, differs slightly with WTI, in particular, most certainly not out of the woods.
Most notable is that the rally in WTI spot failed at its 100-day moving average at 47.85 with the contract limping along in early Asia just below at 47.65. A failure to regain this level today could imply more short-term pain ahead with the next meaningful support at 47.00 and then 46.20.
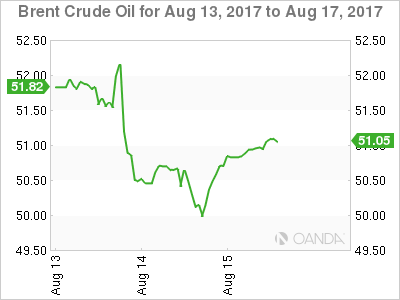
Brent spot painted a slightly rosier picture, breaking its 100-day moving average at 50.50 but rallying back to close comfortably above it at 50.90 in early Asia. Brent has nearby resistance at 51.00 with a double bottom at 49.90 now must hold support.
All eyes will now turn to tonight's official U.S. Crude Inventory report with the street hoping that it too follows the API figures and reports a significant drawdown. This would take the pressure of crude in the short term with a disappointing number seeing longs heading for the exit door en masse.
Gold
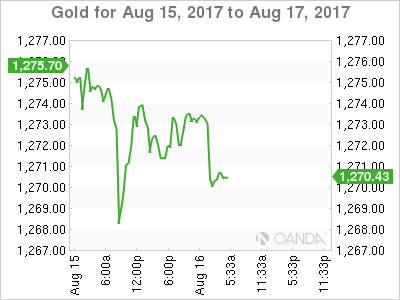
It was another tough night for gold as it fell 15 dollars to 1267.00 at one stage, before dusting itself off and climbing back to 1273 where it traded in early Asia. The good news hasn't lasted long however as gold has been under constant selling pressure in Asian time, falling to 1270.50.
The U.S. dollar at its highest levels in three weeks following hawkish Fed comments and decent retail sales data overnight. This saw U.S. bond yields rise across the curve which almost always torpedoes gold prices below the waterline. A perceived decline in North Korean tensions has temporarily removed the risk aversion premium loaded into recent gold pricing.
Gold has initial resistance just above present levels at 1274.20 followed by 1282.00 with support at the overnight low of 1267.00 and then 1260.00. The must hold level continues to be the 100-day moving average, today at 1255.00.
Trade Idea: GBP/JPY – Stand aside
GBP/JPY - 142.95
New strategy :
Stand aside
Position: -
Target: -
Stop:-
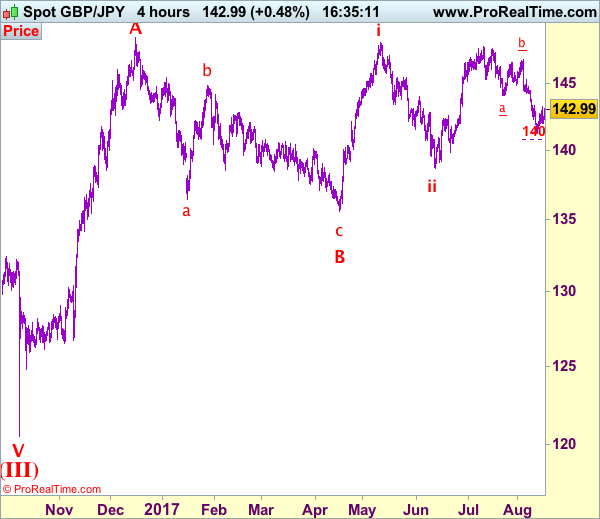
Sterling found support at 142.00 yesterday and has rebounded again, retaining our view that a temporary low has possibly been formed at 141.25 on Friday, hence further consolidation above this level would be seen and upside risk remains for another rebound to 143.35-40, break there would add credence to this view, bring retracement of recent decline to 144.00 (previous support turned resistance), however, reckon upside would be limited to 144.45-50 and 144.70 should hold, price should falter well below strong resistance at 145.30, bring another decline later.
On the downside, below indicated support at 141.95-00 would bring retest of said last week’s low at 141.25, however, break there is needed to revive bearishness and signal recent decline has resumed and extend weakness to 140.80-85 (1.618 times projection of 147.75-144.05 measuring from 146.80) but oversold condition should prevent sharp fall below 140.50 and reckon psychological support at 140.00 would hold from here. As near term outlook is mixed, would be prudent to stand aside for now.
Our preferred count is that larger degree wave V with circle is unfolding from 251.12 with wave (I) 219.34, (II): 241.38 and wave (III) is subdivided into 1: 192.60, 2: 215.89 (23 Jul 2008) and wave 3 ended at 118.87 earlier in 2009. The correction from there to 162.60 is wave 4 which itself is a double three and is labeled as first a-b-c ended at 151.53, followed by wave x at 139.03, 2nd a ended at 162.60, 2nd b at 146.75 and 2nd c leg of wave 4 ended at 163.00. Therefore, the decline from 163.00 to 116.85 is now treated as wave 5 which also marked the end of larger degree wave (III), hence wave (IV) major correction has commenced for retracement of the wave (III) from 241.38 and upside target at 183.95-00 (50% Fibonacci retracement of the wave (II) from 241.38) had been met, a drop below 160.00 would suggest wave (IV) has ended at 195.85, bring decline in wave (V) for initial weakness to 130 (already met) and 120.
EURJPY Risk To Upside Following Break Above 130, Medium-Term Structure Remains Neutral
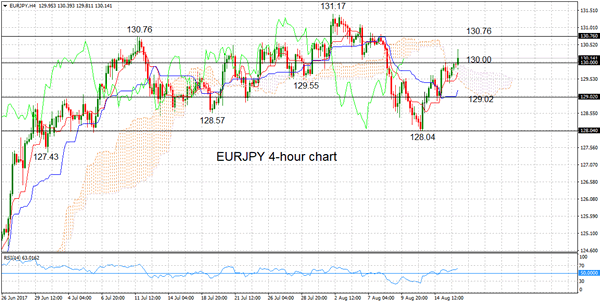
EURJPY has been in a neutral phase and has not shown a clear trend since early July. The pair has been oscillating around the key 130.00 level in a broad range between 128.00 and 131.00. Following a steep rise from the 124.00 area, prices rose to as high as 131.17 on August 2, a level not seen since early 2016.
Taking a closer look on the 4-hour chart, EURJPY has made a bullish run from the August 11 low of 128.04. After encountering strong resistance from the Ichimoku cloud and at the key 130.00 level, EURJPY managed to break above this level today. The next target is at 130.76, the July 11 high. From here, the multi-month high of 131.17 comes into view. From this point, the longer-term bullish trend would resume.
Otherwise, a drop back below 130.00 would expect support at 129.55 (July 31 low). The bottom of the Ichimoku cloud at 129.02 is another support area ahead of the August 11 low at 128.04. Below this, the medium-term outlook would shift from neutral to bearish. The intra-day bias remains to the upside, with RSI pointing up and having crossed above the 50 level into bullish territory.
Trade Idea: EUR/JPY – Buy at 129.45
EUR/JPY - 130.18
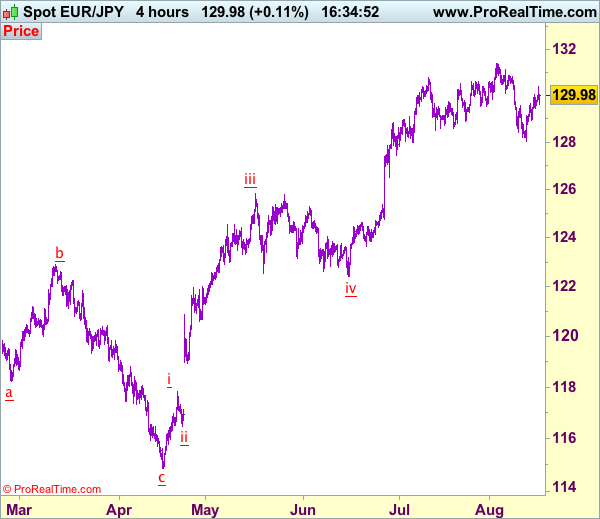
Recent wave: A 5-waver is unfolding from 114.85 with wave iii and iv ended at 125.82 and 122.40 respectively, wave v has possibly ended at 131.40.
Trend: Near term up
Original strategy:
Buy at 129.00, Target: 130.50, Stop: 128.40
Position: -
Target: -
Stop: -
New strategy :
Buy at 129.45, Target: 131.00, Stop: 128.85
Position: -
Target: -
Stop:-
As the single currency has maintained a firm undertone after staging a strong rebound from 128.05, adding credence to our view that at least the first leg of decline from 131.40 top has ended there and consolidation with mild upside bias is seen for further gain to 130.50, then towards 130.85-90, however, as broad outlook remains consolidative, upside would be limited and said resistance at 131.40 should remain intact, bring another retreat later this week.
In view of this, we are looking to turn long on dips as 129.40-50 should limit downside and bring another rebound. Below 128.90-95 would risk weakness to 128.50, then retest of Friday’s low at 128.05 but break there is needed to revive bearishness and signal the decline from 131.40 top is under way for retracement of early upmove to 127.50-60, then towards 127.00-10.
Our latest preferred count is that wave (ii) is ABC-X-ABC which ended at 123.33 and wave (iii) is unfolding with wave iii ended at 100.77, followed by wave iv at 111.57 and wave v as well as the wave (iii) has ended at 97.04, followed by wave (iv) at 111.43 and wave (v) has ended at 94.12 which is also the end of the larger degree v, this also implied the major wave (C) has also ended there, hence major correction has commenced from there with (A) leg unfolding in its lower degree wave c which has possibly ended at 145.69. Under this count, A-B-C wave (B) has commenced with A leg ended at 136.23, wave B at 143.79 and wave C has possibly ended at 149.79.
Our larger degree count is that the decline from 139.26 is wave (C) and is sub-divided into a diagonal triangle i-ii-iii-iv-v with wave i - 105.44, wave ii- 123.33, wave iii - 97.03, wave iv - 111.43, followed by the final wave v as well as the end of wave (C) at 94.12, this also mark the bottom of larger degree wave B. Under this count, major rise in wave C has commenced as an impulsive wave with minor wave III ended at 145.69, wave V is still in progress for further gain to 150.00. Having said that, this so-called wave V could well be the first leg of larger degree 5-waver wave C and this wave C should bring at least a retest of wave A top at 169.97 (July 2008).
Technical Outlook: USDJPY Attacks Strong 111.00 Resistance Zone, Looks For Further Upside On Strong Bullish Sentiment
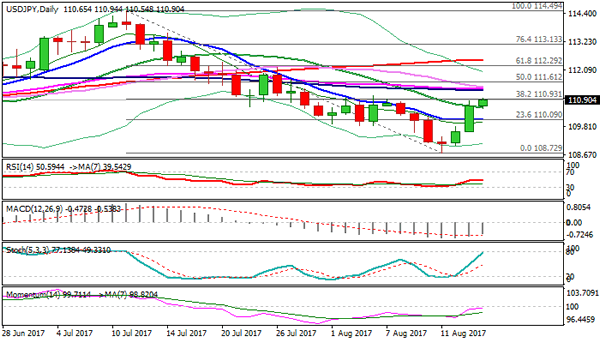
The pair remains supported and cracks the first barrier in 111.00 resistance zone (Fibo 38.2% of 114.59/108.72 downleg) and eyes next pivot at 111.04 (04 Aug high).
Upbeat US data and hawkish comments from Fed official boost hopes for Fed rate hike in Sep, supporting dollar's bullish sentiment in the near-term.
Sustained break above 111.00 pivot would open way towards a cluster of barriers above: converged 100/55SMA at 111.30, 30SMA at 111.40 and daily cloud base at 111.64.
Broken 20SMA now acts as initial support at 110.58, with psychological 110.00 support expected to contain extended dips.
Res: 111.04, 111.30, 111.40, 111.64
Sup: 110.58, 110.00, 109.80, 109.60
Markets Look To FOMC Minites For Direction
Monetary policy is back in focus on Wednesday, with the Federal Reserve scheduled to release the minutes of last month’s rate meeting. A deluge of economic data on both sides of the Atlantic will also drive market activity.
The economic data wire begins at 08:00 GMT with Italian gross domestic product (GDP). The Eurozone’s third largest economy expanded 0.4% in the second quarter and 1.4% annually, based on a median estimate of analysts.
A half hour later, the UK Office for National Statistics will release its latest batch of employment data for the months of June and July. The ILO-calculated unemployment rate for the three months prior to June will be presented. July claimant count data will also be made available.
The biggest data release of the session takes place at 09:00 GMT when the European Commission’s statistics branch reports on second quarter GDP. The euro area economy is forecast to grow 0.6% in the second quarter, confirming an earlier estimate.
The North American session features several notable releases, beginning at 12:30 GMT with monthly data on housing starts and building permits. Starts are forecast to climb 0.5% in July to a seasonally adjusted annual pace of 1.22 million units. Building permits, a proxy for future construction plans, are forecast to fall 2% to a 1.25 million-unit pace.
Energy traders will also be keeping an eye on the weekly crude inventory report from the US Energy Information Administration (EIA) at 14:30.
At 18:00 GMT, the US central bank will release the minutes of the July Federal Open Market Committee (FOMC) policy meeting. Although the Fed kept rates on hold last month, policymakers likely deliberated about how to wind down their $4.5 trillion balance sheet. Those discussions will be presented in the official transcript on Wednesday.
EUR/USD
The euro’s gradual downtrend continued on Tuesday, with prices briefly falling below 1.1700. The EUR/USD faces a critical support line at 1.1688, according to the analysts at Commerzbank. A fall below that key level could expose the pair to heavier losses. On the upside, firm resistance is seen at the August high near 1.1910.
GBP/USD
The British pound declined sharply on Tuesday, as the dollar rebounded against a basket of world currencies. After a 100-pip decline, the GBP/USD exchange rate is trading near seven-week lows, with immediate support located at 1.2830. On the opposite side of the ledger, resistance is likely found at 1.2910.
OIL
Crude prices rebounded on Wednesday, but remained under selling pressure following a series of volatile moves. US crude futures for September delivery were trading below $48.00 a barrel during Asian trade. The daily technical indicators remain bearish, with immediate resistance seen just above the $48.00 region.