Sample Category Title
Euro To Resume Uptrend Above 1.1800 Vs US Dollar?
Key Highlights
- The US Dollar after correcting towards the 1.1680 support against the US Dollar found support.
- The EUR/USD pair recovered recently and broke a bearish trend line at 1.1800 on the 4-hours chart.
- The pair bounced from the 100 SMA (H4) and now placed comfortably above 1.1750.
- China's Retail Sales for Jul 2017 (YoY) reported today posted an increase of 10.4%, less than the forecast of 10.8%.
EURUSD Technical Analysis
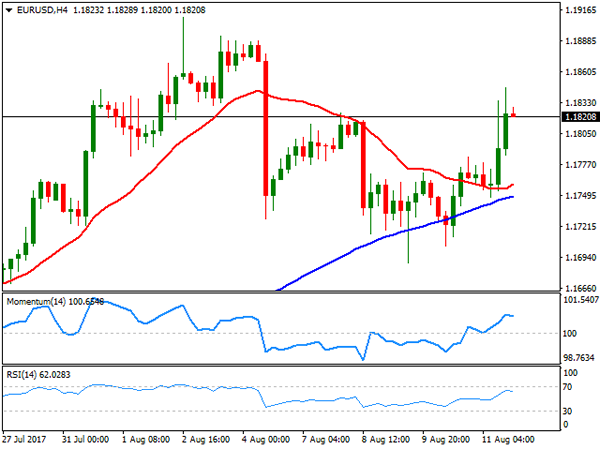
The Euro started a downtrend from 1.1910 against the US Dollar. The EUR/USD pair traded as low as 1.1688 and currently attempting to move back in the bullish zone.
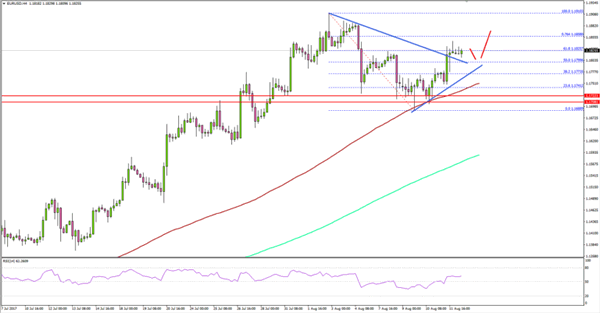
Looking at the 4-hours chart of EUR/USD, there is a crucial support near 1.1700-1.1680. It acted as a solid buy zone, and as a result, the pair bounced and recovered above 1.1750. Furthermore, the pair was rejected from the 100 simple moving average (H4) (1.1710).
The pair was able to move above a bearish trend line at 1.1800 on the 4-hours chart. Later, buyers took EUR/USD above the 50% Fib retracement level of the last decline from the 1.1910 high to 1.1688 low.
It is a strong bullish sign and could lift the market sentiment for the Euro, and EUR/USD might continue to move higher towards 1.1850 or 1.1880.
The H4 RSI is now above 50, currently positioned at 62 and moving higher, which is a positive sign.
China's Retail Sales
Recently in China, the Retail Sales report for July 2017 was released by the National Bureau of Statistics of China. The market was aligned for an increase of 10.8% in sales compared with the same month a year ago.
However, the actual result was a bit on the lower side, as there was an increase of 10.4% in sales. It was also less compared with the last 11%.
Furthermore, China's industrial output for July 2017 posted a growth of 6.4 percent on-year, down from the last +4.6%. And, the Fixed-asset investment was up by 8.3% (seven months figure) in 2017, which is less than the 8.6% increase in the first half of 2017.
The risk sentiment was dented after the release, and EUR/USD was down by roughly 20-30 pips. However, the pair remains supported on the downside near 1.1780.
Tensions Cool Down
A degree of risk-on sentiment returned to the markets, as the tensions between the US and North Korea appear to have “cooled” down. On Monday Japan's Q2 growth topped estimates, showing higher domestic demand. Japan's growth accelerated to a 4.0% annualized rate and, whilst inflation stays weak, it is not likely that the Bank of Japan will reign in its massive stimulus program any time soon.
China's economy posted its worst showing this year as curbs on property, excess borrowing and industrial overcapacity began to take hold. Chinese Factory output increased 6.4% from a year earlier, below the 7.1% forecast and against 7.6% in June. Retail sales slowed to 10.4 % from 11% in June.
In separate Sunday talk shows CIA Director Pompeo and National Security Advisor McMaster both commented that there was no indication that war will break out. However, markets will be on guard for any rhetoric from Trump or Kim Jong-un.
Last Friday's data showed US CPI edged up just 0.1% in July after it was unchanged in June. Many market participants had forecast CPI rising 0.2% in July. With weak inflationary pressure the FOMC will struggle to justify any further rate hikes, which will keep USD under pressure. This week, the markets will be focusing on US retail sales (Tuesday) and FOMC minutes (Wednesday).
EURUSD improved slightly over the weekend to currently trade around 1.1830.
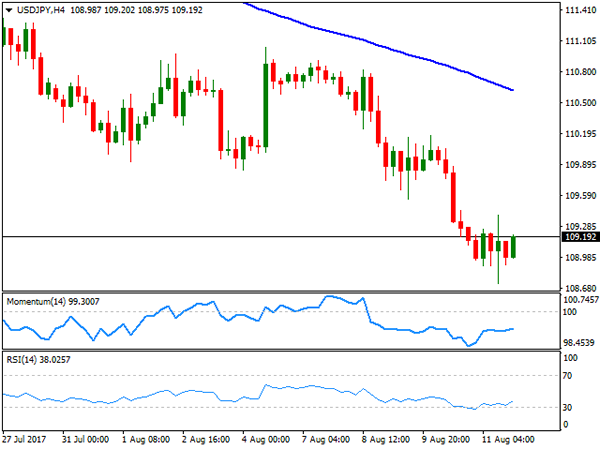
USDJPY showed little reaction to Q2 gross domestic product data, which revealed that the economy expanded for a 6th straight quarter led by private consumption and capital expenditure. Currently, USDJPY is trading around 109.50.
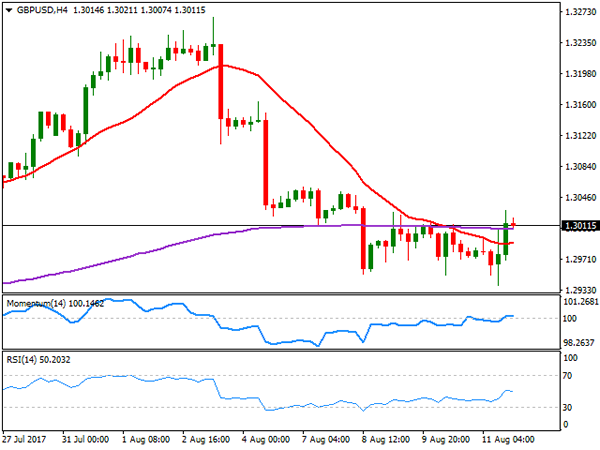
GBPUSD is little changed in early trading and currently trades around 1.3015.
Gold is down 0.25% in early trading, at around $1287.50, following last week's 2.4% gain on the week.
WTI, down 1.5% last week, is currently flat on the day, trading around $48.90pb.
A relatively “light” start to the week for economic data releases with the markets likely to focus on:
At 10:00 BST, Eurostat will release Eurozone Industrial Production Month-on-Month and Year-on-Year for June. The MoM consensus call for a disappointing consensus of -0.5% (prev. 1.3%) with the YoY consensus of 2.8% (prev. 4.0%). Such poor forecasts will underscore poor inflationary conditions, making any near-term hike in interest rates unlikely. The markets will also be concerned will further USD weakening in the current risk averse atmosphere.
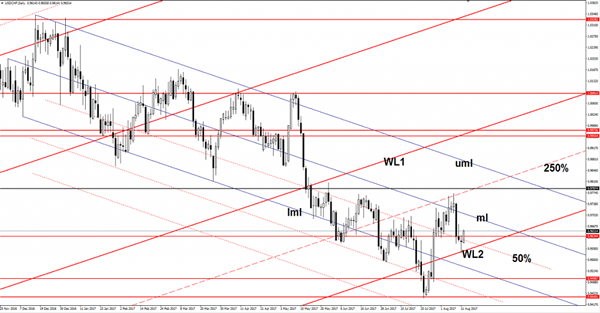
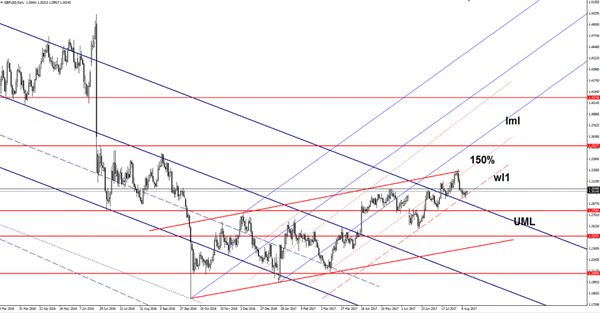
USD/CHF Is The Retreat Completed?
USD/CHF edges higher and is trading much above the 0.9634 and above the 50% Fibonacci line (descending dotted line). The next upside target will be at the median line (ml) of the minor descending pitchfork. A valid breakout will attract more buyers, which will drive the rate towards the upper median line (uml).
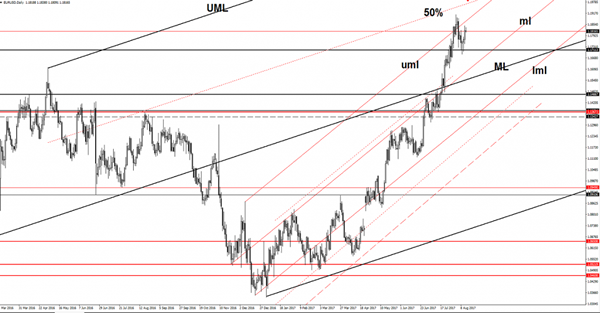
EUR/USD Struggling To Hold Ground
Price rebounded in the previous week and tries to reach and retest the upper median line (uml) of the minor ascending pitchfork, where he may find resistance again. A retest followed by a minor decrease will signal at drop at least towards the 1.1711 static support and towards the median line (ml) of the minor ascending pitchfork. The perspective is bullish as long as is trading above the median line (ml).
GBP/USD Setting Up For The Next Move
Price increased today and stays bullish until more sellers appear. GBP/USD could rebound as the USDX is still under selling pressure on the short term. USDX dropped in the last three days and is pressuring the 93.00 psychological level again.
The index could still come down to retest the 92.49 long term support in the upcoming days if the US data will come in mixed. Only a failure to reach the 92.49 support and the 92.55 previous low will signal a reversal.
The behavior will change if the rate will start to make higher lows, but needs a bullish spark from the United States economy to do that.
Is the retreat completed? This is the question right now, price retested the warning line (wl1) and now is fighting hard to rebound and to jump above the 1.3046 static resistance (support turned into resistance). Only a breakout above the static resistance will validate a further increase because a breakdown will become imminent if will stay too long on the warning line (wl1).
The perspective is bullish as long as the warning line (wl1) remains intact. You can notice that we had a false breakdown o Friday, signaling that the bulls are still in the game and could drive the price higher.
Remains to see what will happen because a retest of the 1.3046 level could signal a breakdown below the wl1. Support can be found at the UML as well and lower at the 1.2798 static support.
Stocks Recover As Geopolitical Tensions Ease, Safe Havens Plunging
After suffering the steepest weekly declines since March, S&P 500 futures are indicating a positive opening for U.S. stocks. Asian equities- ex-Japan, also climbed on the first trading day of the week, as tensions between Washington and Pyongyang eased throughout the weekend.
Last week, investors completely ignored data and were taking their cue from Trump's war of words with North Korea. Trump's threats of "fire and fury" and "locked and loaded" should North Korea launch a missile, were behind the 70% surge in the VIX, the selloff in equities and the flee into safe havens. Although the selloff was contained and losses didn't exceed 1.5% on U.S. major indices, investors increased cash allocations and hedged positions to protect their portfolios.
Statements on Sunday from CIA's Director, Mike Pomeo, and national security advisor H.R McMaster, helped to ease investors' fears. Both agreed that a military confrontation with North Korea was not imminent and the conflict is avoidable. The tension between the two countries is likely to fade after the sudden flare. However, given that tomorrow is North Korea's Liberation Day, investors will remain on the defensive as Pyongyang uses big events like this to make provocative statements, and possibly activities.
Gold fell slightly after surging to a two-month high of $1,291 on Friday. I believe that it's not only geopolitical tensions keeping gold prices elevated, it's also weak consumer prices from the U.S. Despite ticking higher in July, consumer prices are still 0.3% away from the Fed's inflation target of 2%. Fed officials are likely to become more cautious about tightening policy further in 2017, thus providing the precious metal with the support it needs. However, when looking at the chart, gold is making an interesting formation of a triple top. A break above $1,295 is required to prevent bears from sending prices back towards $1,200.
Another interesting commodity to watch is crude oil. When looking at recent price movements, it may look boring; Brent was stuck in a trading range of 51.18 – 53.64 for the past 12 trading days. However, prices for October contracts are higher compared to those due to deliver in the next six-months, in what is known as backwardation. If this move is not short lived, and prices don't move back to contango, it may indicate that markets are finally showing sign of rebalancing.
China disappointed today across all released economic data. Retail sales, fixed asset investments, and industrial production all missed market expectations. However, the numbers were not bad enough to cause a selloff in Chinese equities.
Today currency traders will have to take their cue from stocks and politics, with the economic calendar almost empty in the U.S. and U.K. Only industrial production numbers from Eurozone are due to be released.
Foreign Exchange Market Commentary: EUR/USD, USD/JPY, GBP/USD, GOLD, WTI CRUDE, DJIA, FTSE100, DAX
EUR/USD
After a soft start to the week, the EUR/USD pair ended it up at 1.1820, a fifth consecutive weekly gain as soft US inflation coupled with arising political jitters. On Friday, official data showed that US CPI rose a seasonally adjusted 0.1% in July, and by 1.7% when compared to July 2016, missing market's expectations. The core figures, those excluding volatile food and energy prices, were also below market's forecasts, denting the case for a hawkish Fed next September, and even putting into question a move in December. Earlier on the week, risk aversion dominated markets, with North Korea and the US menacing the other with a nuclear attack, limiting gains for the high yielding common currency, but also harming the greenback.
The dollar has little hopes of changing course during the upcoming week, and in fact, for the next month, until the ECB and Fed's monetary policy meetings next September. From a technical point of view, the downward potential is well-limited, given that in the daily chart, the price held above a bullish 20 SMA, despite a couple of attempts to break lower, while the Momentum indicator hovers within positive territory with a downward slope, but the RSI is already regaining the upside, currently at 65, somehow indicating further gains ahead. Shorter term, and according to the 4 hours chart, the upside is favored as the price settled above its 20 and 100 SMAs, while technical indicators hold within positive territory, easing the upward strength due to limited volumes at the end of the week, but far from suggesting a downward move ahead.
Support levels: 1.1780 1.1735 1.1690
Resistance levels: 1.1860 1.1910 1.1945
USD/JPY
The USD/JPY pair fell down to 108.72 on Friday, its lowest since mid April, to end the day pretty much flat at 109.19, having, however, set a lower low and a lower high daily basis, in line with the dominant bearish trend. Risk aversion backed the yen's rally, which appreciated alongside with government bonds, resulting in US Treasury yields falling to their lowest since late June. The 10-year note benchmark traded as low as 2.18%, to settle at 2.19%, while the 30-year note interest ended at 2.79%, unchanged for the day. Japan will release its Q2 preliminary GDP figures at the beginning of the week, with the economy expected to have grew by 0.6%, doubling Q1 0.3%. In the meantime, technical readings in the daily chart support a downward extension, as the Momentum indicator bounced modestly within bearish territory, whilst the RSI indicator consolidates around 31, and the price remains below its 100 and 200 SMAs. In the 4 hours chart, technical indicators have lost upward strength within negative territory and after correcting oversold conditions, whilst the price remains far below bearish moving averages. 108.80, June low, is the immediate support, with renewed selling pressure below it opening doors for a test of the year low at 108.12.
Support levels: 108.80 108.45 108.10
Resistance levels: 110.15 110.40 110.70
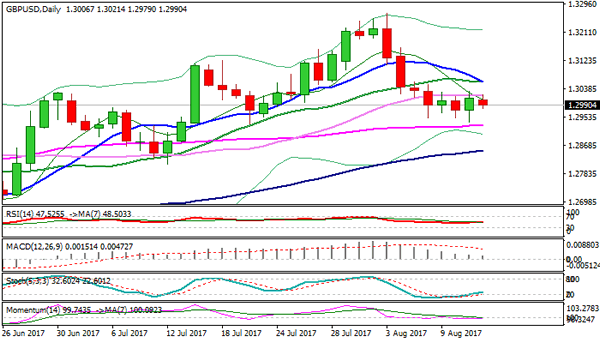
GBP/USD
The GBP/USD pair closed at 1.3011, down for a second consecutive week, on poor demand for high-yielding assets amid dominating risk aversion, and a batch of disappointing UK data released on Thursday. Despite recovering on Friday due to dismal US inflation data, the Pound remains the weakest currency across the board after the USD, undermined by decreasing hopes of a BOE rate hike this year, and mounting uncertainty surrounding Brexit. This Tuesday will be key for the Pound, as the kingdom will release its July inflation figures at all levels, with CPI, PPI and the retail price index being out. Market's expectations point for another flat reading monthly basis, but an uptick in yearly inflation, thus this last needs to be quite significant to bring a rate hike back to the table. The pair is poised to extend its decline according to the daily chart, as the pair remains below its 20 SMA, while technical indicators hold within negative territory, although with limited downward strength. In the 4 hours chart, the pair settled above its 20 SMA, and around the 200 EMA, while technical indicators lack directional strength within neutral territory, indicating a limited upward potential. The pair topped for the week at 1.3030, the immediate resistance, but it would take an advance beyond 1.3060 to revert, at least short-term, the negative stance.
Support levels: 1.2985 1.2950 1.2910
Resistance levels: 1.3030 1.3060 1.3095
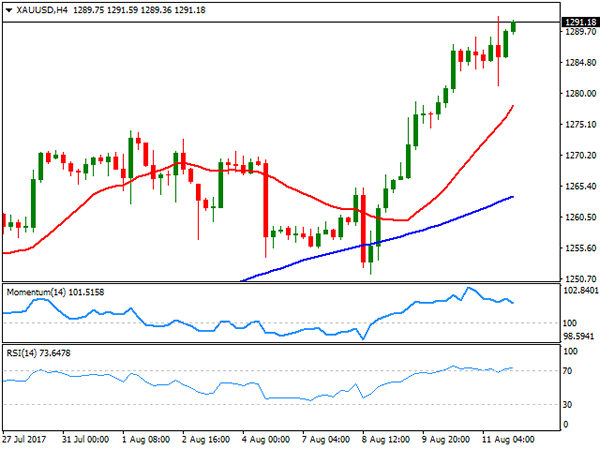
GOLD
Spot gold settled at its highest in two months, ending Friday at $1,291.18 a troy ounce, boosted by the ongoing risk sentiment triggered by tensions between the US and North Korea. Base metals, particularly those considered safe-havens, benefited the most, as usual on times of fear, also helped by plummeting equities, and soft US inflation figures. By the end of the week, the US released its July PPI and CPI data, all of which came below expected, putting into question Fed's ability to maintain its tightening pace. The rally may continue this week, as the macroeconomic background has little chances of changing. The daily chart shows that the price soared above all of its moving averages, with the 20 SMA accelerating north above its 100 SMA, the Momentum indicator easing within positive territory, and the RSI maintaining its bullish slope around 73. In the 4 hours chart, the Momentum indicator diverges lower, retreating from extreme overbought levels, but the price posts higher highs above all of its moving averages, whilst the RSI indicator remains firm above 70, suggesting that the commodity may extend its advance further, particularly on a break above 1,295.56, this year high.
Support levels: 1,283.60 1,274.10 1,266.20
Resistance levels: 1,295.60 1,303.10 1,311.80
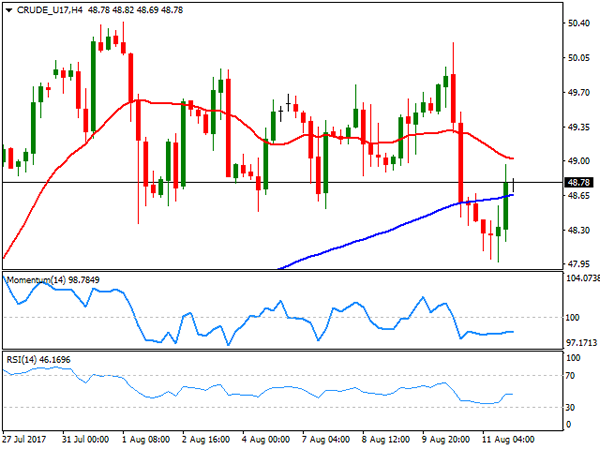
WTI CRUDE OIL
West Texas Intermediate crude oil prices fell down to 47.97 on Friday, recovering afterwards to end the day at $48.78 a barrel, anyway down for the week roughly 1.5%. News that the OPEC has increased its output during July, despite the late 2016 pact to reduce it, weighed on the commodity this past week, but signs that US production has stabilized let off some steam over the oil market. According to data released on Friday, the number of US active rigs drilling for oil climbed by three to 768 this past week, after rising by just one on the previous one. From a technical point of view, the daily chat shows that WTI established a few cents above its 20 DMA, but also that technical indicators have settled around their mid-lines, lacking directional strength. In the 4 hours chart, the price is below a bearish 20 SMA, while technical indicators stand pat within negative territory, limiting chances of a sharp recovery for the upcoming sessions.
Support levels: 48.50 47.90 47.20
Resistance levels: 49.65 50.20 50.70
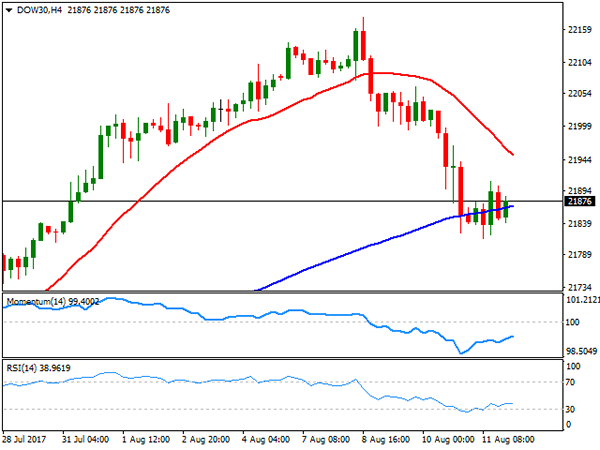
DJIA
Wall Street managed to end Friday with modest gains, with the Dow Jones Industrial Average up 14 points, to end at 21,858.32, and the S&P adding 3 points, to 2,441.32. The Nasdaq Composite was the best performer, adding 39 points or 0.64%, to end at 6,256.56, as tech equities led the way higher. After falling on risk aversion for three consecutive days, US indexes recovered modestly during the last trading day of the week, as soft US inflation figures dented the case for another rate hike this year. Microsoft was the best performer within the Dow, up 1.53%, followed by Cisco Systems that added 1.52%. Travelers was the worst performer, down 1.16%, followed by Exxon Mobil that shed 0.96%. Down 1.1% on the week, the DJIA daily chart shows that the index settled around its 20 DMA, pressuring the indicator for a second consecutive day, while technical indicators retreated further from extreme overbought levels, but hold within positive territory. In the 4 hours chart, the index hovers around its 100 SMA, well below a strongly bearish 20 SMA and with technical indicators having bounced from oversold levels, but stabilizing within negative territory, maintaining the risk towards the downside.
Support levels: 21,843 21,808 21,760
Resistance levels: 21,909 21,941 21,992
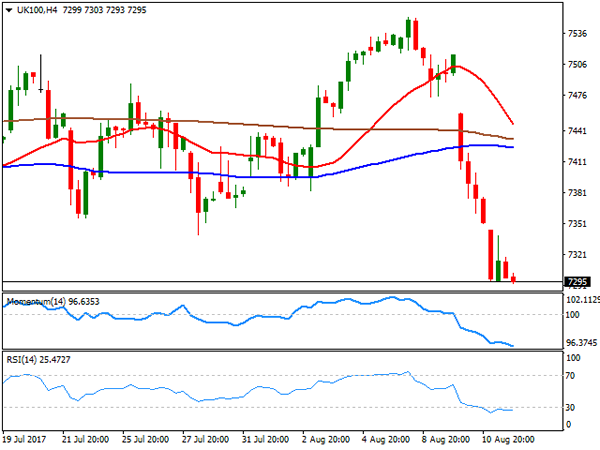
FTSE100
The FTSE 100 posted its lowest settlement in three months on Friday, down on the day 1.08% or 79 points, to 7,309.96. Mining-related equities led the way lower by the end of the week, hit by news coming from China, as the local Iron and Steel Association warned that rising prices were “not driven by market demand or reduced market supply” but speculative, adding that it may not be sustainable in time. Among advancers, Smurfit Kappa was the best performer, up by 1.74%, followed by Persimmon which added 1.58%. Standard Life on the other hand was the worst performer, down 3.75%, followed by Rio Tinto that shed 3.15%. The Footsie had its worst week in nearly four months, and the daily chart suggests that the slide may continue this week, as technical indicators continue heading south within negative territory, while the index settled far below its 20 and 100 DMAs. In the 4 hours chart the bearish momentum remains strong, as technical indicators maintain their downward potential within oversold territory, whilst the 20 SMA turned sharply lower far above the current level.
Support levels: 7,284 7,253 7,226
Resistance levels: 7,318 7,345 7,377
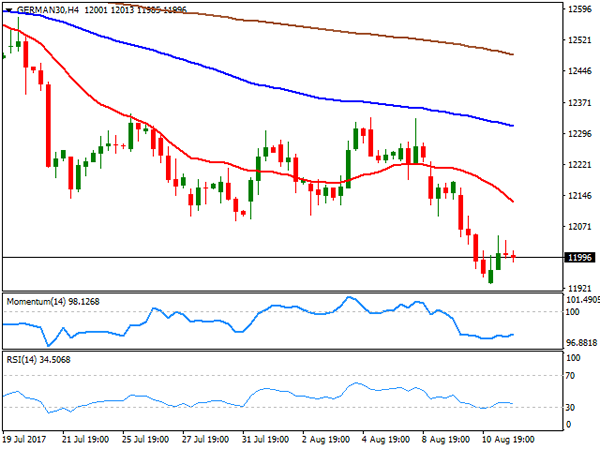
DAX
The German DAX managed to close unchanged on Friday at 12,014.06, although most European indexes closed lower, undermined by falling banks equities. The index closed the week deeply on the red as risk sentiment sent investors away from high yielding assets ever since the week started. Most members were up on Friday with Fresenius leading the way higher, up 1.83%, followed by Merck that added 1.79%. Commerzbank led decliners, down 0.94%, followed by Vonovia that lost 0.72%. The pair fell down to 11,933 by the end of the week, level last seen in March, and just a few points above a still bullish 200 DMA. In the same chart, however, the 20 DMA maintains a sharp bearish slope above the current level, while technical indicators hold within negative territory, in line with further slides ahead. In the 4 hours chart, the bearish tone is even stronger, with the 20 SMA accelerating south well above the current level, and technical indicators consolidating near oversold territory, with no signs of a possible recovery ahead.
Support levels: 11,985 11,933 11,874
Resistance levels: 12,048 12,097 12,146
Japanese Data Injects Life | Dollar Bearish Bets At Record High Since 2013 | Sterling And Oil Struggles
Japan Overwhelms While China Underwhelms
Global Arena Looks At Trump Temper
Bearish Bets At A Record Level Since 2013
No Hope For Sterling Bounce
Oil Lower After OPEC Supply Spikes
Japan Overwhelms While China Underwhelms
Investors in Europe are tracking the gains over in Asia and they are more optimistic due to the strong Q2 GDP data out of the Japanese economy. The Japanese economy grew at an annualised rate of 4 percent during the second quarter. The number is really encouraging if we compare this to the country's performance of the last year. However, not all economic data out of Asia was stellar. The Chinese factory output number fell short of consensus with a reading of 6.4%. The Chinese retail sales number was also underwhelming and missed the forecast of 10.8 percent. The number came in at 10.4%.
Global Arena Looks At Trump Temper
On the global stage, it is the strong rhetoric of the US which is going to keep investors jittery. North Korea is known for making foolish statements and this isn't new for investors. On the contrary, it is President Trump's statements like 'fire and fury' which traders are incapable to digest. The volatility index has shown that traders would like to take a full leverage of the lower insurance policy to hedge their risk. Although, the premium of the insurance policy in this instance, the price of the VIX index, has moved up substantially. In fact, last week, the index had the biggest weekly advance (5.48%) since November 4.
Bearish Bets At A Record Level Since 2013
Speculators are still out for blood when it comes to the dollar. Hedge funds are piling on big bets as they do see the price of the dollar index still moving lower. The economic data is persistently weakening and this lays down the foundation for their thesis to go short on the dollar. The US core CPI number was vile. The inflation has deteriorated further and the question is for how long can you still say that it is transitory only? Traders are not buying this ideology and they want the Fed to hold on to their next roll of dice. The FOMC minutes may not still change (which are due later this week) and a fail to acknowledge the fact that the inflation issues are something which deserves attention rather than a label of transitory, could make the dollar more vulnerable. However, before we get to the latest flavour of the FOMC minutes, investors will have the US retail sales data to chew first (due on Tuesday). Natural wisdom will ask for more improvement in the July figure as the US wages have shown some strength but a failure of this message would mean more trouble for the dollar bulls.
No Hope For Sterling Bounce
Brexit is going to come back under the spotlight towards the end of this month when both sides will look to make more progress. The three major thorny points: Brexit bill, rights for EU- and British citizens and no border between Ireland and the U.K. would make traders nervous. The solution is not easy and both sides are not going to change their stance. Stubbornness would only create more volatility and odds would skew for more downward pressure for the Sterling especially against the Euro.
The daily chart of the sterling-dollar pair is looking much weaker because we are making lower lows and lower highs which confirm the bulls are not convinced that the price could move up. In order for us to have a clearer indication of bull strength, we need the price to break the high of 1.3164 (Aug 4th high)
Oil Lower After OPEC Supply Spikes
The oil price is struggling to remain in the positive territory. Traders would like to have a firm signal which would suggest that the oil market is balanced and there is no more supply glut. The demand continues to grow however it still requires more help before it can outstrip the supply. The IEA report established that the fundamentals are shifting which would continue to stem the bullish sentiment, however, the revision by the agency from 1.4 million barrels per day to 1.5 million barrels is not ground breaking.
If you look at the supply equation, Nigeria and Libya are continuously adding to the top line number for the OPEC production. The figure augmented by 173K barrels in July and the total production of 32.9 marked the highest number since the production cut agreement. It is something which traders are going to keep a close eye on because it makes the compliance issue immensely sensitive.
Technical Outlook: GBPUSD Unable To Clearly Break Above 1.3000, Eyes UK Data For Fresh Signals
Cable remains within around 100-pips congestion in the near-term and so far unable clearly break above psychological 1.3000 barrier (Friday's spike to 1.3031 and close marginally above 1.3000 on weak US data, proved short-lived). Strong barriers at 1.3040 (daily Kijun-sen) and 1.3064 (Fibo 38.2% of 1.3268/1.2939 downleg/formation of 10/20SMA bear-cross) stay out of reach for now and weigh on near-term action. Mixed technical studies on daily chart see no clear direction in the near-term, with violation of pivotal points at 1.3064 of 1.2930 needed for stronger signal. Release of UK inflation data on Tuesday (2.7% f/c for July vs 2.6% in June) and UK jobs data on Wednesday could provide stronger signals.
Res: 1.3020, 1.3031, 1.3064, 1.3103
Sup: 1.2979, 1.2951, 1.2930, 1.2900
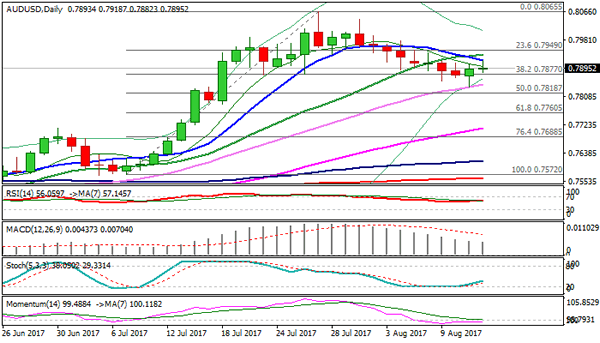
Technical Outlook: Aussie Dips After Weak Chinese Data
The Aussie dollar dipped to the session low at 0.7882 in early European trading after recovery attempts in Asia were capped by daily Tenkan-sen at 0.7918.
Weaker than expected Chinese data released overnight weigh and may pressure the Aussie further, despite bullish signal, generated on rejection of pullback from 0.8065 peak (correction was so far contained by rising 30SMA at 0.7838) and reversal of slow stochastic on daily chart.
The downside is expected to remain at risk while recovery attempts stay capped under pivotal 0.7918/25 barriers (daily Tenkan-sen / Fibo 38.2% of 0.8065/0.7838 downleg).
Firm break here needed to open way for fresh upside action and signal an end of corrective phase from 0.8065.
Conversely, violation of last Friday’s correction low at 0.7838 and daily Kijun-sen at 0.7825 would risk fresh extension of correction from 0.8065 and expose supports at 0.7818/0.7760.
Res: 0.7925, 0.7952, 0.7978, 0.8000
Sup: 0.7882, 0.7838, 0.7818, 0.7760