Sample Category Title
Swiss Franc Trading Lower In The Morning Session
For the 24 hours to 23:00 GMT, the USD declined 0.08% against the CHF and closed at 0.9614 on Friday.
In the Asian session, at GMT0300, the pair is trading at 0.9636, with the USD trading 0.23% higher against the CHF from Friday’s close.
The pair is expected to find support at 0.96, and a fall through could take it to the next support level of 0.9565. The pair is expected to find its first resistance at 0.9655, and a rise through could take it to the next resistance level of 0.9675.
The currency pair is trading above its 20 Hr moving average and showing convergence with its 50 Hr moving average.

Loonie Extends Its Gains In The Morning Session
For the 24 hours to 23:00 GMT, the USD declined 0.46% against the CAD and closed at 1.2684 on Friday.
In the Asian session, at GMT0300, the pair is trading at 1.2677, with the USD trading 0.06% lower against the CAD from Friday’s close.
The pair is expected to find support at 1.2636, and a fall through could take it to the next support level of 1.2594. The pair is expected to find its first resistance at 1.2736, and a rise through could take it to the next resistance level of 1.2794.
Ahead in the day, investors will look forward to Canada’s Teranet/National Bank house price index for July.
The currency pair is trading below its 20 Hr and 50 Hr moving averages.

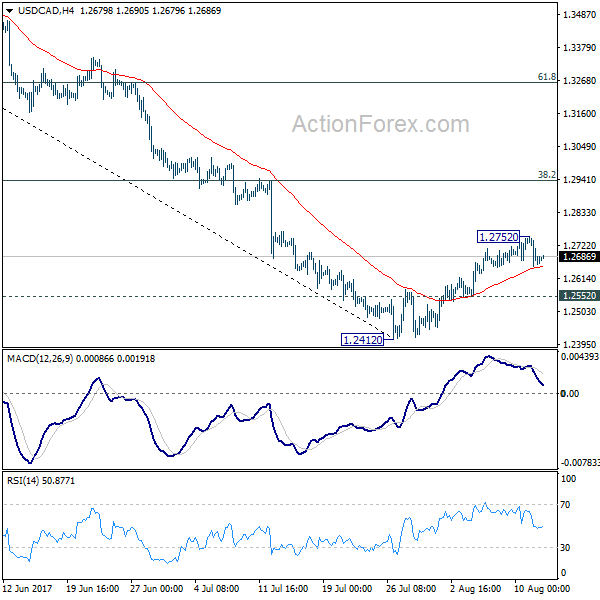
USD/CAD Daily Outlook
Daily Pivots: (S1) 1.2636; (P) 1.2694; (R1) 1.2737; More....
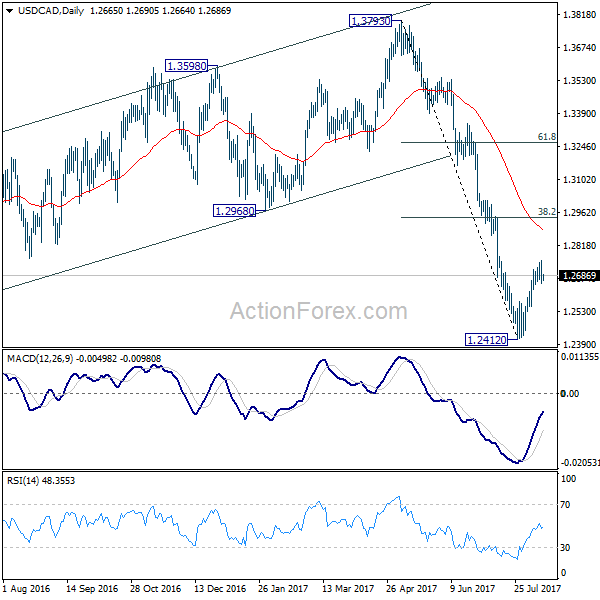
Intraday bias in USD/CAD remains neutral for the moment. The corrective rise from 1.2412 might still extend higher. But based on current momentum, upside should be limited by 38.2% retracement of 1.3793 to 1.2412 at 1.2940 to bring fall resumption. On the downside, below 1.2552 minor support will argue that the recovery is completed and turn bias back to the downside for retesting 1.2412.
In the bigger picture, price actions from 1.4689 medium term top are seen as a correction pattern. Such corrective fall is still expected to extend to 50% retracement of 0.9406 to 1.4869 at 1.2048. At this point, we'd look for strong support from there to contain downside and bring rebound. Nonetheless, on the upside, sustained break of 1.2968, 38.2% retracement of 1.3793 to 1.2412 at 1.2940 will be the first sign of completion of the correction and will turn focus back to 1.3793 key resistance.
Trade Idea : USD/JPY – Sell at 110.10
USD/JPY - 109.58
Most recent candlesticks pattern : N/A
Trend : Near term down
Tenkan-Sen level : 109.37
Kijun-Sen level : 109.19
Ichimoku cloud top : 109.55
Ichimoku cloud bottom : 109.28
Original strategy :
Sell at 109.70, Target: 108.70, Stop: 110.05
Position : -
Target : -
Stop : -
New strategy :
Sell at 110.10, Target: 109.10, Stop: 110.45
Position : -
Target : -
Stop : -
As the greenback has staged a strong rebound after Friday’s brief fall to 108.73, suggesting a temporary low has been formed there and consolidation with mild upside bias is seen for retracement of recent decline to 109.80, however, reckon upside would be limited to resistance at 110.18 and bring retreat later, below 109.00 would signal the rebound from 108.73 has ended, bring retest of this level, break there would extend recent decline to 108.50 but previous chart support at 108.13 should remain intact.
In view of this, we are inclined to sell dollar on further subsequent rebound as resistance at 110.18 should cap upside. Above previous support at 110.25 would risk a stronger corrective rise to 110.50 but still reckon upside would be limited and resistance at 110.83 should remain intact, bring another selloff.

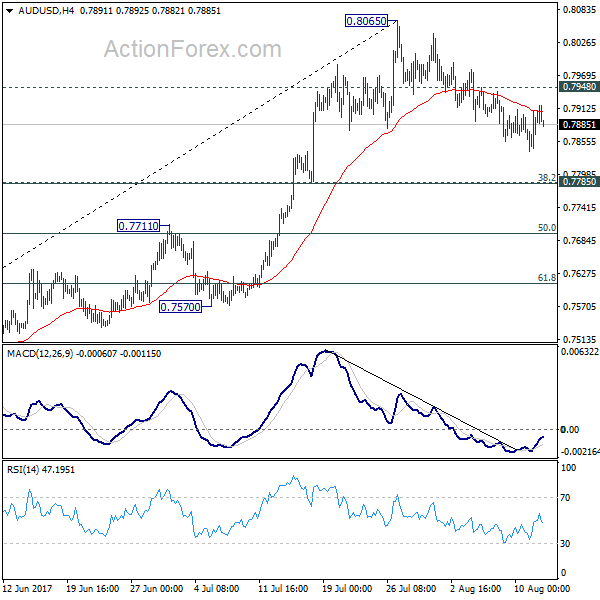
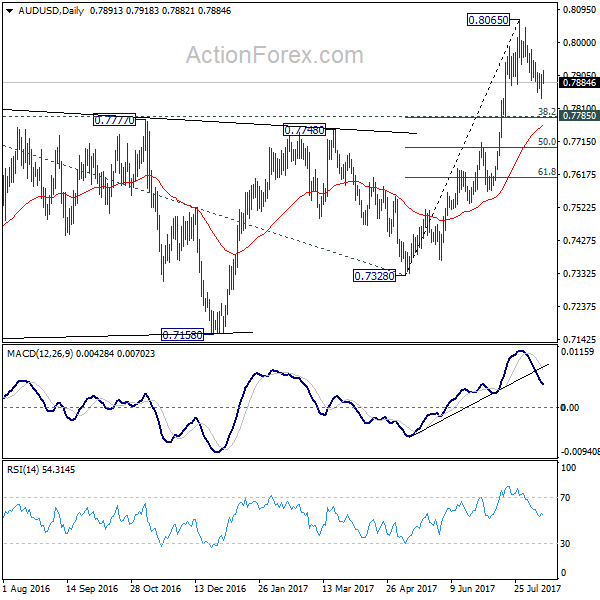
AUD/USD Daily Outlook
Daily Pivots: (S1) 0.7850; (P) 0.7879; (R1) 0.7920; More...
With 0.7948 minor resistance intact, deeper decline could still be seen in AUD/USD. But we'd expect strong support from 0.7785 cluster support (38.2% retracement of 0.7328 to 0.8065 at 0.7783) to contain downside and bring rebound. On the upside, break of 0.7948 will argue that the pull back is completed. In such case, intraday bias will be turned back to the upside for retesting 0.8065.
In the bigger picture, rise from 0.6826 medium term bottom is still in progress. At this point, there is no confirmation of trend reversal yet and we'll continue to treat such rebound as a corrective pattern. But in any case, break of 55 month EMA (now at 0.8100) will target 38.2% retracement of 1.1079 to 0.6826 at 0.8451. Break of 0.7328 support is needed to confirm completion of the rebound. Otherwise, further rise is now expected.
FOMC’s Song Drowned By Don And Kim
The FOMC may be this week's data highlight, but it is the Kim and Trump show that will keep energy and precious metals on edge.
Crude Oil
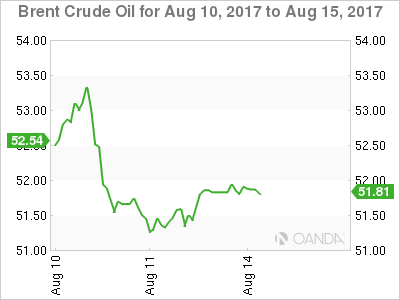
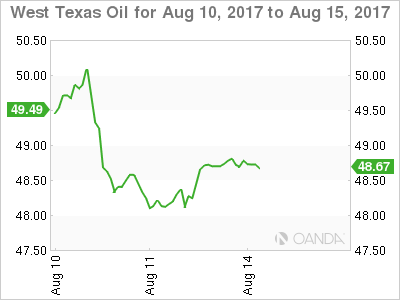
Both Brent and WTI survived further selling pressure on Friday to make back all their losses and close near the highs of the day and ekk out higher finishes, up 20 cents and 40 cents respectively. The Baker Hughes Rig Count, released late Friday, showed a small drop surprisingly and this seems to have given both contracts a bid tone as they start the day at 51.95 and 48.80.
Data wise the highlights will be the usual crude inventories with traders closely watching the shapes of the oil futures curves as both race towards backwardation from years of contango, implying that finally, the market is seeing the light at the end of the oil supply tunnel.
The FOMC minutes may play its part, but oil moves will more likely be vulnerable to sabre-rattling headlines between the U.S. and North Korea. Given the positive start to the week an escalation in tensions should see oil prices firm as opposed to the counterintuitive moves lower of last week which we believe was caused by extended short term long positions.
Brent spot tested its 200-day moving average on Friday at 51.55 but closed above, and this forms intra-day support. This is followed by 51.00 and then the critical 50.55 regions. Home to the 100-day average and 50% Fibonacci retracement. Initial resistance is at Friday's high of 52.10 followed by the much more significant 52.70 level.
WTI spot bounced from its 100-day moving average at 47.85 on Friday to settle just below its 200-day average at 49.15. These two levels will set the range in initial trading in Asia today.
GOLD
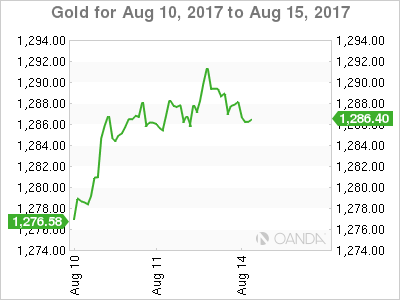
Gold has traded down to 1286.00 this morning from its positive 1290.00 close as traders take of weekend risk hedges in early Asia. Geopolitical risk will continue to be the dominant theme this week with gold sensitive to any escalation in tensions vis-a-vis the Korean peninsula. It remains our base case that the United States options are very limited militarily regarding North Korea and the likelihood of them firing the first shot very unlikely. The same cannot be said of the other side although again we regard the chances as very low.
That said, there is no reason why the respective chest thumping cannot get louder, and this should ensure that gold is bid on any significant dips this week. Wednesday's FOMC minutes may also continue to boost gold if it appears that the Federal Reserve is continuing to blink on potential further U.S. rate hikes.
Gold has support at 1282.00 initially followed by 1274.20. All eyes, however, will be on the 1295.00/1296.00 region which has capped gold this year. From a technical perspective, a daily close and consolidation above this region would be a very bullish development and imply that a 1300 handle on gold prices may not be far away. It may, however, require some more action from the Korean peninsula to get us there this week
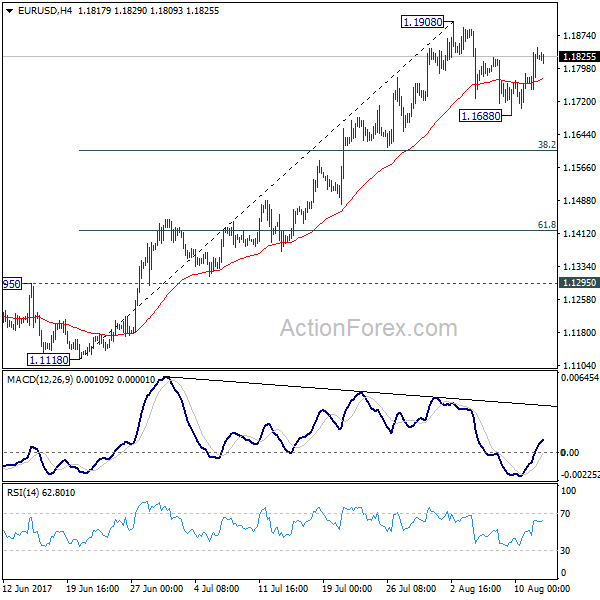
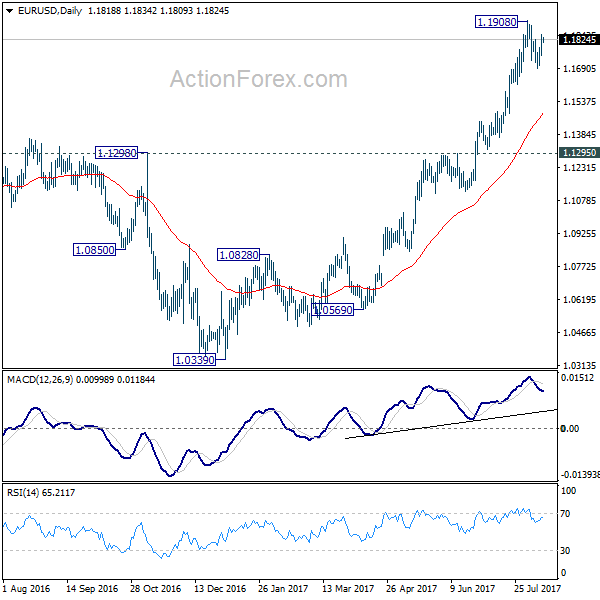
EUR/USD Daily Outlook
Daily Pivots: (S1) 1.1763; (P) 1.1805 (R1) 1.1862; More...
Intraday bias in EUR/USD remains neutral for the moment. With 1.1908 resistance intact, more consolidation could be seen first. In case of another fall, downside should be contained by 38.2% retracement of 1.1119 to 1.1908 at 1.1606 to bring rebound. On the upside, break of 1.1908 will extend recent up trend to 1.2042 long term support turned resistance next.
In the bigger picture, an important bottom was formed at 1.0339 on bullish convergence condition in weekly MACD. Sustained trading above 55 month EMA (now at 1.1768) will pave the way to key fibonacci level at 38.2% retracement of 1.6039 (2008 high) to 1.0339 (2017 low) at 1.2516. While rise from 1.0339 is strong, there is no confirmation that it's developing into a long term up trend yet. Hence, we'll be cautious on strong resistance from 1.2516 to limit upside. But for now, medium term outlook will remain bullish as long as 1.1295 support holds, in case of pull back.
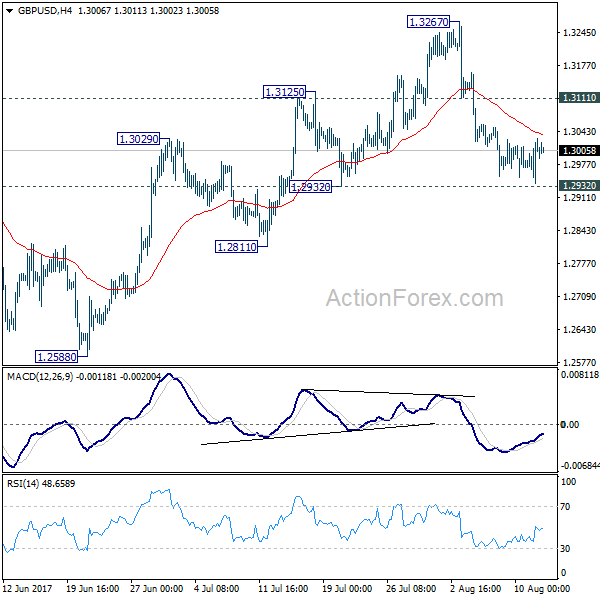
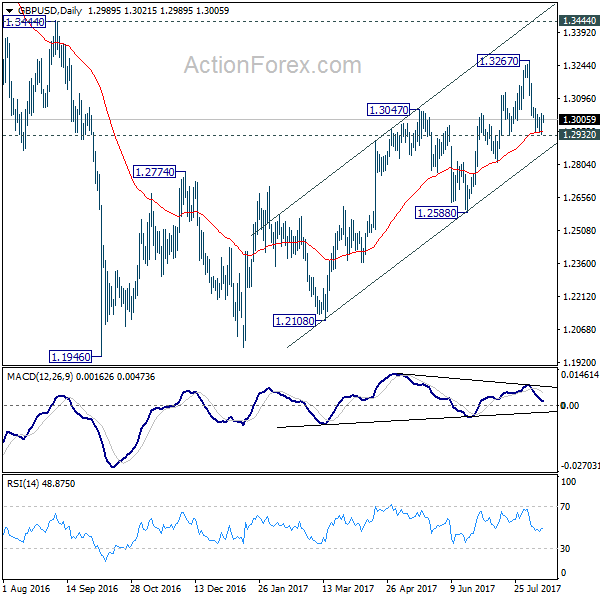
GBP/USD Daily Outlook
Daily Pivots: (S1) 1.2953; (P) 1.2992; (R1) 1.3045; More...
GBP/USD stabilized ahead of 1.2932 support and intraday bias is turned neutral first. Near term outlook remains bearish with 1.3111 resistance intact and deeper decline is expected. As noted before, price actions from 1.1946 are seen as a corrective pattern and could have completed at 1.3267. Break of 1.2932 will affirm this bearish case and target 1.2588 key near term support for confirmation. However, break of 1.3111 resistance will turn bias back to the upside for retesting 1.3267 high instead.
In the bigger picture, overall, price actions from 1.1946 medium term low are seen as a corrective pattern. While further rise cannot be ruled out, larger outlook remains bearish as long as 1.3444 key resistance holds. Down trend from 1.7190 (2014 high) is expected to resume later after the correction completes. And break of 1.2588 will indicate that such down trend is resuming.
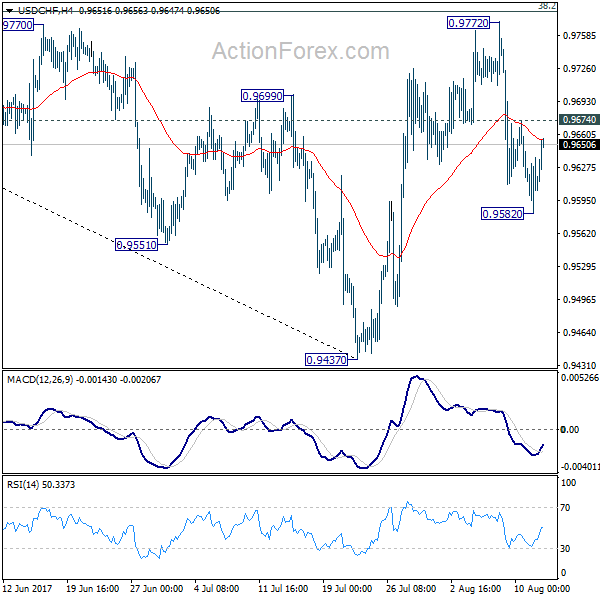
USD/CHF Daily Outlook
Daily Pivots: (S1) 0.9585; (P) 0.9611; (R1) 0.9641; More...
Intraday bias in USD/CHF remains neutral for the moment. Near term outlook is a bit mixed. On the one hand, USD/CHF drew strong support from 0.9443 and rebounded. On the other hand, it is bounded inside medium term falling channel and limited below 38.2% retracement of 1.0342 to 0.9437 at 0.9783. On the downside, break of 0.9582 support will dampen our bullish view and turn bias back to the downside for 0.9437. This could also extend the fall from 1.0342 through 0.9437/43 key support level. On the upside, above 0.9772 will revive the bullish case of reversal and turn bias back to the upside.
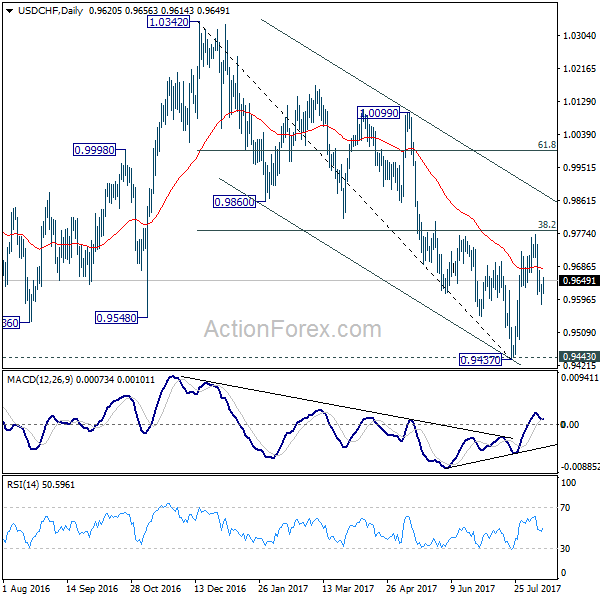
In the bigger picture, current development argues that USD/CHF has successfully defended 0.9443 key support level. And long term range trading in 0.9443/1.0342 is extending with another rise. At this point, there is no sign of an up trend yet. Hence, while further rise is expected in USD/CHF, we'll start to be cautious on loss of momentum above 61.8% retracement of 1.0342 to 0.9437 at 0.9996. However, firm break of 0.9443 will carry larger bearish implication and would target next key support at 0.9072.
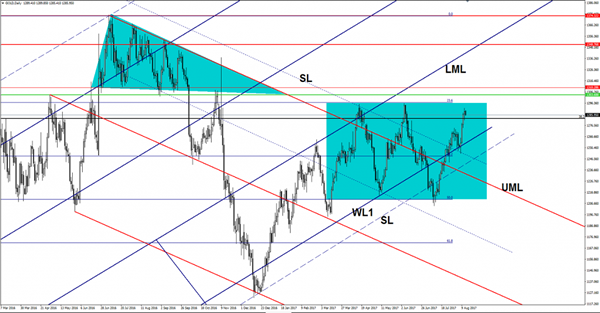
GOLD Upside Paused
Gold dropped in the morning, even if the Kiwi and Aussie increased versus the greenback. Could come back to retest the broken 38.2% retracement level before will climb much higher on the daily chart. Maybe will consolidate above the static support (resistance turned into support) because needs to recapture more directional energy.