
Sample Category Title
EUR/USD Renewed Upside Pressures
EUR/USD bullish pressures are still on despite ongoing consolidation. Hourly resistance is given at 1.1910 (02/08/2017 high). Hourly support can be found at 1.1689 (09/08/2017 high). Stronger support lies at 1.1613 (26/07/2017 low). Expected to show continued bullish pressures.
In the longer term, the momentum is now turning largely positive. We favour a continued bullish bias. Key resistance holding at 1.1871 (24/08/2015 high) has been broken while strong support lies at 1.0341 (03/01/2017 low).
Trade Idea: GBP/USD – Sell at 1.3055
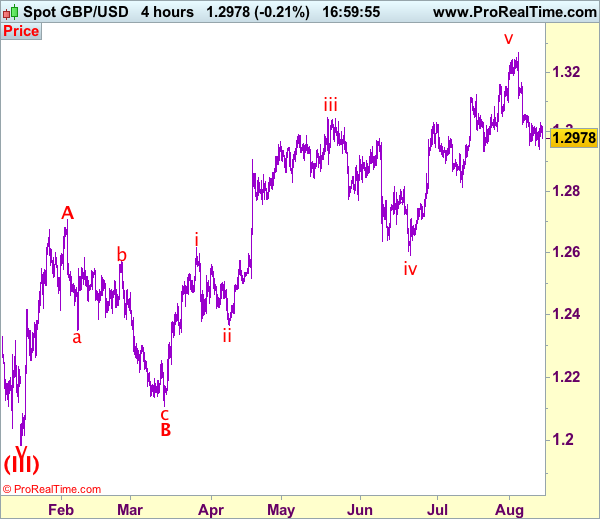
GBP/USD – 1.2973
Recent wave: Wave V of larger degree wave (III) has ended at 1.1986 and major correction has commenced from there for gain to 1.3000 and 1.3140-50
Trend: Near term up
Original strategy :
Sell at 1.3055, Target: 1.2860, Stop: 1.3115
Position: -
Target: -
Stop: -
New strategy :
Sell at 1.3055, Target: 1.2860, Stop: 1.3115
Position: -
Target: -
Stop:-
As cable rebounded after marginal fall to 1.2940 on Friday, suggesting minor consolidation above this level would be seen and another corrective bounce to 1.3030-35 is likely, however, reckon resistance at 1.3059 would limit upside and bring another decline later, below said support at 1.2933-40 would extend recent decline from 1.3269 top for retracement of early upmove, hence further weakness to 1.2890-00 and possibly towards 1.2850-60 but previous support at 1.2812 would hold from here, bring another rebound later.
In view of this, would not chase this fall here and would be prudent to sell cable on subsequent recovery as resistance at 1.3059 should limit upside and bring another decline. Only above previous support at 1.3112 (now resistance) would abort and signal the fall from 1.3269 has ended instead, bring a stronger rebound to indicated resistance at 1.3165 first.
Our preferred count on the daily chart is that cable's rebound from 1.3500 (wave (A) trough) is unfolding as a wave (B) with A ended at 1.7043, followed by triangle wave B and wave C as well as wave (B) has ended at 1.7192, the subsequent selloff is the larger degree wave (C) which is still unfolding with minor wave (III) of larger degree wave 3 ended at 1.1986, hence wave (IV) correction is in progress which could either be a triangle wave (IV) of a complex formation but upside should be limited to 1.3500 and price should falter well below 1.4000, bring another decline in wave (V) of 3 for weakness to 1.1500, then 1.1200.
Trade Idea: GBP/JPY – Hold short entered at 142.50
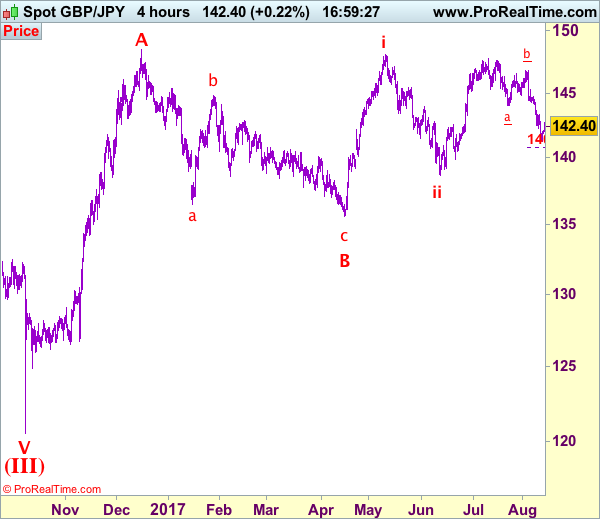
GBP/JPY - 142.33
Recent wave: Medium term low formed at 120.50 and (A)-(B)-(C) major correction has commenced with (A) leg ended at 148.45, hence wave (B) is unfolding for retreat to 131.00-10.
Trend: Near term down
Original strategy:
Sold at 142.50, Target: 140.50, Stop: 143.10
Position: - Short at 142.50
Target: - 140.50
Stop: - 143.10
New strategy :
Hold short entered at 142.50, Target: 140.50, Stop: 142.80
Position: - Short at 142.50
Target: - 140.50
Stop:- 142.80
Although sterling found support at 141.25 on Friday and staged a rebound, reckon upside would be limited to 142.75-80 and bring another decline, below 141.80-85 would bring retest of said support at 141.25 but break there is needed to confirm recent decline has resumed and extend recent decline from 147.75 top for retracement of early upmove to 140.80-85 (1.618 times projection of 147.75-144.05 measuring from 146.80), however, oversold condition should prevent sharp fall below 140.50 and reckon psychological support at 140.00 would hold from here.
In view of this, we are holding on to our short position entered at 142.50. Above 142.80 would defer and risk a stronger rebound to indicated resistance at 143.30, however, a sustained breach above this level is needed to signal a temporary low is formed, bring further subsequent gain towards 143.90-00.
Our preferred count is that larger degree wave V with circle is unfolding from 251.12 with wave (I) 219.34, (II): 241.38 and wave (III) is subdivided into 1: 192.60, 2: 215.89 (23 Jul 2008) and wave 3 ended at 118.87 earlier in 2009. The correction from there to 162.60 is wave 4 which itself is a double three and is labeled as first a-b-c ended at 151.53, followed by wave x at 139.03, 2nd a ended at 162.60, 2nd b at 146.75 and 2nd c leg of wave 4 ended at 163.00. Therefore, the decline from 163.00 to 116.85 is now treated as wave 5 which also marked the end of larger degree wave (III), hence wave (IV) major correction has commenced for retracement of the wave (III) from 241.38 and upside target at 183.95-00 (50% Fibonacci retracement of the wave (II) from 241.38) had been met, a drop below 160.00 would suggest wave (IV) has ended at 195.85, bring decline in wave (V) for initial weakness to 130 (already met) and 120.
Gold Pauses Rally At 10-Week High, Falls To Critical Level At 1280
Gold has paused its advance to a 10-week high of 1291.86 following a 4-day rally that led to the market becoming overextended. On the 4-hour chart, downside momentum seems to be picking up as the RSI has turned back down with a steep slope after reaching overbought territory above 70.
The key psychological level of 1280.00 is an immediate support level. A break below this may pave the way for a deeper decline towards 1271.33. This is the 23.6% Fibonacci retracement level of the rise from 1204.79 to 1291.86 and is a potential support level. It recently acted as a strong resistance level from July 28 to August 4 before it finally gave way on August 9. A move below the 50% Fibonacci at 1248.28 would increase downside pressure to target 1238.03 before the market sets its sights on 1204.79 (July 10 low).
A bounce off the key 1280.00 level could see the market re-test the August 11 high of 1291.86. Breaking this point would open the way to the next major high at 1296.07 (June 6 peak).
In the near-term, gold is expected to maintain a neutral bias. A close above the key psychological level of 1300.00 would indicate that the market could gain momentum and extended a move higher towards the next peak at 1337.24.
Looking at the bigger picture, the uptrend from 1204.79 to 1291.86 remains intact and the upward sloping 20-period SMA is supporting the bullish market structure.
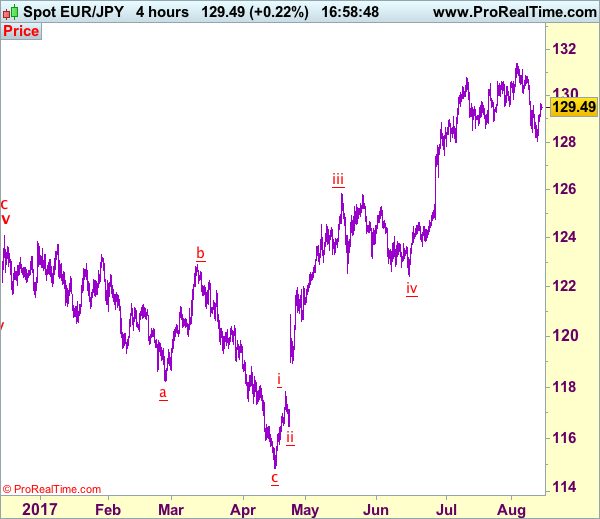
Trade Idea: EUR/JPY – Stopped profit and stand aside
EUR/JPY - 129.45
Recent wave: A 5-waver is unfolding from 114.85 with wave iii and iv ended at 125.82 and 122.40 respectively, wave v has possibly ended at 131.40.
Trend: Near term up
Original strategy:
Sold at 129.50, stopped profit at 128.60
Position: - Short at 129.50
Target: -
Stop: - 128.60
New strategy :
Stand aside
Position: -
Target: -
Stop:-
Despite falling to 128.05 on Friday, the subsequent stronger-than-expected rebound (our short position entered at 129.50 stopped profit at 128.60 with 90 points profit) suggests the fall from 131.40 top has formed a temporary low there, hence upside risk is seen for a retracement of this fall to 129.90-00, however, reckon upside would be limited to 130.40-45 and price should falter below 130.87 resistance and bring another decline later.
On the downside, whilst pullback to 129.00 cannot be ruled out, reckon downside would be limited to 128.50-55 and price should stay well above said support at 128.05 and bring another rebound. Only below said last week’s low at 128.05 would signal the fall from 131.40 top is still in progress and revive bearishness for further decline towards previous support at 127.44.
Our latest preferred count is that wave (ii) is ABC-X-ABC which ended at 123.33 and wave (iii) is unfolding with wave iii ended at 100.77, followed by wave iv at 111.57 and wave v as well as the wave (iii) has ended at 97.04, followed by wave (iv) at 111.43 and wave (v) has ended at 94.12 which is also the end of the larger degree v, this also implied the major wave (C) has also ended there, hence major correction has commenced from there with (A) leg unfolding in its lower degree wave c which has possibly ended at 145.69. Under this count, A-B-C wave (B) has commenced with A leg ended at 136.23, wave B at 143.79 and wave C has possibly ended at 149.79.
Our larger degree count is that the decline from 139.26 is wave (C) and is sub-divided into a diagonal triangle i-ii-iii-iv-v with wave i - 105.44, wave ii- 123.33, wave iii - 97.03, wave iv - 111.43, followed by the final wave v as well as the end of wave (C) at 94.12, this also mark the bottom of larger degree wave B. Under this count, major rise in wave C has commenced as an impulsive wave with minor wave III ended at 145.69, wave V is still in progress for further gain to 150.00. Having said that, this so-called wave V could well be the first leg of larger degree 5-waver wave C and this wave C should bring at least a retest of wave A top at 169.97 (July 2008).
Dollar Short Bets At A Record Level Since 2013
Hedge Funds have increased short positions on the dollar
FOMC minutes would be vital
Fundamental Analysis
The CFTC data is showing that the short bets are at a record level since 2013. This means there could be more weakness ahead for the dollar index. The weakness in the dollar index is mainly due to the weak economic data and the speculators are betting that the Fed is not going to be hawkish. In the light of this, the upcoming FOMC minutes will have vital importance.
Technical Analysis
Looking at it from a technical perspective, the price did break the 93.77 mark but failed to close above that mark. The most recent candle pattern, Bearish Harami, is indicating that the odds are skewed in favour of downward move. The support that we are looking at is at the 91.51 mark (which is 15 Jan2015 low).
Trade Idea: AUD/USD – Sell at 0.7940
AUD/USD – 0.7874
Recent wave: Wave 5 ended at 1.1081 and major correction has commenced for fall to 0.7000 and then towards 0.6500-10
Trend: Near term up
Original strategy :
Sold at 0.8030, met target at 0.7880
Position: - Short at 0.8030
Target: - 0.7880
Stop: -
New strategy :
Sell at 0.7940, Target: 0.7790, Stop: 0.8000
Position: -
Target: -
Stop:-
Although aussie rebounded after falling to 0.7839 and consolidation above this level is in store, if our view that top has been formed at 0.8066 is correct, upside should be limited to 0.7940-50 and bring another decline, below said support at 0.7839 would extend the erratic fall from 0.8066 top (wave iii peak) for retracement of early upmove in wave iv to 0.7800, however, near term oversold condition should prevent sharp fall below 0.7786 support and price should stay above wave i top at 0.7712, bring rebound later.
In view of this, would not chase this fall here and would be prudent to sell aussie again on subsequent rebound as 0.7940-50 should limit upside. Above indicated resistance at 0.7980 would abort and suggest low is formed instead, bring a stronger rebound to 0.8000, then towards 0.8043 resistance, above there would signal the pullback from 0.8066 top has ended instead, bring retest of this level first. We are keeping our latest bullish count that recent impulsive waves is unfolding as (1 2, (i)(ii), i ii) and may extend headway towards 0.8150.
On the 4-hour chart, the move from 0.8066 is the wave 5 with i: 0.8860, ii: 0.8315, wave iii is an extended move ended at 1.0183, iv: 0.9706 and wave v has ended at 1.1081 (also the top of entire wave 5). The subsequent selloff is the major correction which is unfolding as ABC-X-ABC and 2nd A leg has ended at 0.8848, followed by a-b-c wave B which ended at 0.9758, hence, 2nd C wave is now in progress and indicated downside target at 0.7000 and 0.6950 had been met, so further fall to 0.6710-20 cannot be ruled out.

The Dollar Bounces Back Despite Weak CPI Reads, Japan’s Growth Accelerates
USD gives up gains amid soft CPI print
The US dollar came under renewed selling pressure on Friday amid a soft CPI report. Headline CPI printed at 1.7% y/y, while the market was expecting a reading of 1.8%. The core gauge, which excludes the most volatile components, held steady at 1.7%, matching expectations. The report is definitely not a game changer as weakening inflation pressures are no secret. However, this is another warning bell that is calling the Fed to take it easy with tightening.
The minutes of the July's FOMC meeting are due for release this Wednesday and they'll likely show that anemic inflation pressure has kept Fed members on their toes. We do not expect the monetary institution to lift borrowing rates in September, rather wait for December. However, Yellen will certainly give further details because of the balance sheet run-off. This could be as good a time as any to set a hard date for the kick-off.
EUR/USD bounced as high as 1.1847 on Friday afternoon and has stabilized at around 1.1820 since then. July's retail sales are due for release today. Headline gauge is expected to have risen 0.4% m/m compared to a contraction of 0.2% in the previous month, while sales excluding auto and gas should increase 0.4% m/m, compared to a decrease of 0.1% in June. A solid print of those indicators could ignite a dollar recovery as it would bode well for the US consumption and to some extend inflation.
Japan GDP growth beats expectations
Japan's growth came in much higher than forecasted at 1% q/q versus 0.6% for the second quarter. Looking back, this release is the best data in the last two and a half years. It also represents the sixth consecutive quarter of positive GDP growth.
Consumer spending has largely improved and helped spur on the good data. Indeed, spending rose 0.9% from Q1 and beat the estimate of 0.5% for the quarter. Consumer spending has traditionally been the weakest point of the Japanese economy. This is maybe changing, but a string of data will be needed to confirm this trend.
Recent fundamentals are good news for the Bank of Japan, which is still the only major central bank not able to hint about further tightening. For the time being, good numbers must at some point translate into inflation. Nationwide inflation stands at 0.4% y/y – way below the inflation target of 2% – and this despite the country's Abenomics policies and massive quantitative easing. The BoJ monetary policy still cannot be considered as a success. The only true gains have been in stock market, where the Nikkei 225 increased by 16% over the last 12 months.
Currency-wise, the yen is weakening against the dollar and remains under pressure for further appreciation. Geopolitical tensions and market uncertainties may trigger a risk-off move towards yen again. This is the curse of being a safe haven.
Technical Outlook: USDJPY Rallies After Long-Legged Doji On Friday, US Retail Sales Eyed For Fresh Signal
The dollar rallied against yen on Monday as geopolitical tensions eased, recovering last week's heavy losses.
Larger bears showed strong indecision ant key 108.80 support (low of 14 June which was dented on Friday's spike to 108.72 low) after long-legged Doji candle was left on Friday.
Fresh rally is forming reversal pattern on daily chart which requires sustained break above psychological 110.00 barrier (also Fibo 38.2% of 112.19/108.72 bear-phase) for confirmation.
Bullish scenario of lift above 110.00 pivot would open way for stronger recovery towards barriers at 110.45 and 110.85, with key resistance at 111.00 expected to come in focus.
Alternatively, fresh downside risk could be expected while 110.00 barrier caps.
US retail sales data on Tuesday (0.4% f/c for July vs -0.2% in June) are in focus and expected to generate fresh signals.
Res: 109.88, 110.00, 110.16, 110.45
Sup: 109.34, 109.03, 108.80, 108.72
Lackluster US Inflation Data Weigh On The Dollar
The greenback took another hit on Friday, after the US CPI data for July disappointed market expectations. Even though the core CPI rate remained unchanged as anticipated, the headline rate rose by less than what was expected, likely leading investors to add to their short-USD positions. This lackluster set of data was soon followed by some cautious comments from Dallas Fed President Robert Kaplan, who is a voting FOMC member this year. He said that he would like to see evidence of progress towards the inflation target before raising rates again, and that he is “willing to be patient” for now. Indeed, the probability for another hike this year fell to below 40% in the aftermath of these developments from roughly 50% previously, according to the Fed funds futures.
Even though the outlook for the dollar remains negative, and we are not calling for a reversal yet, we should point out that the short-USD trade is looking increasingly crowded to us. Market expectations for another near-term Fed hike are already very subdued, and economic data have frequently surprised to the downside lately. Meanwhile, the continued uncertainty on the US political front probably intensified the negative sentiment surrounding the greenback. Bearing all these in mind, we believe that further downbeat US developments could have a diminishing negative impact on the dollar, while any positive US news could result in strong upside reactions, especially considering the thin-liquidity trading environment in August.
The next major market mover for the dollar will probably be the minutes of the July FOMC meeting, due out on Wednesday. We will look for specific details as to when the Fed is set to announce a normalization of its enormous balance sheet, and on whether the “cautious” camp among the FOMC has grown larger in the face of soft inflation.
EUR/USD rebounded following the US CPI data on Friday from near the crossroads of the 1.1750 (S1) hurdle and the short-term uptrend line taken from the low of the 23rd of June. The rate hit resistance a few pips above the 1.1830 (R1) level and subsequently, it retreated somewhat. Given that the rate continues to trade above the aforementioned line, we consider the short-term picture to still be positive. As such, we would expect the bulls to retake control soon and perhaps aim for another test near the 1.1830 (R1) zone. A clear break above that barrier could pave the way for further upside extensions towards our next resistance at 1.1900 (R2).
How big of a concern is the strong AUD for the RBA?
During the Asian day Tuesday, the RBA will release the minutes of its August policy gathering. At that meeting, the Bank acknowledged the latest progress in employment growth, but maintained its concerns regarding subdued wage growth. Perhaps more importantly, the officials expressed discomfort with the latest AUD appreciation. Even though the currency reacted little at the time, Governor Lowe recently raised the stakes by reminding investors that direct FX intervention is always on the table if needed. As such, these minutes may be closely watched for more details regarding how big of a concern the strong AUD is for policymakers. Clear signals that the Bank wants a lower Aussie or any mention to intervention, could weigh on the currency. Having said that, we think that AUD's short-term direction may be primarily decided by the wage data for Q2, due out on Wednesday.
AUD/USD traded higher on Friday after it hit support at 0.7840 (S2), and during the early European morning Monday, it is trading marginally above the 0.7900 (S1) level. Even though the price structure on the 4-hour chart suggests a short-term downtrend, considering the rate's proximity to the key barrier of 0.7800 (S3), we prefer to stay sidelined for now. That hurdle was the upper bound of the sideways range that contained the price action from the 2nd of March 2016 until the 14th of July and thus, it may be proved a rebound zone now that the rate is trading above it. As such, even in case the pair dips on the RBA minutes tonight, we would remain mindful of a potential rebound from near 0.7800 (S3). We prefer to wait for a clear close below that level before we begin to examine the case for larger declines.
Today's highlights:
The calendar is very light today. The only noteworthy indicator we get is Eurozone's industrial production for June.
As for the rest of the week:
On Tuesday, besides the RBA minutes, we also get CPI data for July from both the UK and Sweden. In the US, retail sales for the same month are due out. On Wednesday, the main event will probably be the July FOMC minutes. We also get Australia's wage price index for Q2 as we already mentioned, as well as the UK employment data for June. On Thursday, focus will be on Australia's jobs data and UK retail sales, both for July. Finally on Friday, Canada's inflation data for July will take center stage.
EUR/USD
Support: 1.1750 (S1), 1.1715 (S2), 1.1655 (S3)
Resistance: 1.1830 (R1), 1.1900 (R2), 1.1980 (R3)
AUD/USD
Support: 0.7900 (S1), 0.7840 (S2), 0.7800 (S3)
Resistance: 0.7950 (R1), 0.8000 (R2), 0.8060 (R3)